Earnings reports from Chinese giants raise concerns! Is it a good time to buy on dips?

Tencent has fallen below the HKD 500 mark. Can key support levels trigger a rebound?
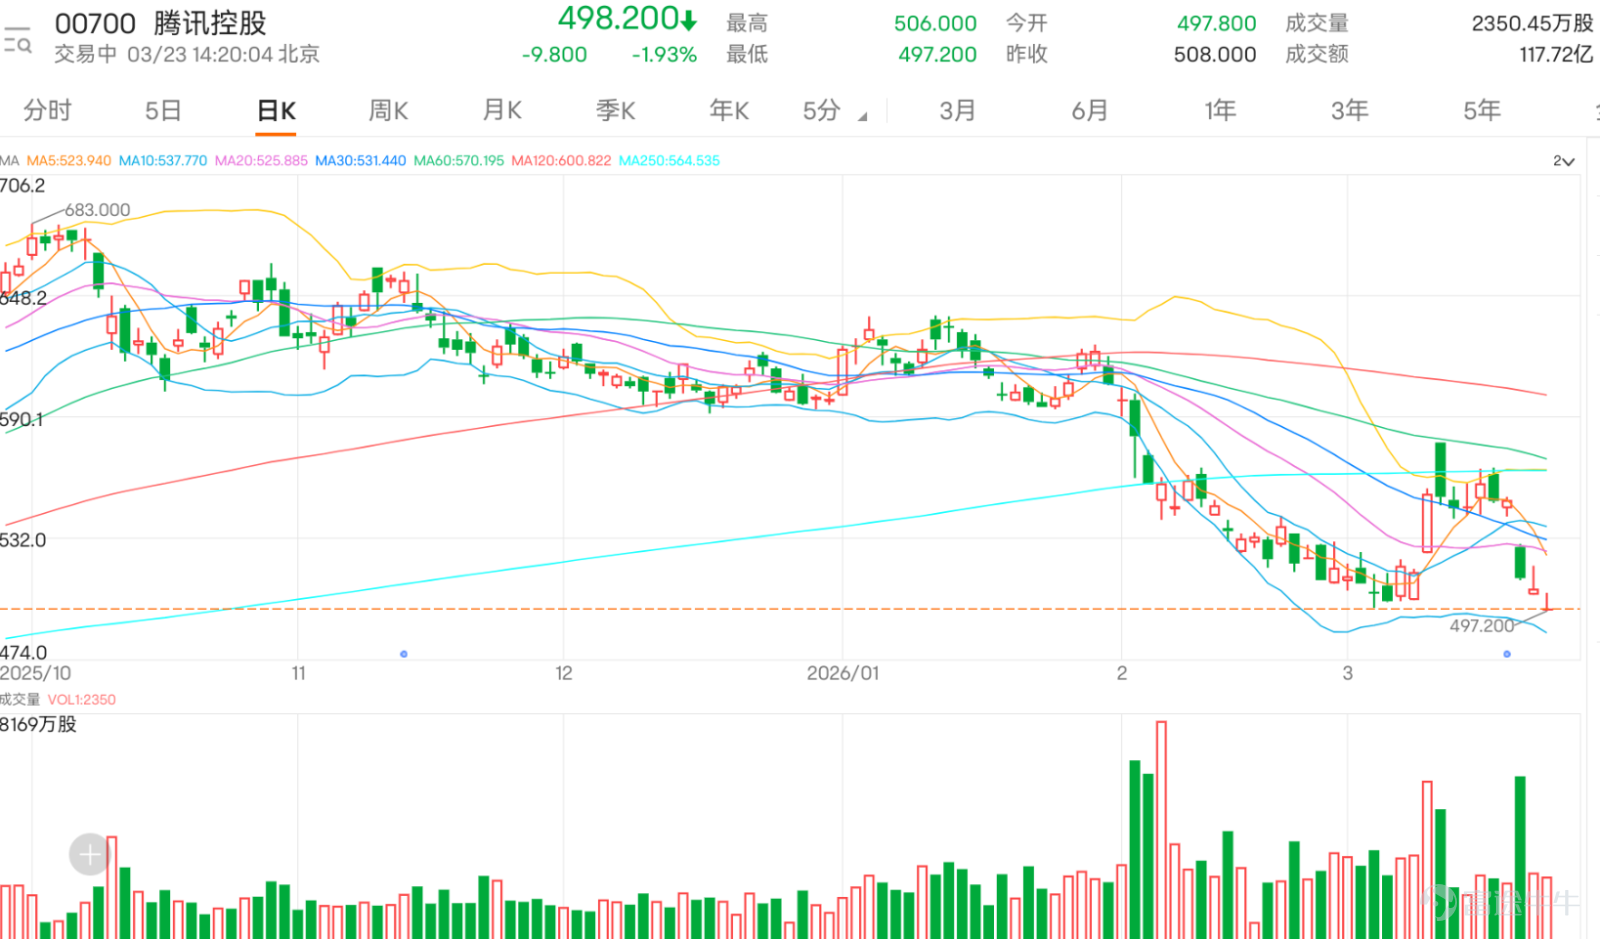
$TENCENT (00700.HK)$ The recent trend has been weak, with persistent pressure on the stock price. It is currently down nearly 2%, last trading at HKD 498.2, having significantly broken through multiple important moving averages such as the 10-day (HKD 538.05), 30-day (HKD 531.53), and 60-day (HKD 570.24) lines, indicating a bearish technical pattern.
Observing various oscillation indicators, Tencent has entered the short-term oversold region, suggesting that the potential for a technical rebound is building. The Relative Strength Index (RSI) value is 35, which is near oversold levels. The Stochastic Oscillator also shows the stock in oversold territory and has issued a buy signal. More notably, the CCI indicator is showing a 'bottom divergence' pattern, where the stock price hits new lows but the indicator does not follow, often seen as an early technical signal of weakening downward momentum and a possible upcoming trend reversal. Additionally, the Momentum Oscillator indicates the market is in a 'severely oversold' state, increasing the likelihood of a short-term bottoming rebound. These signals together form a basis for a short-term technical buy argument.
However, overall trend indicators remain broadly bearish, reminding investors that any rebound may face significant resistance. The MACD indicator continues to show a sell signal, indicating that the medium-term downtrend has not yet changed. The Bollinger Bands have widened, and the stock price is running close to the lower band, reflecting increased volatility and a downward trend. The Ichimoku Cloud and ADX indicators also issue sell signals, confirming the current dominant trend as bearish. Therefore, any rebound will first face heavy resistance from the recent cluster of moving averages (around HKD 530-538), while higher levels of HKD 532 and HKD 554 will be even more critical resistance points.
In terms of key price levels, the first major resistance above is at HKD 532, near the declining 10-day moving average, where a rebound is expected to face its initial test; if it breaks through, the next resistance will be around HKD 554. On the downside, the first support level is set at HKD 485, the lower edge of the recent consolidation range and a crucial defensive line for bulls; once breached, the stock price could further drop to the second support level at HKD 451, seeking stronger support.


Recently, several international investment banks have updated their ratings on Tencent, maintaining an overall positive outlook. After discussions with Tencent's management, UBS Group noted that the company’s HunYuan 3.0 model is set to launch in mid-April, focusing on empowering ecosystems through enhancing user engagement within WeChat’s ecosystem, monetizing across payment, advertising, gaming, and other scenarios. The current forward P/E ratio of 14x undervalues the stability of core businesses and AI's long-term potential. UBS maintains a 'Buy' rating with a target price of HKD 780, listing Tencent as a top industry pick.
Nomura also maintained a 'Buy' rating, noting that Tencent's AI investment budget for 2026 will double to over RMB 36 billion, accounting for more than 4% of its projected revenue that year. Coupled with the cloud business strategy shifting towards external clients, cloud revenue growth is expected to increase from 16% this year to 20%. Due to a high base effect, gaming revenue growth is expected to slow from 22% to 13%, while advertising will remain stable at an 18% growth rate. Given short-term profit margin pressures from AI investments, Nomura lowered its non-GAAP net profit forecasts for 2026 and 2027 by 3% and 1% respectively, and reduced the target price from HKD 775 to HKD 727.
As of the observation benchmark date of March 17, 2026, Tencent's stock price fell cumulatively by 6.73% over the following two trading days. Corresponding put derivatives all recorded significant increases: $UB#TENCTRP2812L.P (58047.HK)$ 、 $BI#TENCTRP2812D.P (57847.HK)$ During this period, they rose by 109% and 94%, respectively, $BITENCT@EP2606A.P (23122.HK)$ 、 $UBTENCT@EP2606A.P (21984.HK)$ while the increases were 75% and 62%.

Below are selected warrant recommendations for the underlying asset Tencent (00700), covering call warrants, put warrants, bull contracts, and bear contracts. Exercise prices or stop-loss levels and recommendation rationale are provided. For call warrants, $BITENCT@EC2606A.C (16225.HK)$ the exercise price is HKD 530.5, with leverage of approximately 9.9 times. Its relatively high leverage offers potentially greater returns; and $HSTENCT@EC2606A.C (16090.HK)$ the exercise price is also HKD 530.5, with leverage of around 10.5 times. It has the lowest premium and implied volatility, making it suitable for investors looking to participate in bullish positions at a lower cost.
In the put warrant section, $BITENCT@EP2608A.P (26075.HK)$ the exercise price is HKD 466.46, with leverage of about 7 times. The relatively high leverage helps amplify gains from bearish positions; $BPTENCT@EP2605A.P (19459.HK)$ the exercise price is HKD 460, with leverage of approximately 14.9 times. Not only does it have the lowest premium, but it also offers higher leverage, providing an efficient choice for those expecting a downturn.
Among the recommended bull contracts,$JP#TENCTRC2608B.C (62984.HK)$The recovery price is 485 yuan, with a leverage of approximately 23.3 times. The leverage price is relatively high, suitable for those optimistic about a short-term rebound;$UB#TENCTRC2607T.C (58800.HK)$The recovery price is also 485 yuan, with a leverage of about 24.4 times. It features high actual leverage and low premium, effectively capturing upward movements.
Regarding bearish certificates, $BI#TENCTRP2812D.P (57847.HK)$The recovery price is 585 yuan, with a leverage of about 6.5 times. The leverage price is relatively high, making it convenient for hedging against downside risks;$SG#TENCTRP2812G.P (58373.HK)$The recovery price is 595 yuan, with a leverage of around 6.1 times. It has the lowest premium and relatively higher actual leverage, making it an ideal tool when the market sentiment is bearish.

Tencent's stock price has fallen below the 500 Hong Kong dollar mark amid recent increased AI investments and divergent target prices from major banks. At this juncture, would you lean more towards buying to establish positions or holding cash to wait for clearer signals? Feel free to share your insights in the comments section. For more market analysis, stay tuned to 'Hong Kong Stock Warrants Jenny' for daily updates!$Hang Seng Index (800000.HK)$$Hang Seng TECH Index (800700.HK)$
Reminder: This article does not constitute any investment advice.
This article is for reference only and does not constitute any investment advice. The market data, opinions, and analysis contained herein may change at any time without prior notice. We are not responsible for any loss or damage caused by reliance on the information in this article. Technical analysis only shows whether certain technical conditions are met; a comprehensive assessment of asset performance should be conducted using additional data. Decisions to trade should not be based solely on this article. Please note that past performance is not indicative of future results.
#HongKongStocks #RealTimeAnalysis #WarrantsSelection #WarrantsStrategy #DerivativesHedging #HongKongWarrantsJenny Tencent #00700 #TechStocks #TechnicalAnalysis
Risk Disclaimer: The above content only represents the author's view. It does not represent any position or investment advice of Futu. Futu makes no representation or warranty.Read more

Comments
to post a comment
2
7