
Earnings reports from Chinese giants raise concerns! Is it a good time to buy on dips?

Alibaba plunges after earnings – is it a crisis or an opportunity?
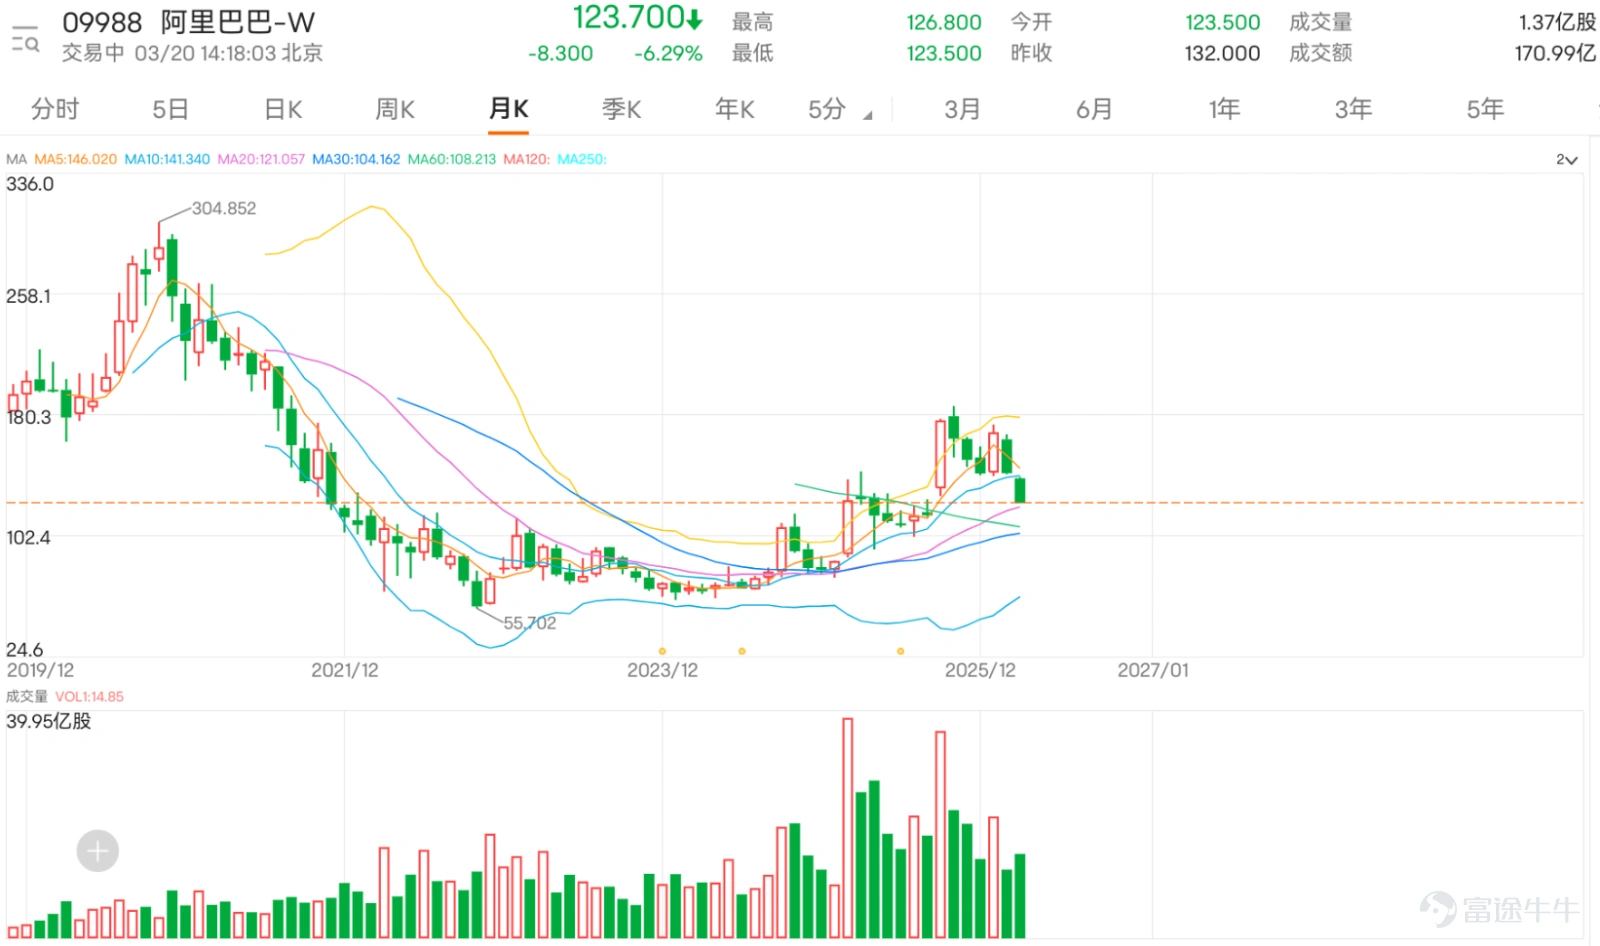
$BABA-W (09988.HK)$ Last quarter’s results fell short of market expectations, putting significant pressure on the stock price. It plummeted over 6%, hitting an intra-day low of 123.5 yuan, marking a one-month low. Observing the moving average system, the stock price has consecutively broken below several key moving averages such as the 10-day, 30-day, and 60-day lines, forming a typical bearish pattern. The overall technical outlook remains weak, indicating that the medium-term trend still faces certain pressures. For the stock to reverse the current weakness, it needs to effectively break through the resistance levels provided by these moving averages.
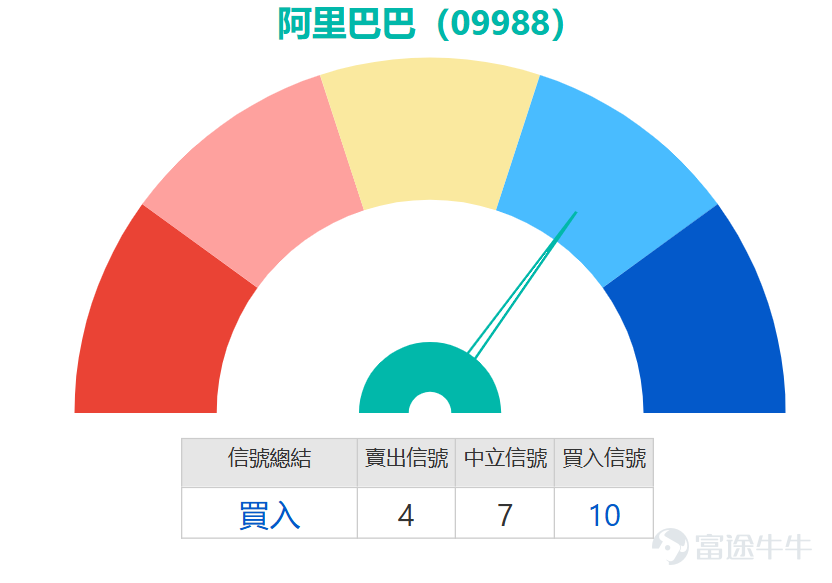
Various technical indicators show clear divergence but contain several rebound signals: The RSI index is currently at 32, close to the oversold region, showing signs that downward momentum is gradually slowing. The stochastic oscillator is clearly in the oversold zone, issuing a short-term buy signal, which typically suggests a rebound is brewing. The VR (Volume Ratio) indicator further points out that the market has entered a severely oversold area, creating conditions for a bottoming-out process and also issuing a buy signal. Additionally, the MACD indicator maintains a buy signal. However, indicators like ADX, ROC, and Bollinger Bands still show sell signals, reflecting that the current trend strength remains bearish. Summarizing all indicators, the overall signal is categorized as a buy with a strength level of 10, indicating that despite some indicators remaining bearish, expectations for an oversold rebound are significantly strengthening, revealing potential short-term opportunities amidst technical divergence.
In terms of key support and resistance levels, the immediate support is at 121 yuan, followed by a secondary support at 115.8 yuan; the first resistance is at 134.3 yuan, and the second resistance is at 147.1 yuan. The stock price is now very close to the first support level at 121 yuan. If it can find effective support near this level, there may be potential for an upward test towards the resistance level at 134.3 yuan. However, if it unfortunately breaks below the support level, it might further decline to 115.8 yuan. Notably, over the past five days, the stock price's fluctuation range has reached 13.2%, reflecting a significant increase in market volatility. This not only expands profit opportunities for short-term trading but also requires investors to exercise greater caution in managing risks.

After the earnings announcement, although some major banks lowered their target prices for Alibaba, all nine maintained positive ratings such as 'Buy,' 'Overweight,' or 'Outperform.' The adjustments to the target prices showed a polarized trend: Two institutions raised their target prices while six lowered them, with significant differences in adjustment magnitudes. Among those raising their targets, Citi increased its target price from 195 yuan to 199 yuan (a 2.1% hike), while Huatai Securities substantially raised its target price from 175.3 yuan to 181.7 yuan (a 3.7% increase). Both firms accompanied these changes with a 'Maintain Buy' rating. Goldman Sachs retained its 'Buy' rating for Alibaba and kept it on its Asia-Pacific Conviction Buy List, maintaining the target price at 180 yuan.
Among those lowering their targets, Macquarie made the most substantial adjustment, cutting its target price from 216 yuan to 171.3 yuan (a 20.7% reduction), though it still maintained an 'Outperform' rating. Other institutions made relatively moderate cuts: Jefferies reduced its target from 218 yuan to 206 yuan (a 5.5% cut), JPMorgan from 210 yuan to 200 yuan (a 4.8% cut), Deutsche Bank from 210 yuan to 190 yuan (a 9.5% cut), HSBC from 188 yuan to 176 yuan (a 6.4% cut), and Bernstein from 186 yuan to 176 yuan (a 5.4% cut). All institutions maintained their original positive ratings despite lowering their target prices.
From the core perspective of brokerage firms, cloud services, real-time e-commerce, and AI strategies have become the three key rationales that institutions commonly favor. Citi noted that Alibaba Cloud's growth is further accelerating, with customer management revenue already showing signs of rebound; Jefferies mentioned that the company is embracing the agent-based AI era via Mobility-as-a-Service (MaaS), while fundamentals in real-time e-commerce continue to improve. Goldman Sachs believes that with a clearer outlook on AI business, the company's profitability could see a revaluation. JPMorgan directly pointed out that the market should not assign zero valuation to Alibaba’s Cloud Intelligence Group and real-time e-commerce operations. If the $100 billion cloud revenue target can be achieved and valued reasonably, the cloud business alone could be worth up to $400 billion—a figure that is currently not reflected in the stock price.
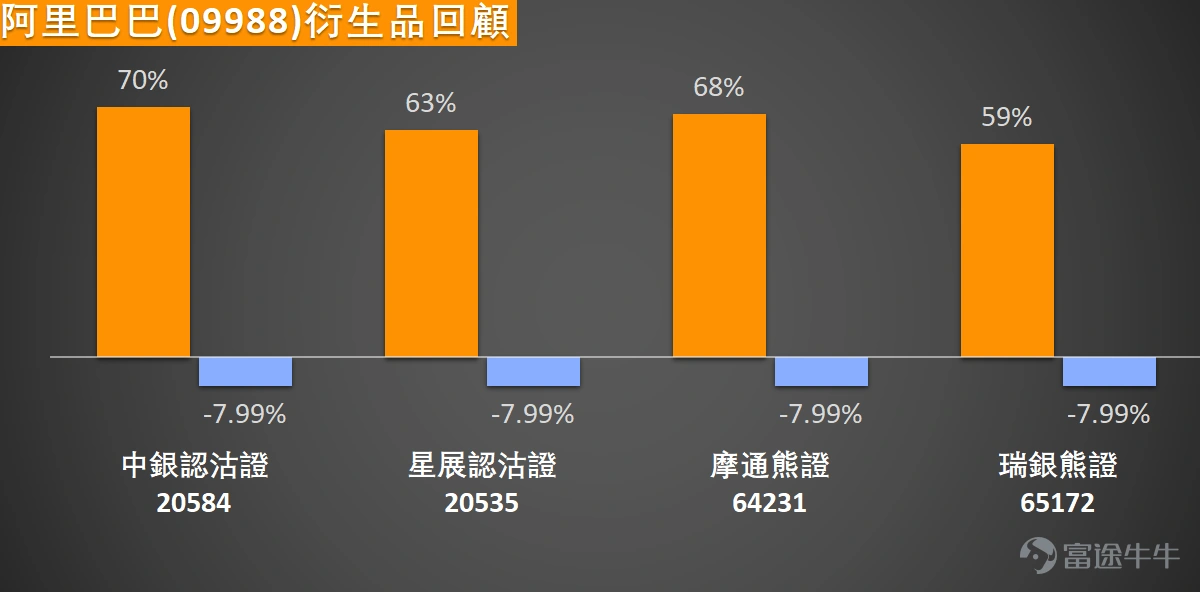
Looking back at March 18, 2026, Alibaba shares fell cumulatively by 7.99% over the following two days, while related put derivatives performed strongly. $JP#ALIBARP2812L.P (64231.HK)$ The increase reached 68% after two days, $UB#ALIBARP2811F.P (65172.HK)$ with a rise of 59%, $DSALIBA@EP2606A.P (20535.HK)$ and an increase of 63%, $BIALIBA@EP2606A.P (20584.HK)$ with maximum gains reaching 70%. All four products accurately reflected the downward movement of the underlying stock, showcasing the volatility amplification characteristics of hedging tools.
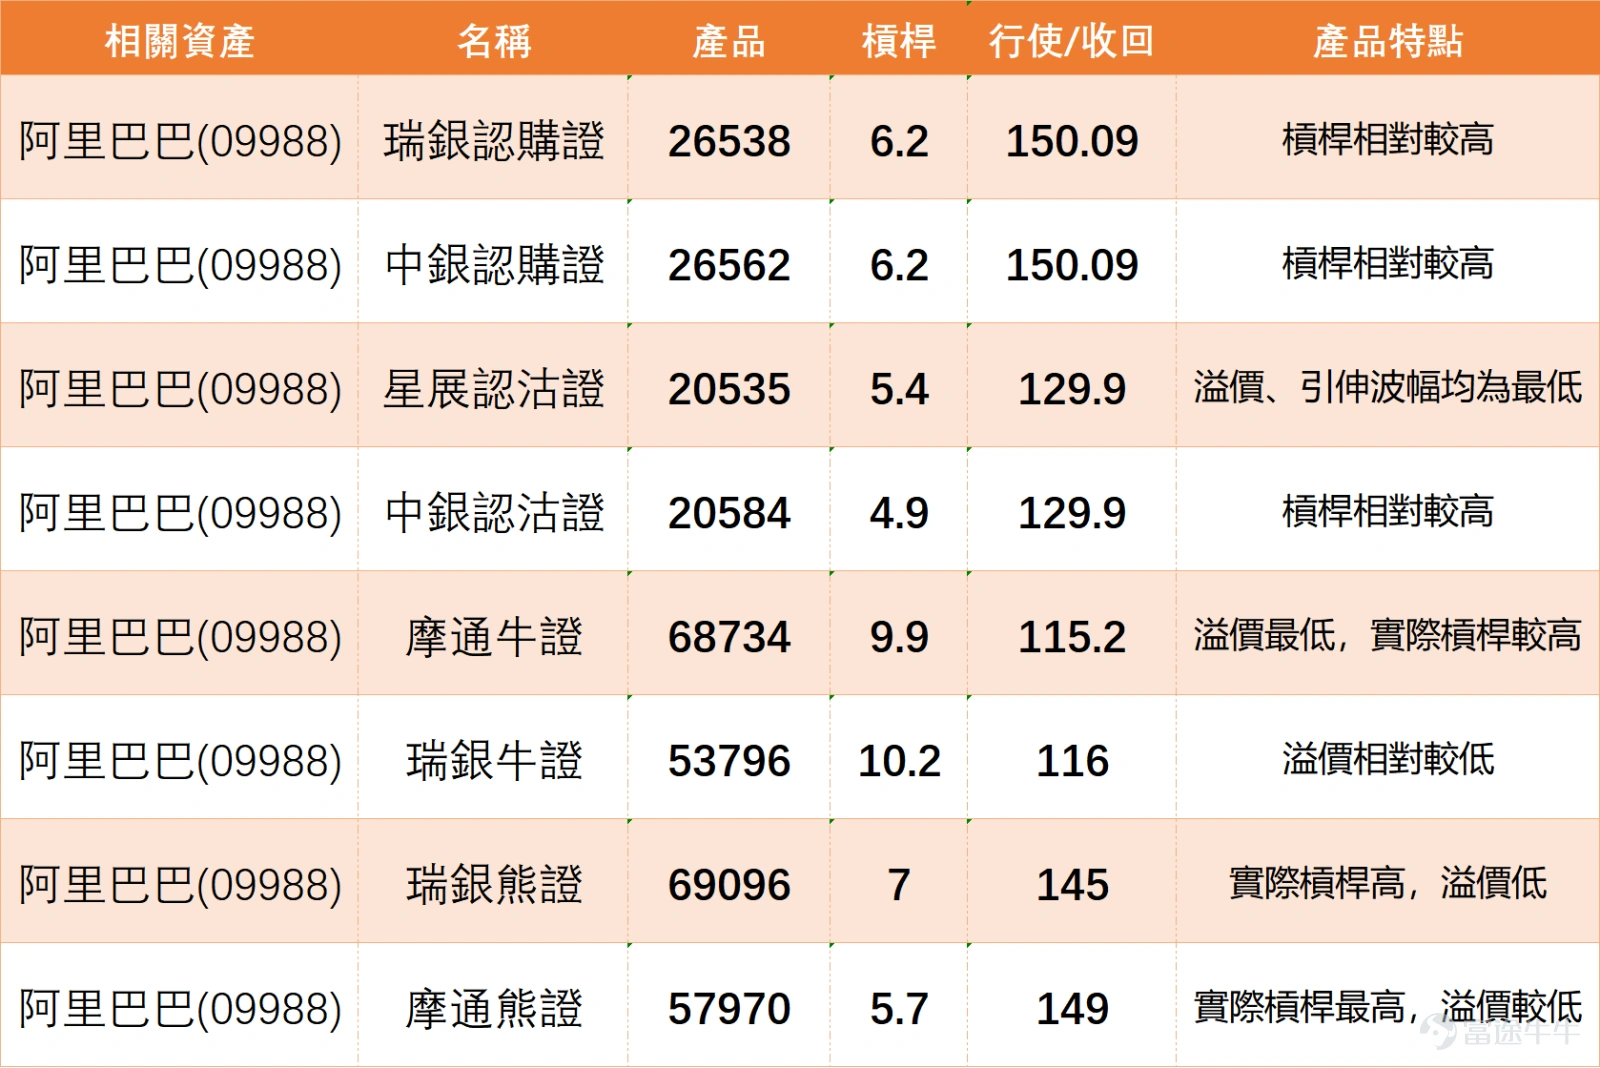
For investors who believe that Alibaba will rebound at key support levels, they may consider call warrants with relatively high leverage. For example, $UBALIBA@EC2608F.C (26538.HK)$ or $BIALIBA@EC2608E.C (26562.HK)$ both have the same exercise price of 150.09 yuan, offering about 6.2x leverage, making them suitable for capturing rapid rebounds. If one wishes to track the underlying stock performance with lower premiums and higher leverage, bull contracts would be a more efficient choice. $JP#ALIBARC2608I.C (68734.HK)$ With a recovery price of 115.2 yuan, it offers the lowest premium among similar products and provides nearly 9.9x actual leverage, balancing both defensive and offensive strategies. $UB#ALIBARC26075.C (53796.HK)$ The recovery price is 116 yuan, also with relatively low premium, providing approximately 10.2x actual leverage, making it another attractive bullish tool.
If the stock price is expected to fall below the current support range, consider put warrants or bear contracts. Regarding put warrants, $DSALIBA@EP2606A.P (20535.HK)$, with a strike price of 129.9 yuan, both its premium and implied volatility are the lowest in the market, offering a more advantageous holding cost.$BIALIBA@EP2606A.P (20584.HK)$With the same strike price of 129.9 yuan, it provides a relatively high leverage of 4.9 times. For investors who are bearish on the future market, bear contracts can offer higher leverage and performance that closely tracks downward movements.$UB#ALIBARP2810G.P (69096.HK)$The redemption price is 145 yuan, with an actual leverage of up to 7 times and low premium, making it suitable for those who are pessimistic about the short-term trend. If the anticipated decline target is further away, $JP#ALIBARP2809J.P (57970.HK)$The redemption price is set at 149 yuan, providing the highest actual leverage of 5.7 times among similar products, which can be used to bet on the stock price’s inability to rebound and its subsequent drop.
Similarly undergoing post-earnings adjustments, do you think Alibaba or $TENCENT (00700.HK)$compared, which one offers better allocation value? Can Alibaba's first support level at 121 yuan hold? Feel free to share your insights in the comment section. For more market analysis, stay tuned to 'HK Stock Warrants Jenny' daily updates!
Reminder: This article does not constitute any investment advice.
This article is for reference only and does not constitute any investment advice. Market data, opinions, and analyses contained herein may change at any time without prior notice. We are not responsible for any loss or damage caused by reliance on the information in this article. Technical analysis only shows whether certain technical conditions are met, and asset performance should be comprehensively evaluated in conjunction with other information. Trading decisions should not be made solely based on this article. Please note that past performance is not indicative of future results. $Alibaba (BABA.US)$$Hang Seng Index (800000.HK)$$Hang Seng TECH Index (800700.HK)$
#HongKongStocks #HangSengIndex #RealTimeAnalysis #WarrantsSelection #WarrantsStrategy #DerivativesHedging #HongKongWarrantsJenny #Alibaba #09988 #TechStocks #HangSengIndexTrends
Risk Disclaimer: The above content only represents the author's view. It does not represent any position or investment advice of Futu. Futu makes no representation or warranty.Read more

Comments (2)
to post a comment
1