
English
Back
Open Account
港股窩輪Jenny
wrote a column · Mar 20 10:35

Technical indicators collectively show bullish signals, Ping An approaches the key support line at 60 yuan

On the previous day (March 19th), $PING AN (02318.HK)$
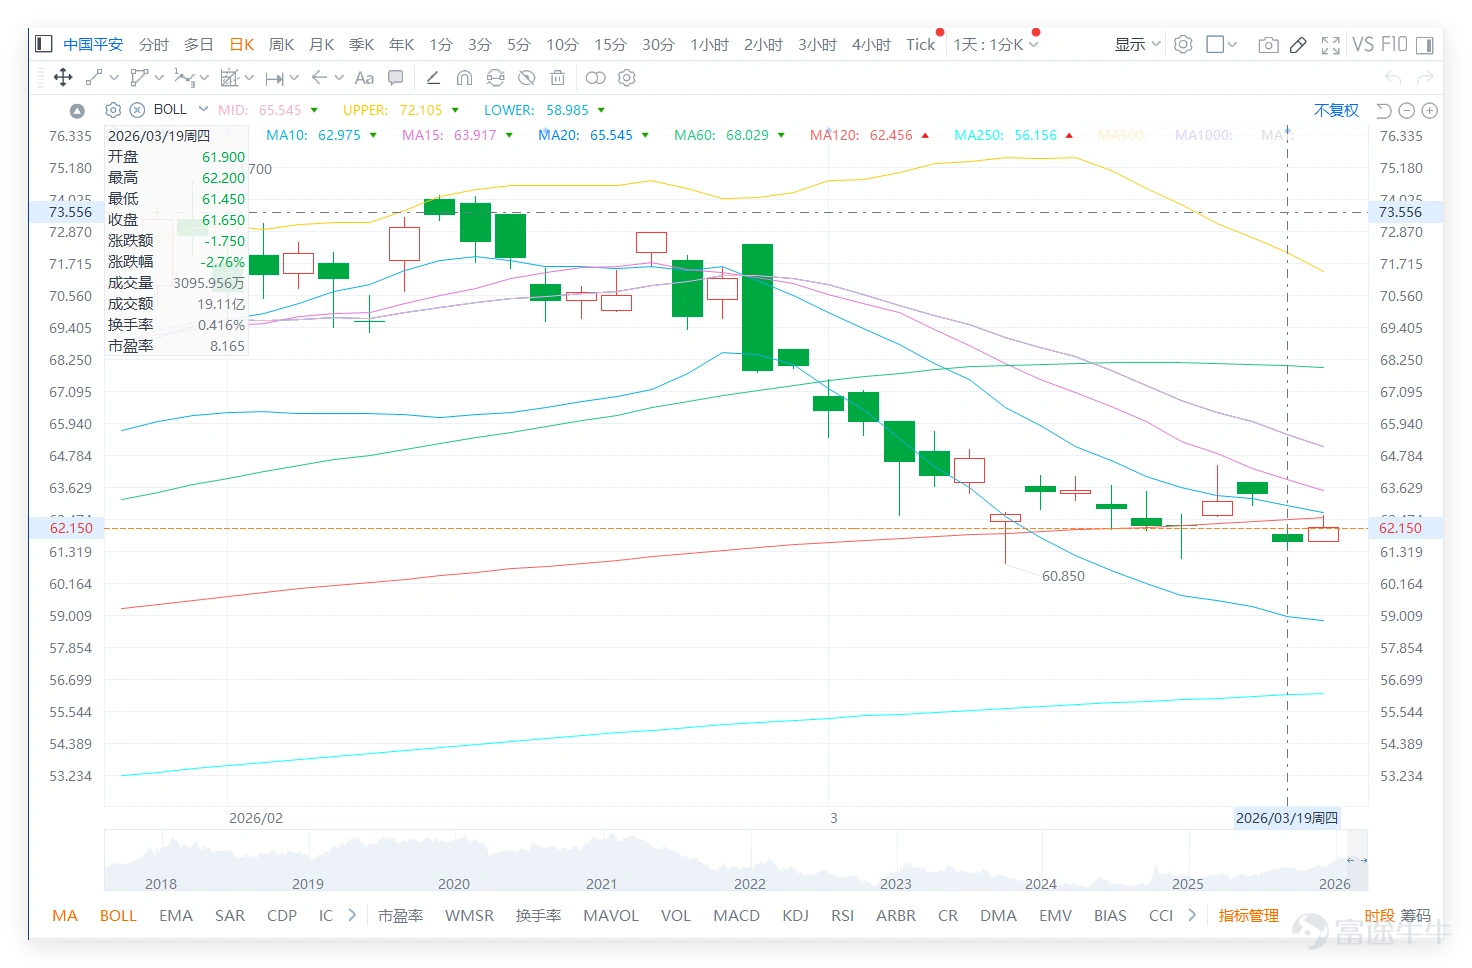
The stock closed at 61.65 yuan for the day, down 2.76% in a single day, with a trading volume of 1.911 billion yuan. It followed the sector's weakness but showed positive technical signals. Detailed analysis based on the latest technical data is as follows:
1. Moving average pattern: The closing price was 61.65 yuan, below the three main moving averages MA10 (62.98 yuan), MA30 (67.56 yuan), and MA60 (68.03 yuan). The technical pattern is weak, and the short-term trend is still suppressed by the moving averages.
On the previous day (March 19th), $PING AN (02318.HK)$ The stock closed at 61.65 yuan for the day, down 2.76% in a single day, with a trading volume of 1.911 billion yuan. It followed the sector's weakness but showed positive technical signals. Detailed analysis based on the latest technical data is as follows: 1. Moving average pattern: The closing price was 61.65 yuan, below the three main moving averages MA10 (62.98 yuan), MA30 (67.56 yuan), and MA60 (68.03 yuan). The technical pattern is weak, and the short-term trend is still suppressed by the moving averages. 2. Support and resistance: Support 2 is at 57.5 yuan, Support 1 is at 60 yuan, Resistance 1 is at 64.6 yuan, and Resistance 2 is at 69.9 yuan. In the short term, focus on the strength of the 60-yuan support level; if it can hold, the probability of a rebound increases. 3. Core technical indicators: The RSI indicator is 38, close to the oversold region. The Williams %R indicator shows an oversold condition but sends a neutral signal. The ROC indicator suggests selling, while the Bull-Bear Power indicator shows severe overselling, possible bottoming, and issues a buy signal. The MACD signal indicates selling, and Bollinger Bands also suggest selling. Multiple indicators are diverging, but overall they point to short-term overselling. 4. Comprehensive signals: Technical indicators summarize a 'buy' signal, with signal strength at 9, and an upward probability of 55%, slightly higher than 50%. The 5-day volatility is 5.4%, indicating moderate fluctuations, which is characteristic of a typical left-side rebound signal suggesting that the short-term may already be in an oversold state. Insurance sector peer stock technical review: Amid widespread declines, buy signals have turned red across the board March 1...
2. Support and Resistance: Support 2 is at 57.5 yuan, Support 1 is at 60 yuan, Resistance 1 is at 64.6 yuan, and Resistance 2 is at 69.9 yuan. The short-term focus is on the strength of the support at 60 yuan; if it holds, the probability of a rebound increases.
3. Core Technical Indicators: The RSI indicator is at 38, nearing the oversold region. The Williams %R indicator is in the oversold zone but showing a neutral signal. The ROC (Rate of Change) indicator suggests selling, while the Bull-Bear Power indicator points to severe overselling with potential bottoming-out and issues a buy signal. MACD signals selling, and Bollinger Bands also suggest selling. Multiple indicators show some divergence, but overall they indicate short-term overselling.
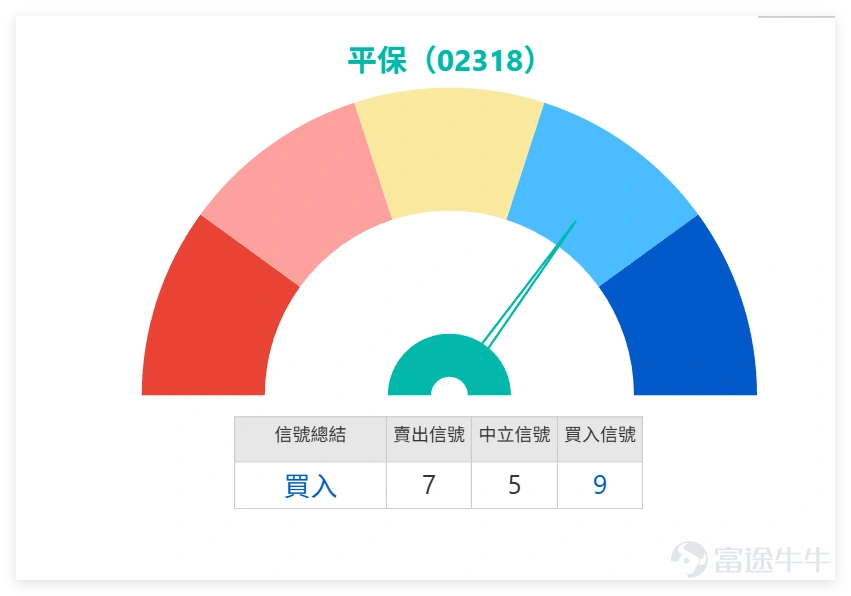
4. Comprehensive Signals: The technical indicator summary signal is 'Buy,' with a signal strength of 9 and an upward probability of 55%, slightly higher than 50%. The 5-day volatility is 5.4%, indicating moderate fluctuations. This is a typical left-side rebound signal, suggesting that the short-term may already be in an oversold condition.
On the previous day (March 19th), $PING AN (02318.HK)$ The stock closed at 61.65 yuan for the day, down 2.76% in a single day, with a trading volume of 1.911 billion yuan. It followed the sector's weakness but showed positive technical signals. Detailed analysis based on the latest technical data is as follows: 1. Moving average pattern: The closing price was 61.65 yuan, below the three main moving averages MA10 (62.98 yuan), MA30 (67.56 yuan), and MA60 (68.03 yuan). The technical pattern is weak, and the short-term trend is still suppressed by the moving averages. 2. Support and resistance: Support 2 is at 57.5 yuan, Support 1 is at 60 yuan, Resistance 1 is at 64.6 yuan, and Resistance 2 is at 69.9 yuan. In the short term, focus on the strength of the 60-yuan support level; if it can hold, the probability of a rebound increases. 3. Core technical indicators: The RSI indicator is 38, close to the oversold region. The Williams %R indicator shows an oversold condition but sends a neutral signal. The ROC indicator suggests selling, while the Bull-Bear Power indicator shows severe overselling, possible bottoming, and issues a buy signal. The MACD signal indicates selling, and Bollinger Bands also suggest selling. Multiple indicators are diverging, but overall they point to short-term overselling. 4. Comprehensive signals: Technical indicators summarize a 'buy' signal, with signal strength at 9, and an upward probability of 55%, slightly higher than 50%. The 5-day volatility is 5.4%, indicating moderate fluctuations, which is characteristic of a typical left-side rebound signal suggesting that the short-term may already be in an oversold state. Insurance sector peer stock technical review: Amid widespread declines, buy signals have turned red across the board March 1...
Technical Review of Insurance Sector Peers: Amid widespread declines, all buy signals are strongly positive.
On March 19, the insurance sector weakened overall. Apart from ZhongAn Online rising against the trend, the other five traditional insurance stocks fell. However, the most notable feature was that all six stocks issued 'Buy' signals. A detailed breakdown follows:
1. Traditional Insurance Stocks (5 stocks, all down):
$AIA (01299.HK)$ Closed at 82.8 yuan, down 2.07%. MA10 is 83.94 yuan, MA30 is 84.69 yuan, and MA60 is 84.47 yuan. The closing price is slightly below all moving averages. RSI 46 is near neutral. Buy signal strength is 8.
$CHINA LIFE (02628.HK)$ Closed at 28.4 yuan, down 1.39%. MA10 is 28.76 yuan, MA30 is 31.95 yuan, and MA60 is 31.18 yuan. The closing price is below all moving averages. RSI 40 is neutral but leaning weak. Buy signal strength is 7.
$NCI (01336.HK)$ Closed at 50.1 yuan, down 3.37%. MA10 is 52.17 yuan, MA30 is 57.33 yuan, and MA60 is 57.60 yuan. The closing price is below all moving averages. RSI 38 is nearing oversold levels. Buy signal strength is 7.
$CPIC (02601.HK)$ Closed at 23.7 yuan, down 1.25%. MA10 is 24.07 yuan, MA30 is 26.73 yuan, and MA60 is 26.45 yuan. The closing price is below all moving averages. RSI 41 is neutral but leaning weak. Buy signal strength is 7.
2. Counter-trend strong stock (1): $ZA ONLINE (06060.HK)$ Closed at HKD 32.8, up 2.82%. MA10 is at HKD 32.28, MA30 at HKD 35.53, and MA60 at HKD 35.51. The closing price is higher than MA10 but lower than MA30 and MA60. RSI 42 indicates neutral to weak conditions. The buy signal strength is 7. This is the only stock in the sector that recorded an increase, showing prominent resilience against declines.
Overall market sentiment: The sector was dragged down by the broader market trend, with a generally pessimistic sentiment. However, all six stocks showed buy signals, indicating from a technical perspective that the sector has entered an oversold region. Short-term downward momentum has been partially released, paving the way for a potential rebound.
Review and selection of Ping An's derivative products (Bull & Bear certificates): Opportunities for cautious leverage amid expectations of sector rebound
(I) Review of previous Warrant Bull/Bear performance:
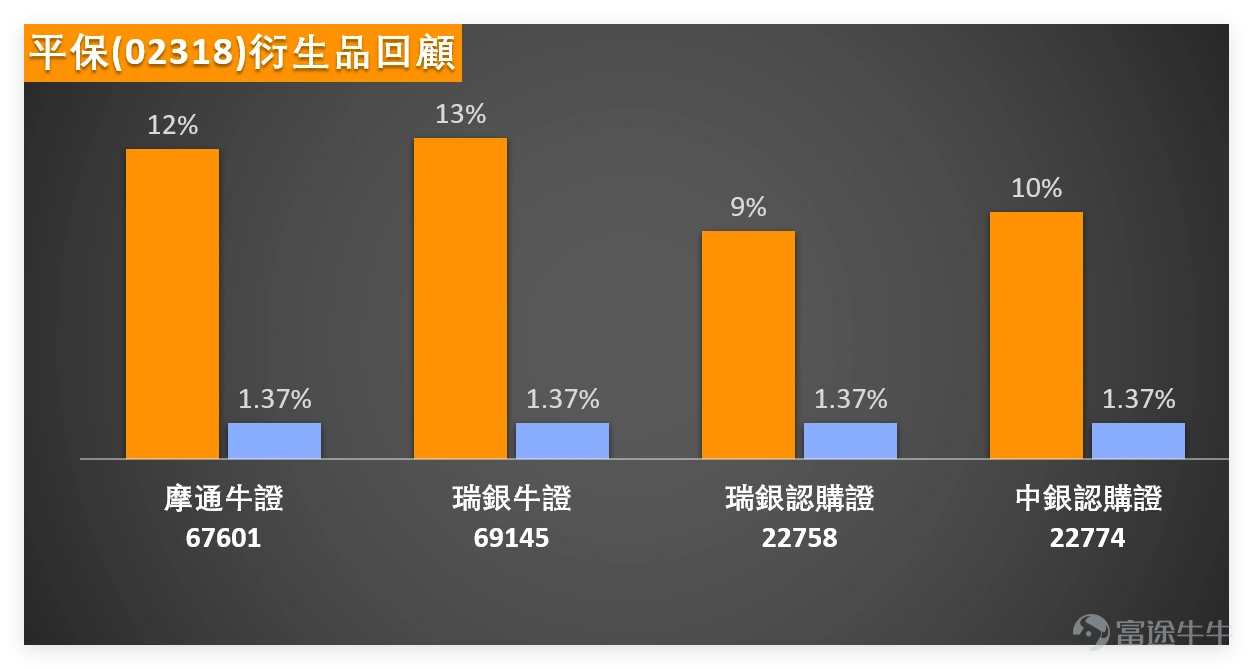
Reviewing the performance of Ping An-related Bull & Bear certificate products recommended on March 13, they have performed steadily: $UB#PINANRC2810F.C (69145.HK)$ A 13% increase after two days, $JP#PINANRC2810D.C (67601.HK)$ rose 12%, $BIPINAN@EC2605B.C (22774.HK)$ A 10% increase, $UBPINAN@EC2605B.C (22758.HK)$ A 9% increase, outperforming Ping An's 1.37% gain during the same period, capturing good leveraged returns for investors focusing on derivatives.
On the previous day (March 19th), $PING AN (02318.HK)$ The stock closed at 61.65 yuan for the day, down 2.76% in a single day, with a trading volume of 1.911 billion yuan. It followed the sector's weakness but showed positive technical signals. Detailed analysis based on the latest technical data is as follows: 1. Moving average pattern: The closing price was 61.65 yuan, below the three main moving averages MA10 (62.98 yuan), MA30 (67.56 yuan), and MA60 (68.03 yuan). The technical pattern is weak, and the short-term trend is still suppressed by the moving averages. 2. Support and resistance: Support 2 is at 57.5 yuan, Support 1 is at 60 yuan, Resistance 1 is at 64.6 yuan, and Resistance 2 is at 69.9 yuan. In the short term, focus on the strength of the 60-yuan support level; if it can hold, the probability of a rebound increases. 3. Core technical indicators: The RSI indicator is 38, close to the oversold region. The Williams %R indicator shows an oversold condition but sends a neutral signal. The ROC indicator suggests selling, while the Bull-Bear Power indicator shows severe overselling, possible bottoming, and issues a buy signal. The MACD signal indicates selling, and Bollinger Bands also suggest selling. Multiple indicators are diverging, but overall they point to short-term overselling. 4. Comprehensive signals: Technical indicators summarize a 'buy' signal, with signal strength at 9, and an upward probability of 55%, slightly higher than 50%. The 5-day volatility is 5.4%, indicating moderate fluctuations, which is characteristic of a typical left-side rebound signal suggesting that the short-term may already be in an oversold state. Insurance sector peer stock technical review: Amid widespread declines, buy signals have turned red across the board March 1...
(II) Selection of Ping An Warrants:
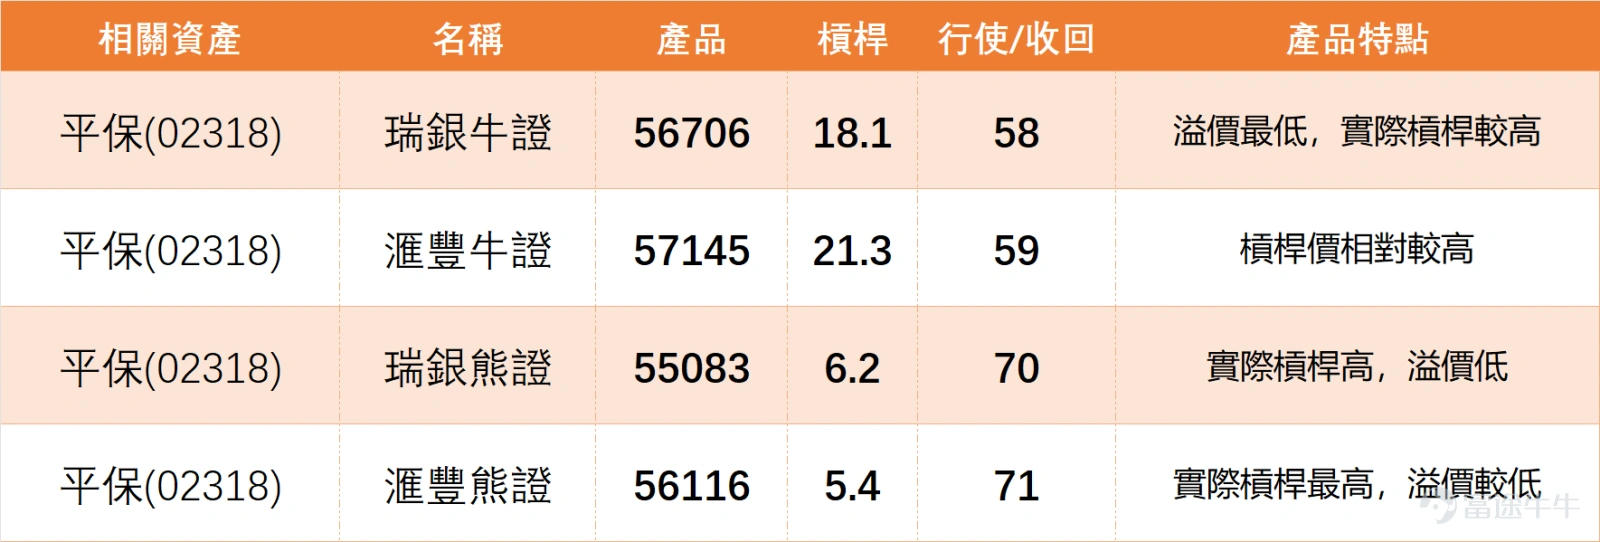
Based on Ping An’s 'oversold buy' technical pattern, we have selected two warrant products suited for short-term rebound expectations, for investors' reference:
1、 $UB#PINANRC2810G.C (56706.HK)$ : Actual leverage is 18.1, with a recovery price of 58 yuan. The core advantage is the lowest premium and relatively high actual leverage, making it suitable for investors who are optimistic about Ping An maintaining support at 60 yuan and expect a technical rebound.
2、 $HS#PINANRC2811C.C (57145.HK)$ : Actual leverage is 21.3, with a recovery price of 59 yuan. Leverage is relatively high, making it suitable for investors expecting a short-term oversold rebound in Ping An and who can tolerate some volatility.
On the previous day (March 19th), $PING AN (02318.HK)$ The stock closed at 61.65 yuan for the day, down 2.76% in a single day, with a trading volume of 1.911 billion yuan. It followed the sector's weakness but showed positive technical signals. Detailed analysis based on the latest technical data is as follows: 1. Moving average pattern: The closing price was 61.65 yuan, below the three main moving averages MA10 (62.98 yuan), MA30 (67.56 yuan), and MA60 (68.03 yuan). The technical pattern is weak, and the short-term trend is still suppressed by the moving averages. 2. Support and resistance: Support 2 is at 57.5 yuan, Support 1 is at 60 yuan, Resistance 1 is at 64.6 yuan, and Resistance 2 is at 69.9 yuan. In the short term, focus on the strength of the 60-yuan support level; if it can hold, the probability of a rebound increases. 3. Core technical indicators: The RSI indicator is 38, close to the oversold region. The Williams %R indicator shows an oversold condition but sends a neutral signal. The ROC indicator suggests selling, while the Bull-Bear Power indicator shows severe overselling, possible bottoming, and issues a buy signal. The MACD signal indicates selling, and Bollinger Bands also suggest selling. Multiple indicators are diverging, but overall they point to short-term overselling. 4. Comprehensive signals: Technical indicators summarize a 'buy' signal, with signal strength at 9, and an upward probability of 55%, slightly higher than 50%. The 5-day volatility is 5.4%, indicating moderate fluctuations, which is characteristic of a typical left-side rebound signal suggesting that the short-term may already be in an oversold state. Insurance sector peer stock technical review: Amid widespread declines, buy signals have turned red across the board March 1...
Risk Warning: The insurance sector remains weak overall. Even if a rebound occurs, its strength needs further confirmation. Investors participating in warrants or bull/bear certificates should align with their own risk tolerance, rationally control positions, and avoid blindly following trends.
The entire insurance sector shows buying interest. Which stock do you favor most? A. Ping An, B. AIA, C. ZhongAn, D. China Life.
Feel free to share your insights in the comment section. For more market analysis, please continue following ‘Hong Kong Stock Warrants Jenny’ for daily updates!
Reminder: This article does not constitute any investment advice.
This article is for reference only and does not constitute any investment advice. The market data, opinions, and analysis contained herein may change at any time without prior notice. We are not responsible for any loss or damage caused by reliance on the information in this article. Technical analysis only shows whether certain technical conditions are met; a comprehensive assessment of asset performance should be conducted using additional data. Decisions to trade should not be based solely on this article. Please note that past performance is not indicative of future results.
#HongKongStocks #RealTimeAnalysis #WarrantsSelection #WarrantsStrategy #DerivativesHedging #HongKongWarrantsJenny #PingAnInsurance #InsuranceSector #TechnicalAnalysis
Risk Disclaimer: The above content only represents the author's view. It does not represent any position or investment advice of Futu. Futu makes no representation or warranty.Read more
223K Views
Report
Comments (4)
Write a Comment...
4