
Semiconductor stocks are under pressure across the board. Is it time to "buy the dip" in SMIC?
Semiconductor stocks declined across the board, $SHANGHAI FUDAN (01385.HK)$ dropping over 7%, $BIREN TECH (06082.HK)$ dropping over 6%, $HUA HONG GRACE (01347.HK)$ dropping over 5%, $SMIC (00981.HK)$ 、 $OMNIVISION (00501.HK)$ dropping over 3%.
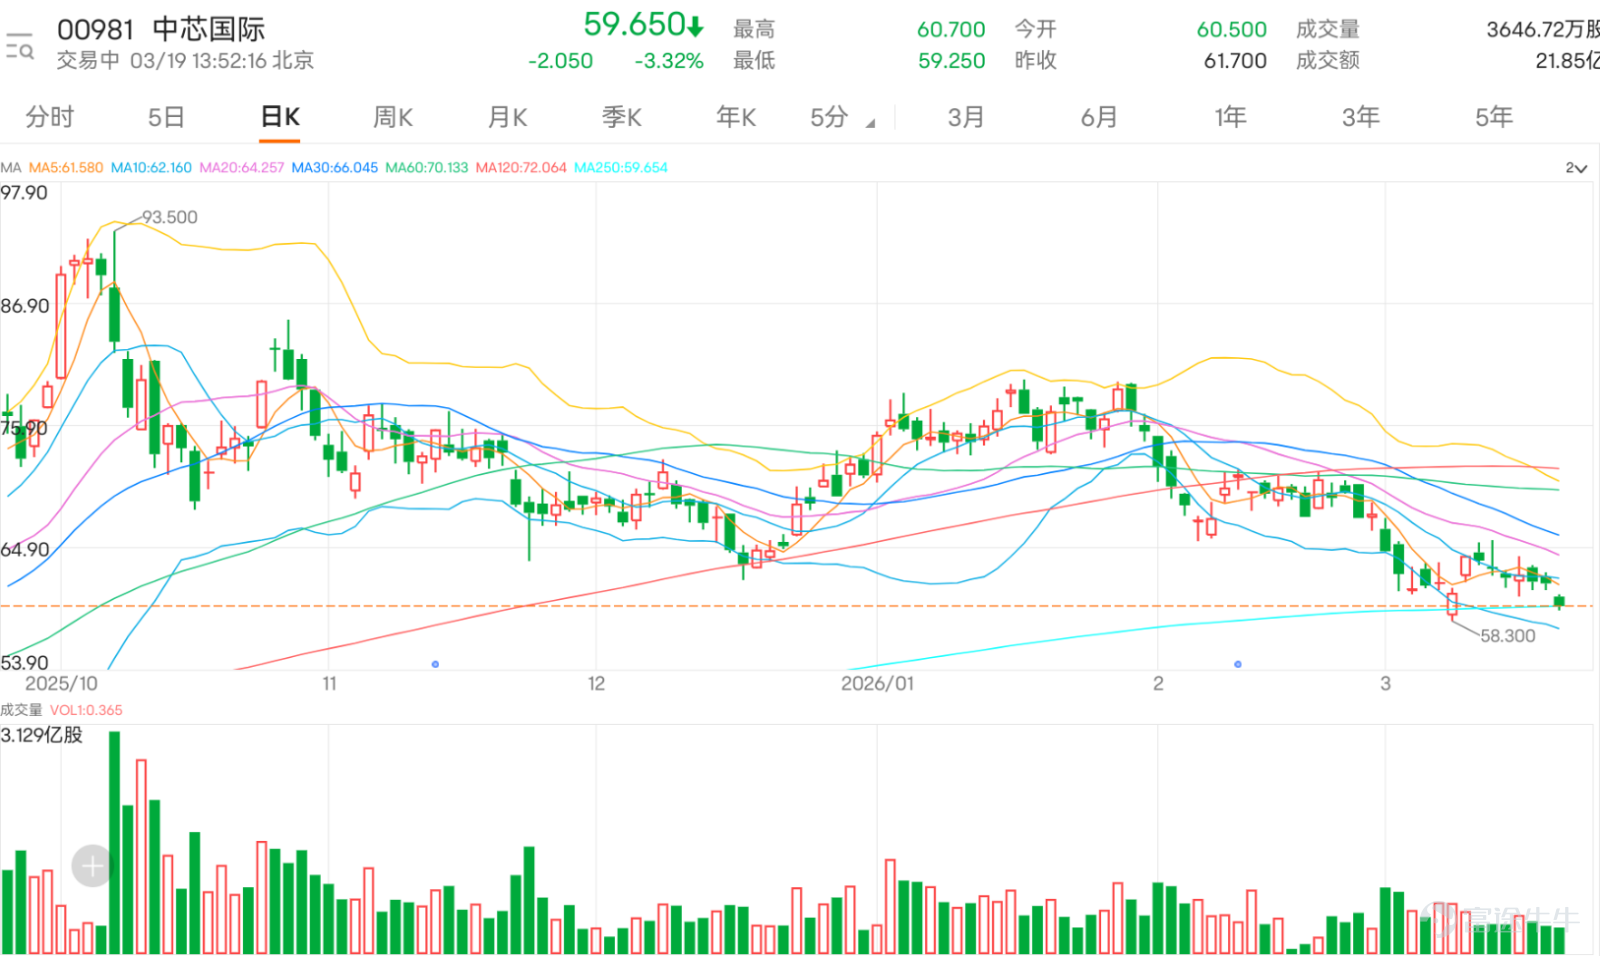
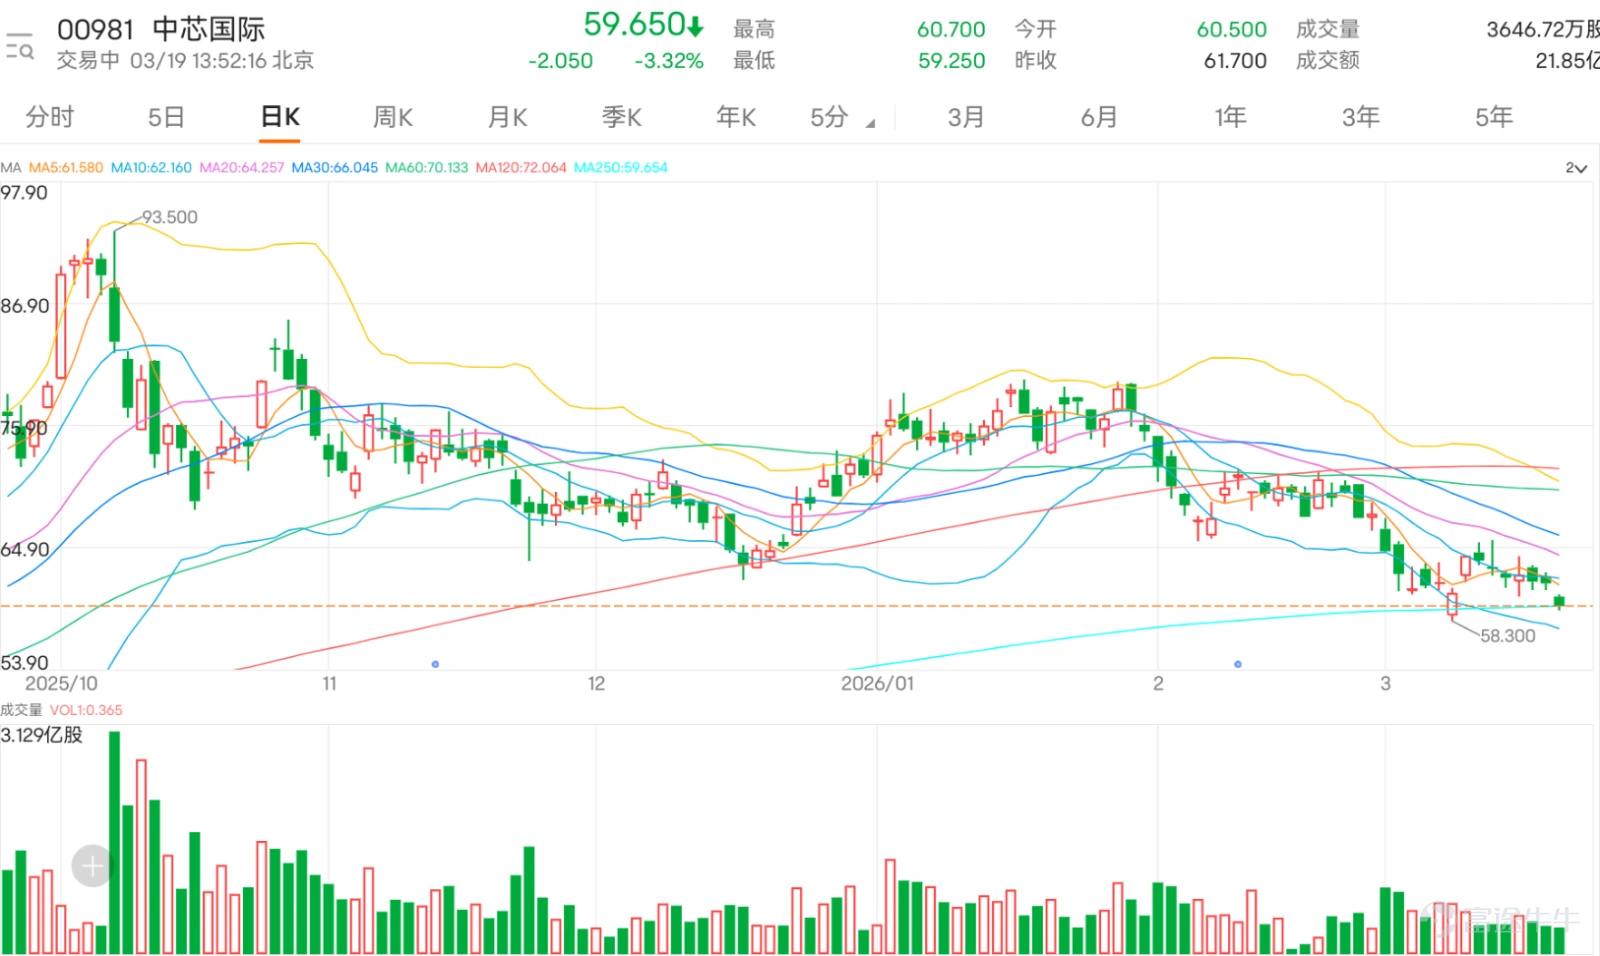
SMIC has fallen for three consecutive sessions, with the current share price clearly breaking below the 10-day moving average (MA10: 62.19 yuan), the 30-day moving average (MA30: 66.06 yuan), and the 60-day moving average (MA60: 70.14 yuan). Short-, medium-, and long-term moving averages have formed a typical bearish divergence pattern, confirming a short-term downward trend. Subsequent rebounds will first face pressure from each of these moving averages.
In terms of key price levels, the current share price is testing the primary support level of 57.8 yuan. If this level is decisively broken, the next support will be tested at the prior low range of 54.2 yuan. The resistance above is also clear: the first resistance level is near 63.8 yuan, which overlaps with the declining 10-day moving average, making it difficult to break through in the short term; the second resistance level is around 68 yuan, corresponding to the 30-day moving average zone. Overall, the range between 57.8 yuan and 63.8 yuan forms the core short-term consolidation range.
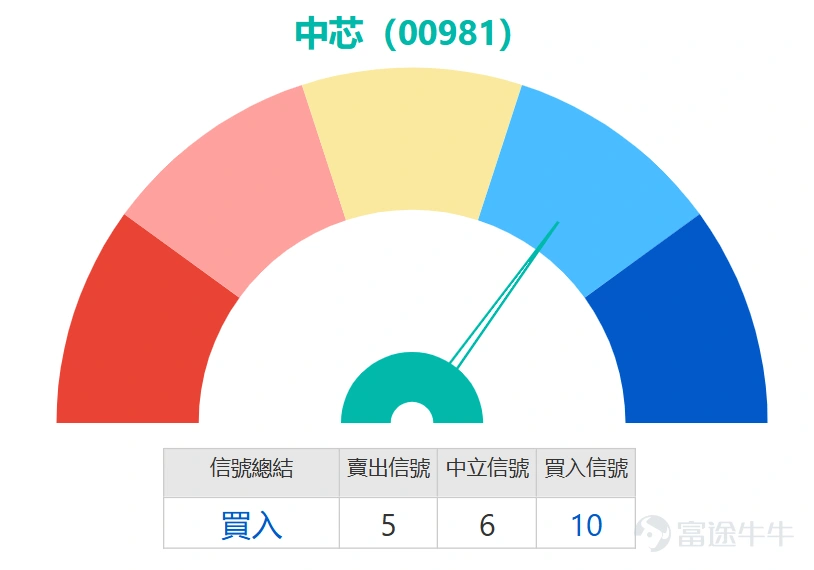
Technical indicators show obvious structural divergence characteristics: On one hand, trend indicators still show a downward pattern, with ADX, momentum oscillators, and Ichimoku Cloud all issuing sell signals, confirming that the current trend is dominated by bears. On the other hand, oscillation indicators have begun to release reverse signals, with the Relative Strength Index (RSI) dropping to 36 in the oversold zone, shifting to 'neutral,' suggesting that unilateral downward momentum may slow. More notably, the CCI indicator shows 'bottom divergence, buy' signals, and the Rate of Change (ROC) indicator also suggests 'oversold, possible bottoming out, buy.' Multiple signals together hint that although the trend remains downward, short-term downward momentum has been excessively released, and conditions for a technical rebound are gradually brewing.
Overall, SMIC's current technical pattern exhibits the typical characteristic of 'weak trend but oversold momentum,' not a clear trend-buying opportunity, but it has entered a window for technical rebound speculation. In terms of operations, blindly chasing shorts at the current position is not advisable, as the stock price is nearing a key support level and oscillation indicators generally indicate oversold conditions. Aggressive investors can focus on observing the effectiveness of the 57.8-yuan support level. If there are obvious stabilization signals near this level accompanied by volume cooperation, small positions can speculate on a rebound towards the 63.8-yuan resistance level, but strictly set 54.2 yuan as the stop-loss line. Conservative investors are advised to wait for clearer reversal signals, such as the stock price breaking through and stabilizing above the 63.8-yuan resistance level, before determining whether the short-term downtrend has reversed. Overall, the difficulty of trading in the current wave is relatively high, making it more suitable for investors with higher sensitivity to market movements to engage in range trading, while remaining alert to the risk of continued downward trend inertia.
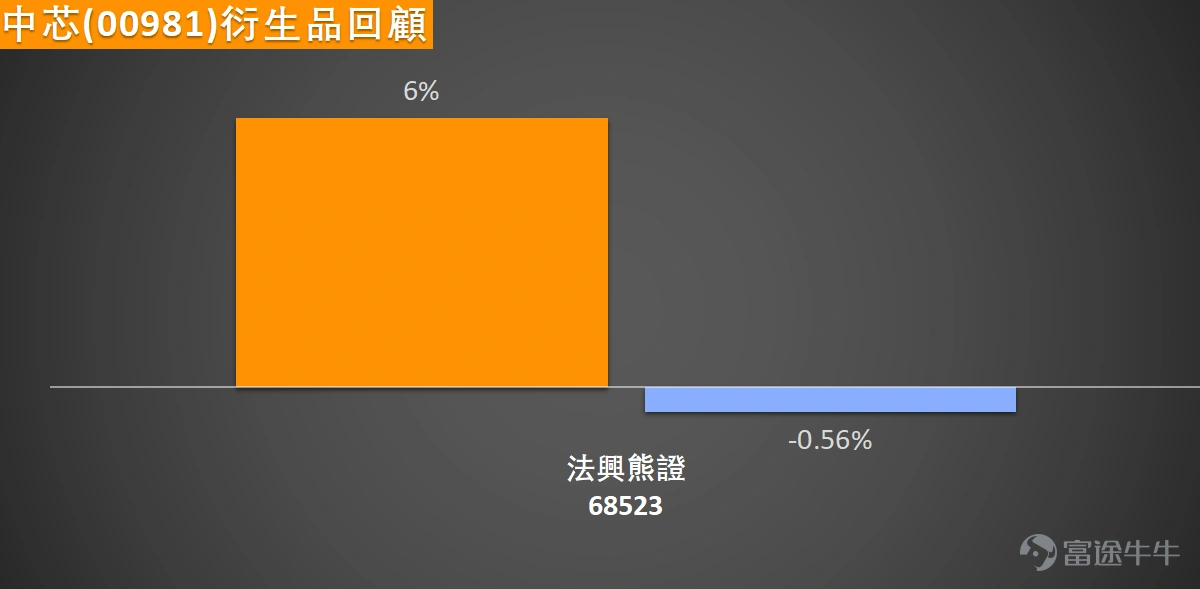
Looking back on March 13, two days later SMIC (00981) fell by 0.56%, while related derivative products $SG#SMIC RP2812G.P (68523.HK)$ A 6% increase was recorded two days later.
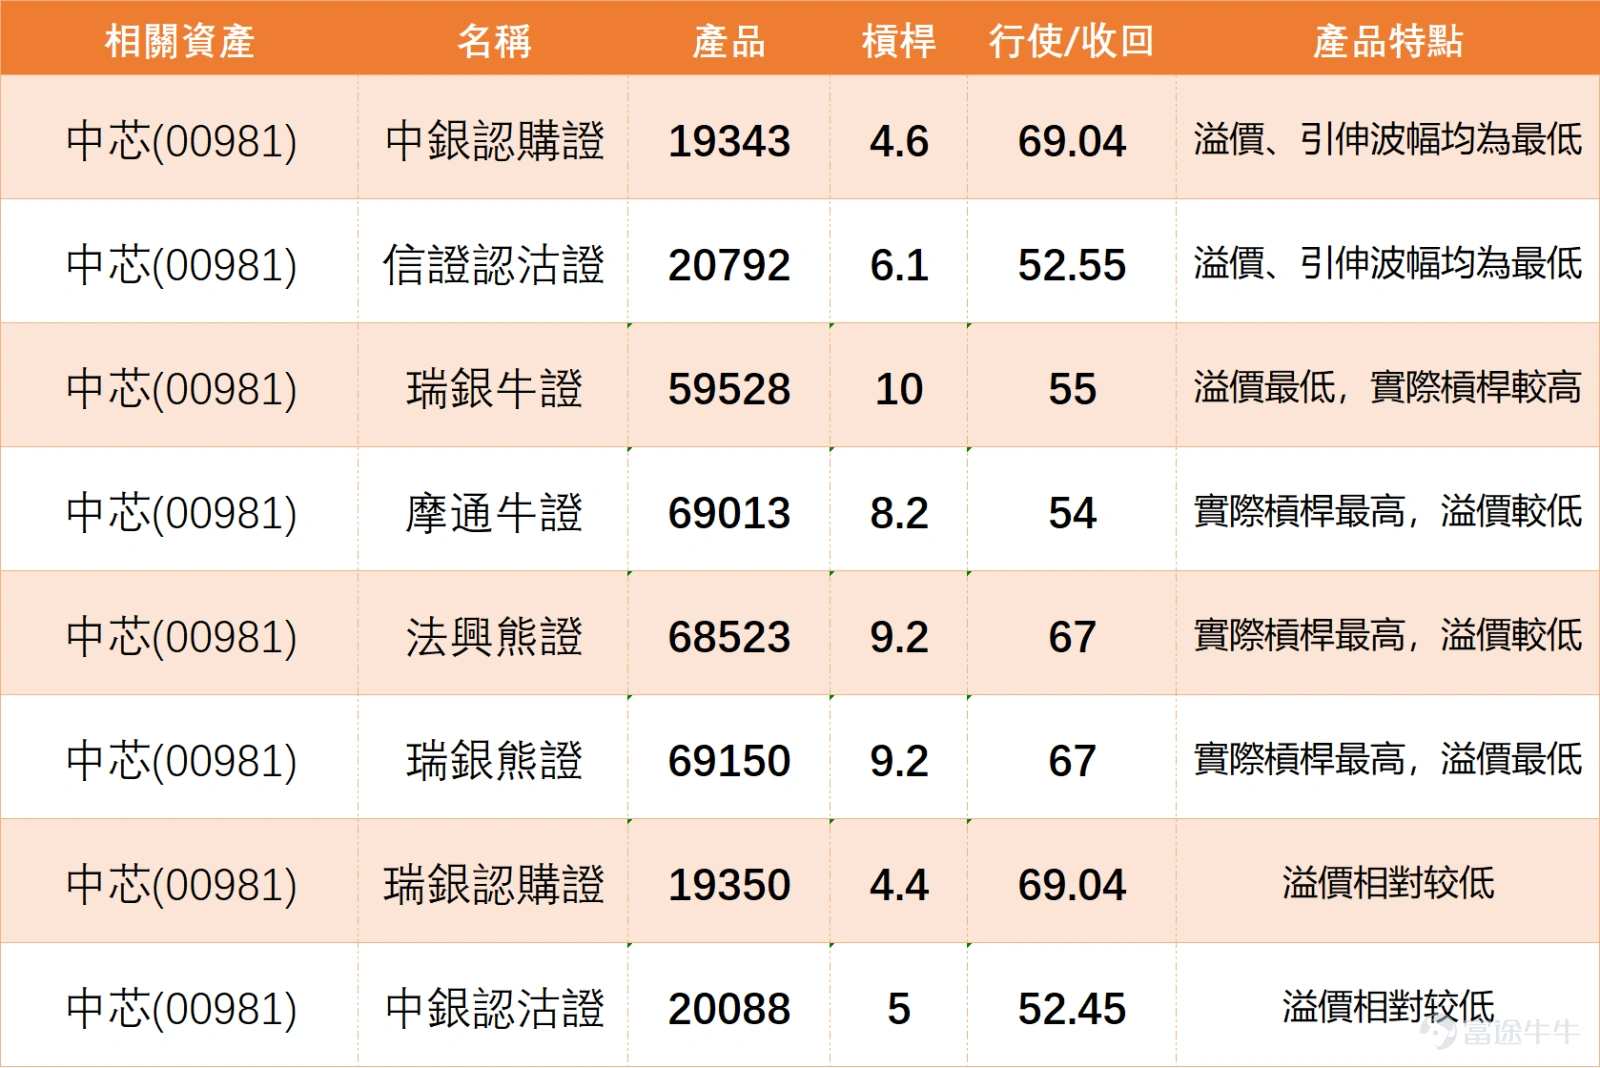
If you are optimistic about SMIC's future performance, in terms of call warrants, $BI-SMIC@EC2609B.C (19343.HK)$ The strike price is HK$69.04, offering leverage of approximately 4.6 times. Its premium and implied volatility are the lowest among similar products, making it suitable for investors who are bullish on the market outlook and want to deploy at a lower cost. Another option, $UB-SMIC@EC2609A.C (19350.HK)$ Also has a strike price of HK$69.04 with leverage of around 4.4 times, relatively low premium, balancing cost and leverage benefits.
For put warrants, $CI-SMIC@EP2607A.P (20792.HK)$ The strike price is HK$52.55, offering leverage of approximately 6.1 times. The premium and implied volatility are also the lowest in the market, suitable for investors who are bearish on SMIC's short-term movement and seek low-cost options. $BI-SMIC@EP2607A.P (20088.HK)$ The strike price is HK$52.45, with leverage of about 5 times and relatively low premium, providing another defensive choice.
For bull certificates, $UB#SMIC RC2607M.C (59528.HK)$ The recovery price is HK$55, offering leverage of around 10 times with the lowest premium in its category, high actual leverage, ideal for aggressive investors who are optimistic. $JP#SMIC RC2609A.C (69013.HK)$ The recovery price is HK$54, offering leverage of about 8.2 times with the highest actual leverage in the market and relatively low premium, suitable for those who can tolerate higher recovery risks while seeking high leverage.
Among bear certificates, $SG#SMIC RP2812G.P (68523.HK)$ and $UB#SMIC RP2812E.P (69150.HK)$The recovery price is also 67 yuan, with leverage at approximately 9.2 times; both have the highest actual leverage in their category. Among them, the premium of Societe Generale's bear certificate is relatively lower, while UBS Group’s bear certificate has the lowest premium. Investors can choose one based on their preference for the issuer's liquidity. Both are suitable for investors who are bearish on the future market and wish to capture downward movements with high leverage.
The semiconductor sector has weakened overall recently. Do you think SMIC is more suitable for short-term speculation on a rebound, or for medium-to-long-term positioning?Feel free to share your insights in the comment section. For more market analysis, stay tuned to 'HK Stock Warrants Jenny' for daily updates! $Hang Seng Index (800000.HK)$$Hang Seng TECH Index (800700.HK)$
Reminder: This article does not constitute any investment advice.
This article is for reference only and does not constitute any investment advice. The market data, opinions, and analysis contained herein may change at any time without prior notice. We are not responsible for any loss or damage caused by reliance on the information in this article. Technical analysis only shows whether certain technical conditions are met; a comprehensive assessment of asset performance should be conducted using additional data. Decisions to trade should not be based solely on this article. Please note that past performance is not indicative of future results.
#HongKongStocks #HangSengIndex #RealTimeAnalysis #WarrantsSelection #WarrantsStrategy #DerivativesHedging #HongKongWarrantsJenny #SMIC0981 #Semiconductors #HangSengIndexTrends
Risk Disclaimer: The above content only represents the author's view. It does not represent any position or investment advice of Futu. Futu makes no representation or warranty.Read more

Comments
to post a comment
2
1