

Earnings reports from Chinese giants raise concerns! Is it a good time to buy on dips?

Pre-earnings Analysis of Alibaba's Stock Movement: 128.8 Yuan Becomes a Key Support Line - Can the Rally Continue?
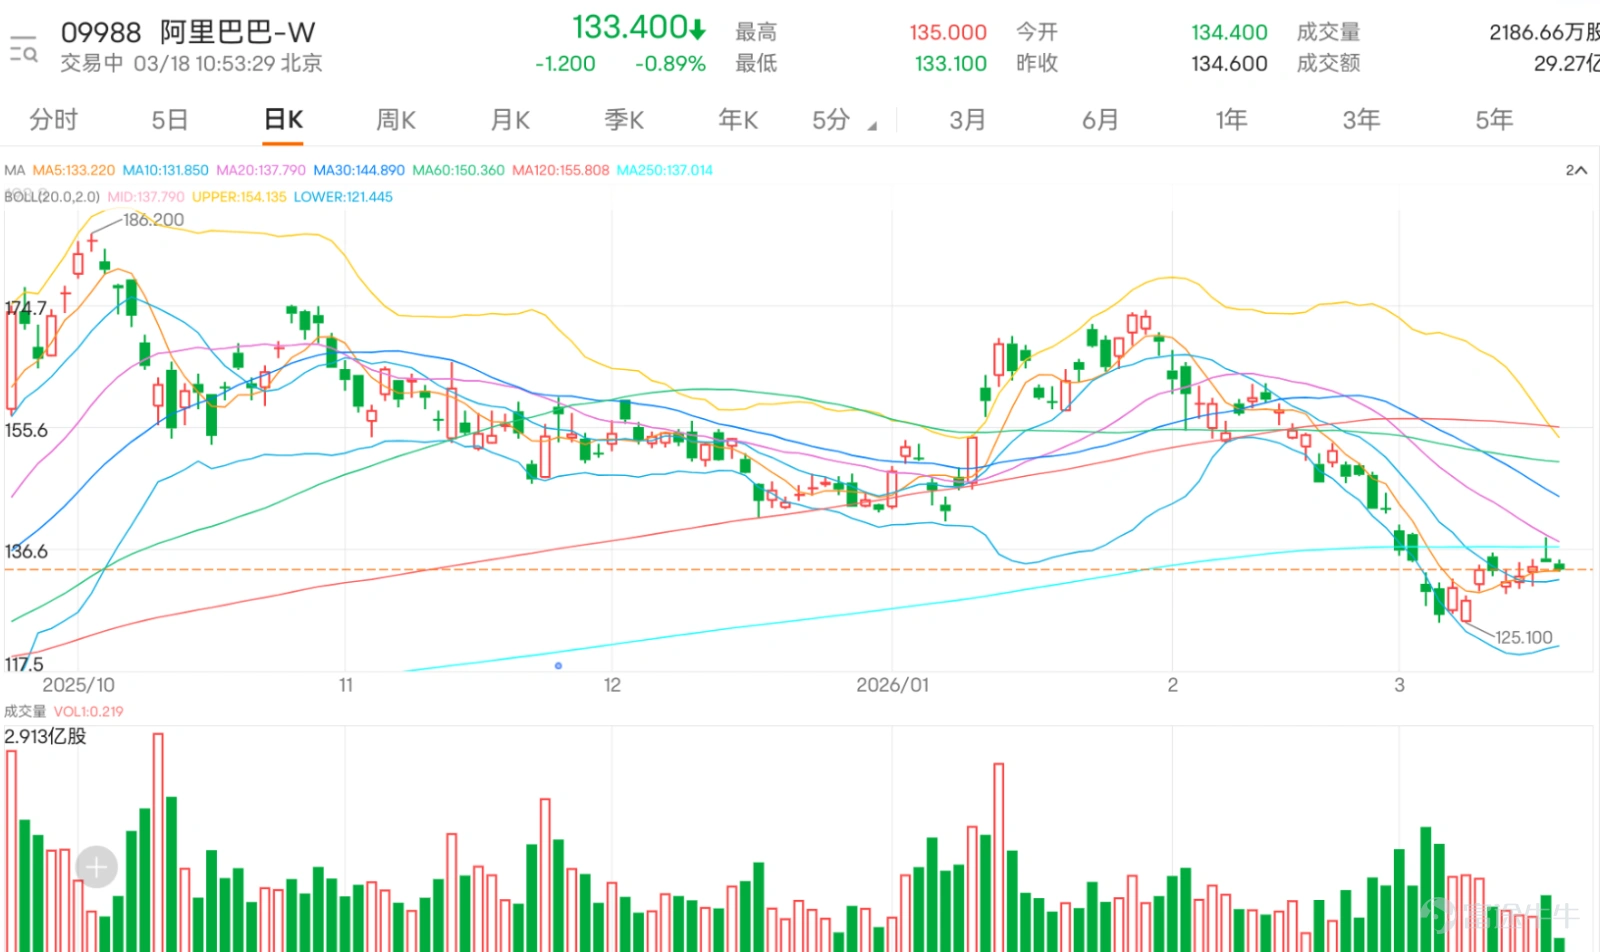
$BABA-W (09988.HK)$ Trading has been lackluster, with a current drop of nearly 1%, last trading at HKD 133.4. Alibaba will announce its earnings after the market closes on March 19 (this Thursday). According to broker forecasts, revenue for the period is expected to reach RMB 289.8 billion, up 3% year-on-year, while adjusted net profit is projected at RMB 29.58 billion, down 42% year-on-year. The profit pressure mainly stems from ongoing investments in AI business. The market focus this earnings season will be on the growth performance of Alibaba Cloud and AI business, as well as cost control for AI investments and long-term profitability realization. Related business guidance will be a key catalyst for future stock price movements.
Alibaba has now successfully stabilized above the 10-day moving average (HKD 131.89), which is a clear short-term positive signal indicating that the previous rapid decline has temporarily slowed, and the stock is attempting to form a short-term bottom. However, medium-term trends still face significant pressure, as the 30-day moving average (HKD 144.90) and the 60-day moving average (HKD 150.36) form double resistance levels. For a true trend reversal, the stock needs to break through and stabilize above the 30-day moving average; otherwise, it remains within a range-bound recovery pattern.
In terms of key price levels, the first support below is at HKD 128.8, which can be seen as an important line of defense for short-term bulls. A break below this level would indicate further expansion of the current adjustment, with the next support at the psychological level of HKD 120. Resistance above corresponds to HKD 144.7 (which overlaps with the 30-day moving average position). To confirm a sustainable rebound, a noticeable increase in trading volume must accompany a breakout above this level, with subsequent resistance around HKD 155.9.
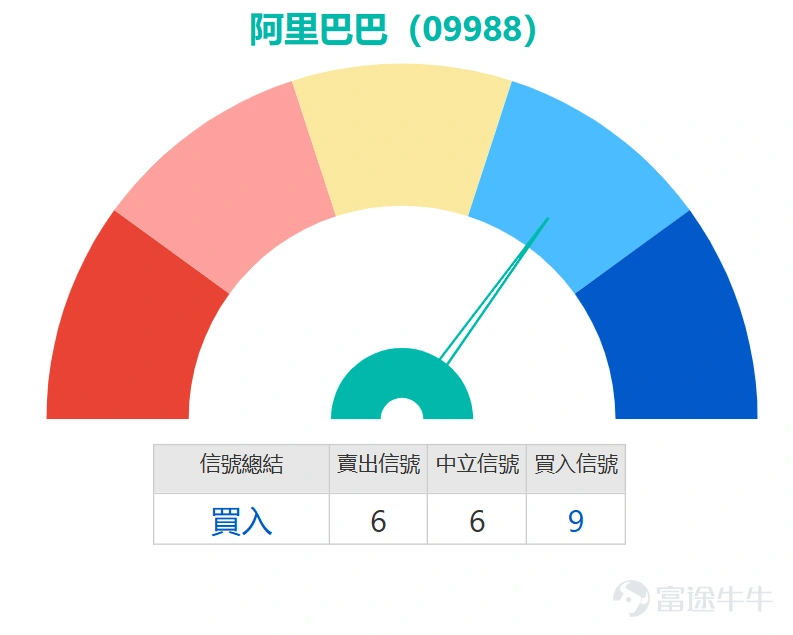
From a technical indicator perspective, there is some divergence but a slightly positive short-term outlook. The most notable aspect is that the overall technical summary gives a 'Buy' rating with a strength of 9, which is a fairly clear short-term trading signal. However, several oscillators remain relatively neutral: RSI stands at 43, Williams %R and stochastic oscillators are within reasonable ranges, reflecting that price momentum has not yet entered a strong upward zone but has exited the extremely oversold condition from before. CCI also remains neutral, indicating insufficient momentum for a sustained trend. Meanwhile, Bollinger Bands analysis suggests the stock is in a 'severely oversold, possibly bottoming' state, reinforcing the effectiveness of the lower support area, consistent with price action showing clear support above HKD 128.8. Additionally, MACD and Ichimoku Cloud have successively issued buy signals, providing technical backing for a potential rebound.
Of course, potential risk signals should not be overlooked: the ADX indicator value is weak, suggesting insufficient strength in the current rebound trend. Psychological line, rate-of-change indicators, VR trading ratio, and bull/bear power indicators all give 'Sell' or bearish signals, reflecting overall cautious market sentiment and lack of full trading volume support for the rebound rhythm. This divergence between technicals and sentiment implies that early gains may face selling pressure at any time, making the short-term trend likely more volatile. Going forward, close attention should be paid to trading volume dynamics and the effectiveness of the HKD 128.8 support level.
Regarding changes in derivatives open interest from March 13 to 17, there was noticeable capital positioning differentiation. Open interest in call warrants initially rose then fell, increasing from 9,835.08 million contracts to 10,079.01 million contracts on March 16, then retreating to 8,979.97 million contracts, representing an overall decline of about 8.7% compared to March 13. Simultaneously, open interest in put warrants steadily declined from 801.97 million contracts to 782.46 million contracts, a cumulative drop of approximately 2.4%. For bull/bear contracts, bullish contract open interest increased from 1,177.34 million contracts to 1,212.34 million contracts, a cumulative rise of about 3%, while bearish contract open interest continuously dropped from 253.99 million contracts to 212.52 million contracts, a cumulative decline exceeding 16%.
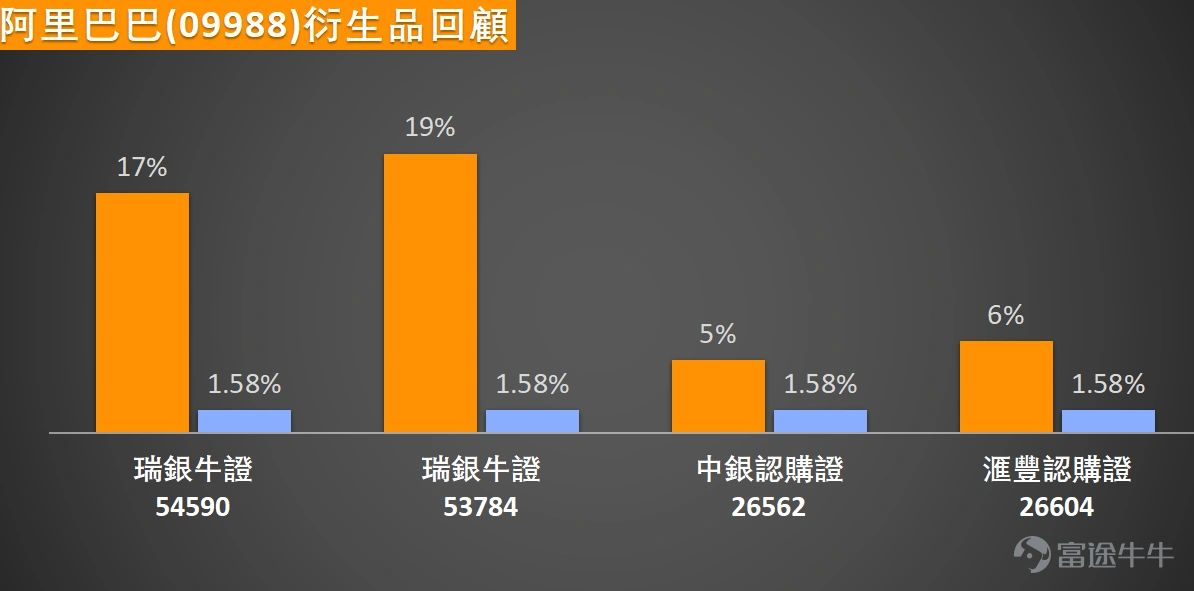
Within two trading days after March 13, Alibaba's underlying stock cumulatively rose by 1.58%, corresponding to derivative products recording across-the-board gains alongside the stock’s rise. Among them… $UB#ALIBARC2608F.C (54590.HK)$ An increase of 17%, $UB#ALIBARC26074.C (53784.HK)$ An increase of 19%, $BIALIBA@EC2608E.C (26562.HK)$ An increase of 5%, $HSALIBA@EC2608F.C (26604.HK)$ An increase of 6%.
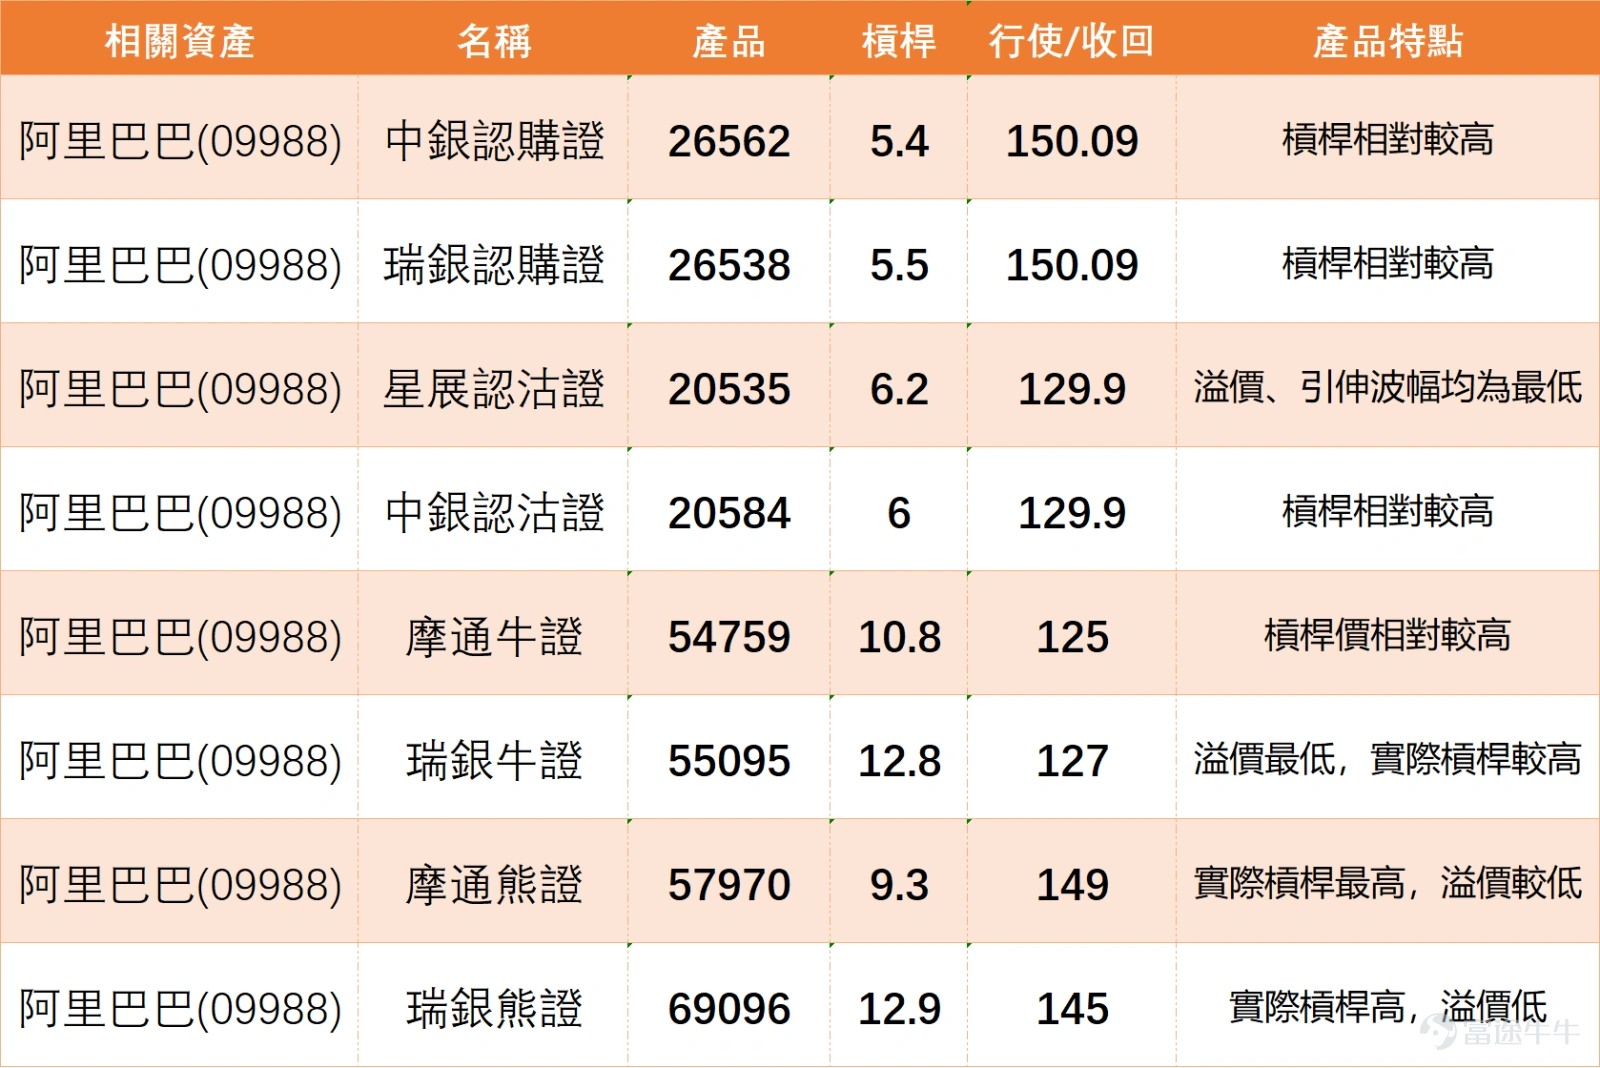
If you are optimistic about Alibaba's performance, in terms of call warrants, you can pay attention to $BIALIBA@EC2608E.C (26562.HK)$ , with an exercise price of 150.09 yuan, offering approximately 5.4x leverage. Its advantage lies in relatively higher leverage, making it suitable for investors who are bullish on the market and seek higher capital efficiency. Another option is $UBALIBA@EC2608F.C (26538.HK)$ , also with an exercise price of 150.09 yuan and leverage of about 5.5x. It similarly features higher leverage, providing an effective tool to capture potential upside in the underlying stock.
As for put warrants, $DSALIBA@EP2606A.P (20535.HK)$ is worth considering, with an exercise price of 129.9 yuan and leverage of about 6.2x. Its greatest advantage lies in having the lowest premium and implied volatility among similar products, offering better downside protection. Another option is $BIALIBA@EP2606A.P (20584.HK)$ , also with an exercise price of 129.9 yuan and leverage of about 6x. Its feature is relatively higher leverage, making it suitable for investors who are bearish on the market and wish to deploy at a lower cost.
For bull certificate choices,$JP#ALIBARC2609A.C (54759.HK)$The recovery price is 125 yuan, offering approximately 10.8 times leverage, with the characteristic of relatively high leveraged pricing.$UB#ALIBARC2608J.C (55095.HK)$The recovery price is 127 yuan, with leverage around 12.8 times; its advantage lies in having the lowest premium among similar products and higher actual leverage, making it highly efficient.
Regarding bearish certificates, $JP#ALIBARP2809J.P (57970.HK)$The recovery price is 149 yuan, with actual leverage around 9.3 times, making it the highest actual leverage in its category and with a lower premium.$UB#ALIBARP2810G.P (69096.HK)$The recovery price is 145 yuan, with actual leverage around 12.9 times, combining both high actual leverage and low premium advantages, suitable for those who are bearish and wish to hedge risks with high leverage.
$TENCENT (00700.HK)$ 、 $AIA (01299.HK)$Heavyweights like Alibaba (09988) will release their earnings soon. Which stock’s performance do you expect the most? Alibaba's AI investments, AIA's new business value, Tencent’s gaming growth— which earnings metric do you think is most likely to exceed expectations? Feel free to share your insights in the comments section. For more market analysis, stay tuned to 'HK Stock Warrants Jenny' for daily updates!
Reminder: This article does not constitute any investment advice.
This article is for reference only and does not constitute any investment advice. The market data, opinions, and analysis contained herein may change at any time without prior notice. We are not responsible for any loss or damage caused by reliance on the information in this article. Technical analysis only shows whether certain technical conditions are met; a comprehensive assessment of asset performance should be conducted using additional data. Decisions to trade should not be based solely on this article. Please note that past performance is not indicative of future results.
#HongKongStocks #HangSengIndex #RealTimeAnalysis #WarrantsSelection #WarrantsStrategy #DerivativesHedging #HongKongWarrantsJenny #Alibaba #BlueChipStocks #09988 #HangSengIndexTrend$Hang Seng Index (800000.HK)$$Hang Seng TECH Index (800700.HK)$$Hang Seng China Enterprises Index (800100.HK)$
Risk Disclaimer: The above content only represents the author's view. It does not represent any position or investment advice of Futu. Futu makes no representation or warranty.Read more

Comments
to post a comment
1