
Hong Kong stocks pull back—how will they perform in the second half of the year?

The Hang Seng Index has stabilized above the 10-day moving average, with the 26,000 level becoming a key short-term resistance.
On the previous day (March 17th) $Hang Seng Index (800000.HK)$
The index closed at 25,868.54 points, up slightly by 0.13% for the day, with a trading volume of 268.259 billion Hong Kong dollars.
In our [Hong Kong Stock Broadcast], we also commented on the Hang Seng Index: Observing recent trading sessions, after rebounding from the 24,900 level, the index has gradually stabilized in the short term and moved back above the 5-day moving average at 25,756 and the 10-day moving average at 25,648, reflecting that short-term selling pressure has eased somewhat. However, the index has not yet broken through the 20-day moving average at 26,072, as well as a cluster of medium-term moving averages near 26,300, indicating that the overall trend is still part of a rebound process rather than a confirmed trend reversal.
From a technical perspective, the range between 26,000 and 26,300 clearly forms a short-term resistance zone, with 26,072 being the Bollinger Bands midline while overlapping with the 20-day line, making it technically significant; further up, the 26,300 to 26,380 range represents an area where multiple medium-term moving averages converge, adding even stronger resistance. If the index fails to effectively break through and stabilize above this region, the momentum of the rebound may gradually weaken.
On the support side, the short-term focus can first be placed on the 25,600 to 25,650 region, which is close to the 10-day line and the bottom of the recent consolidation range, acting as the first line of defense; if this level is breached, attention should be paid to the 25,000 to 25,028 zone, which is near the lower Bollinger Band and also close to the previous low of 24,906, making it an important medium- to short-term support level.
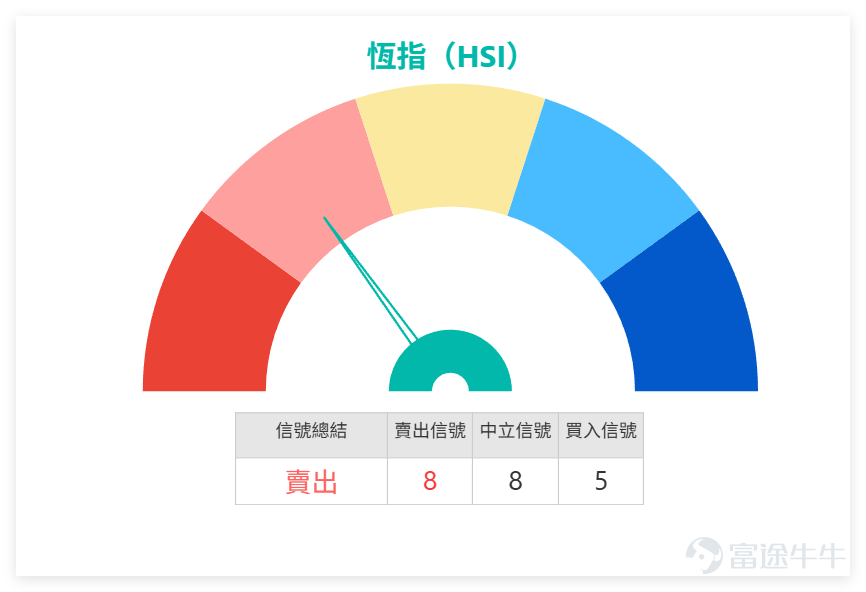
Detailed analysis of the Hang Seng Index's core technical indicators: The RSI index stands at 49, within the neutral range, without showing overbought or oversold signals, reflecting that market forces are relatively balanced; the MACD signal indicates 'Sell' with an intensity of 8, forming a slight divergence with the index’s minor uptick. Combined with the slight increase in MACD histogram volume, this shows that short-term rebound momentum remains relatively weak. Additionally, multiple oscillation indicators for the Hang Seng Index show neutrality, with the Williams %R, Stochastic Oscillator, and CCI all giving neutral signals, further confirming the short-term consolidation pattern.
![On the previous day (March 17th) $Hang Seng Index (800000.HK)$ The index closed at 25,868.54 points, up slightly by 0.13% for the day, with a trading volume of 268.259 billion Hong Kong dollars. In our [Hong Kong Stock Broadcast], we also commented on the Hang Seng Index: Observing recent trading sessions, after rebounding from the 24,900 level, the index has gradually stabilized in the short term and moved back above the 5-day moving average at 25,756 and the 10-day moving average at 25,648, reflecting that short-term selling pressure has eased somewhat. However, the index has not yet broken through the 20-day moving average at 26,072, as well as a cluster of medium-term moving averages near 26,300, indicating that the overall trend is still part of a rebound process rather than a confirmed trend reversal. From a technical perspective, the range between 26,000 and 26,300 clearly forms a short-term resistance zone, with 26,072 being the Bollinger Bands midline while overlapping with the 20-day line, making it technically significant; further up, the 26,300 to 26,380 range represents an area where multiple medium-term moving averages converge, adding even stronger resistance. If the index fails to effectively break through and stabilize above this region, the momentum of the rebound may gradually weaken. On the support side, the short-term focus can first be placed on the 25,600 to 25,650 region, which is close to the 10-day line and the bottom of the recent consolidation range, acting as the first line of defense; if this level is breached, attention should be paid to the 25,000 to 25,028 zone, which is near the lower Bollinger Band and also close to the previous low of 24,906, making it an important medium- to short-term support level. Detailed Explanation of Core Technical Indicators for Hang Seng Index: RSI is at 49, in the neutral range...](https://nnqimage.futunn.com/sns_client_feed/228620/20260318/web-1773798403683-EqaEbnxc5e.png/big?area=1&is_public=true&imageMogr2/ignore-error/1/format/webp)
The performance of key blue chips on the previous day (March 17) varied, with technical signals showing significant divergence and no unified trend forming — a prominent feature in the current market.
On the bullish side, Tencent (00700) closed at HKD 550.0, down 1.52%, but the closing price was above MA10 and MA30; with an RSI of 56 in a moderately strong range, the technical signal is 'Buy'; Hong Kong Exchanges and Clearing (00388) closed at HKD 404.4, slightly down by 0.44%, constrained by all major moving averages, but the technical signal shows 'Buy' with a strength of 10, indicating a contrarian trading signal; Ping An (02318) closed at HKD 63.1, up 1.37%, with a technical signal of 'Strong Buy', showing relatively strong short-term bullish signals.
On the bearish side, Xiaomi Group (01810) closed at HKD 35.36, slightly up by 0.45%, holding steady above short- and medium-term moving averages; with an RSI of 58 leaning towards strength, but the technical signal indicates 'Strong Sell'; China Construction Bank (00939) closed at HKD 8.11, up 0.75%, standing above all key moving averages, with an RSI of 59 on the stronger side, also receiving a 'Strong Sell' signal, issuing warnings for two consecutive days; China Mobile (00941) closed at HKD 80.0, slightly down by 0.12%, also showing a technical signal of 'Strong Sell', with visible short-term adjustment pressure.
Risk Warning: This increased divergence between bulls and bears will raise operational difficulty. Investors are advised to focus more on the technical patterns of their individual holdings and avoid blindly following market sentiment.
Review and Selection of Warrants and Bull/Bear Certificates: Seize volatility opportunities while being mindful of risks.
Reviewing recent warrant and bull/bear certificate performance, products related to the Hang Seng Index recommended on March 11 performed exceptionally well. UBS Bear Certificate 69176 rose by 32% within two days, while UBS Bear Certificate 66521 gained 30%. BOC Put Warrant 23127 and UBS Put Warrant 23089 saw increases of 19% and 18%, respectively, aligning with the market fluctuations of the Hang Seng Index at that time, providing investors with references for volatility-based trading.
Combining the trend of the Hang Seng Index with technical signals, we have selected two warrant products for your reference:
1. UBS Call Warrant 23090: Leverage 15.3, strike price 26733, with ideal leverage and implied volatility, suitable for investors optimistic about the Hang Seng Index breaking through resistance in the short term.
2. BNP Paribas Put Warrant 23944: Leverage 13.1, strike price 25000, with the lowest implied volatility and high leverage, suitable for investors who believe the Hang Seng Index may retreat to test support levels in the short term.
Friendly reminder: Warrants are derivatives with significant volatility. Investors should align with their risk tolerance, proceed cautiously, and control their positions.
How long do you think the contention around the 26,000 level for the Hang Seng Index will last?
A. Results within 1-2 days.
B. The market still needs to fluctuate for another 3-5 days.
C. It may remain range-bound for over a week.
Feel free to share your insights in the comments section.
Reminder: This article does not constitute any investment advice.
This article is for reference only and does not constitute any investment advice. The market data, opinions, and analysis contained herein may change at any time without prior notice. We are not responsible for any loss or damage caused by reliance on the information in this article. Technical analysis only shows whether certain technical conditions are met; a comprehensive assessment of asset performance should be conducted using additional data. Decisions to trade should not be based solely on this article. Please note that past performance is not indicative of future results.
#HongKongStocks #HangSengIndex #RealTimeAnalysis #WarrantsSelection #WarrantsStrategy #DerivativesHedging #TencentHoldings #BlueChipStocks #TechnicalAnalysis #HangSengIndexTrends
Risk Disclaimer: The above content only represents the author's view. It does not represent any position or investment advice of Futu. Futu makes no representation or warranty.Read more

Comments
to post a comment
4