
Harvest Macro | March 17, 2026 Global Financial Market Weekly Report
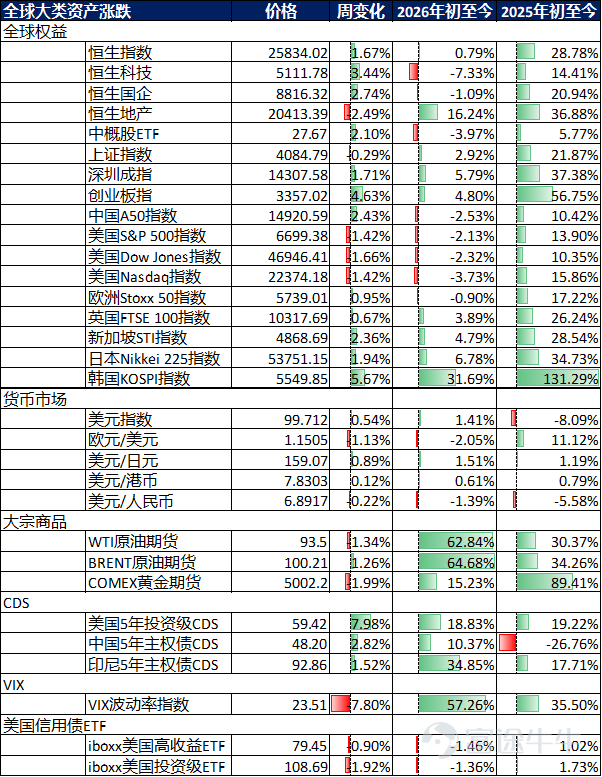
Market performance over the past week

Data Source: Bloomberg and HARVEST
Global capital flows
According to EPFR data, during the week of March 4 - March 11, global equities saw net inflows for the sixth consecutive week, while the bond market witnessed net inflows for the 46th consecutive week (with last week's net inflow at $3.44 billion). Specifically, A-shares turned to net outflows last week (with last week's net outflow at $3.61 billion); Hong Kong stocks also turned to net outflows (with last week's net outflow at $0.14 billion); emerging markets recorded net inflows for the sixth consecutive week (with last week's net inflow at $1.9 billion); US stocks turned to net inflows last week (with last week's net inflow at $0.68 billion); developed European equities continued net inflows for the 31st consecutive week (with last week's net inflow at $2.81 billion); Japan's stock market continued net inflows for the 13th consecutive week (with last week's net inflow at $7.18 billion).

Data source: EPFR and Harvest
Stock market
Review and Outlook of the Past Week
United States:
During the week, the US stock market exhibited a triple pattern of 'rising stagflation risks, tariff policy disruptions, and heightened AI bubble concerns,' characterized by an underlying turbulence beneath a deceptive calm. The intensity of the tug-of-war between bulls and bears intensified but became more concealed, with extreme sector divergence and a widening split between large-cap and small-cap stocks. Overall, it showed a trend of 'volatile downward movement with localized structural differentiation.' By the end of the period, the Nasdaq Composite Index closed at 22,105.36 points, down 1.26% for the week. Affected by concerns over AI capital expenditure bubbles and valuation adjustments of tech giants, the index displayed a 'volatile plunge with weak consolidation' feature, with volatility further expanding compared to the previous week. The Dow Jones Industrial Average closed at 46,558.47 points, falling 1.99% for the week, making it the worst-performing among the three major indices. Industrial and export-oriented sectors faced significant pressure, compounded by soaring oil prices that increased cost burdens, causing widespread weakness in constituent stocks. The index repeatedly broke through short-term support levels, showing a 'testing bottom with weak rebounds' pattern throughout the week. The S&P 500 Index closed at 6,632.19 points, declining 1.60% for the week. A few tech giants barely supported the index while most medium and small-cap component stocks performed poorly. Defensive sectors like consumer and healthcare showed signs of stabilization but were unable to offset selling pressures from tech and cyclical sectors, resulting in an overall 'structural imbalance with insufficient resilience' situation.
Looking at each index individually, there were significant differences in volatility logic: The Nasdaq was dominated by tech stocks. This week, the valuation game within the AI sector escalated further. A Goldman Sachs report warned that the US stock market had entered a 'false calm' phase, highlighting the commercialization pressure behind the AI investment frenzy. Coupled with corrections in tech giants like NVIDIA, this led to the Nasdaq's downward volatility. Although some AI application stocks briefly rebounded, they couldn't reverse the overall weakening trend. Additionally, the high leverage risk of zero-day options trading in the options market amplified the Nasdaq's volatility. The Dow Jones was hit by both the industrial sector and tariff policies. The US 15% global import tariff officially took effect this week, sharply increasing cost pressures on export-oriented constituents. Rising oil prices further elevated energy consumption costs for industrial enterprises. Defensive sectors provided only weak support, which was insufficient to counteract selling pressures, resulting in multiple sharp intraday plunges followed by minor recoveries throughout the week. The S&P 500 was impacted by extreme concentration in market structure, with the top ten tech giants accounting for nearly 35% of the market value. The stability of a few heavyweight stocks buffered the downward pressure on most medium and small-cap components, yet the overall downward trend remained unchanged. Capital flowed into defensive sectors, intensifying sector divergence.
Japan:
This trading week, the Japanese stock market exhibited a three-phase characteristic of 'fading memory chip benefits—tech sector correction—high-level pressure-induced fluctuations.' The core driving factors revolved around weakening global memory chip price momentum, reversal of foreign capital flows, and unilateral yen depreciation. Compounded by profit-taking from previous highs and expanding sector divergence, it formed a pattern of imbalanced long-short博弈 and downward fluctuations, ultimately ending the week with a significant decline, halting the previous strong momentum. The core contradictions focused on three dimensions: First, the structural contradiction between the decline in memory chips and AI technology sectors versus traditional industry sluggishness; second, the contradiction between unilateral yen depreciation and export enterprise profitability stability; third, the dual constraint contradiction between policy dividend support and high debt, high interest rates. The Nikkei 225 Index performed weakly, dropping significantly for the week, closing at 53,819.61 points (-1,801.23 points; year-to-date -0.05%), ending the prior continuous upward trend due to tech sector corrections and foreign capital outflows. Sector performance showed 'universal pressure and exacerbated divergence': the tech sector led the market decline, with semiconductor and AI-related stocks posting significant losses. Kioxia’s shares fell over 7% during the week, dragging down the index. Traditional industries continued their sluggish trend, with manufacturing and utilities sectors synchronously declining. Only consumer and pharmaceutical defensive sectors showed relatively controlled declines, failing to provide effective support.
Eurozone:
This trading week, the European stock market featured 'Pan-European index volatile stabilization, differentiated weakening of core national indices, and mild long-short博弈.' Progress in the EU-Mercosur free trade agreement, ECB policy stability expectations, and slight improvements in economic data from some countries provided phased support. Meanwhile, escalating US-EU trade frictions, hindered German manufacturing recovery, and prolonged Middle East conflicts pushing up energy prices constituted major pressures. Coupled with sector rotation and divergence (environmental protection and high-end manufacturing sectors strengthened, while energy and traditional industrial sectors were pressured), it formed a 'slightly rising Pan-European volatility and pronounced national differentiation' pattern. Market caution eased somewhat, but concerns about economic recovery persisted, showing a 'structural layout' feature. At the Pan-European level, the Stoxx 600 Index stabilized with slight gains for the week, closing at 595.85 points, up 0.93 points from last week, narrowing the year-to-date decline to -2.05%, ending the previous two weeks of consecutive downward volatility with mild upward momentum restored. Core national indices showed 'pronounced differentiation, varying strengths and weaknesses,' with some indices achieving rebounds: the UK FTSE 100 Index performed relatively robustly, slightly rising for the week, closing at 10,261.75 points, up 11.63 points from last week, expanding year-to-date gains to +1.16%. Supported by a temporary rebound in the energy sector and a slight decline in inflation data, it showed a 'volatility upward trend with strong resilience.' The French CAC 40 Index slightly declined, closing at 7,911.53 points, down 3.83 points from last week, narrowing year-to-date decline to -2.84%. Impacted by weak domestic consumption data and pressured export sectors, it showed a 'consolidation with weak rebounds' trend. The German DAX Index rebounded, closing at 23,447.29 points, up 37.92 points from last week, narrowing year-to-date decline to -5.84%. Despite ongoing pressures on manufacturing recovery, slight warming in the auto sector and marginal improvement in market risk appetite drove a small rebound in the index. The Italian MIB Index rose simultaneously, closing at 44,316.92 points, up 291.96 points from last week, narrowing year-to-date decline to -1.15%. Supported by EU policy backing and rising domestic infrastructure investment expectations, market selling pressure eased, leading to index recovery.
Past Week Review
The SOFR curve within one year showed mixed movements last week; the US Treasury yield for the 2-year note fell by 12.8 basis points, and the 10-year note fell by 6.9 basis points. In terms of Chinese interest rates, the 3-year government bond yield dropped by 1.7 basis points, while the 10-year government bond yield rose by 0.5 basis points. The inverted spread between the 10-year US and Chinese bonds stood at 263 basis points.

Data Source: Bloomberg and HARVEST
Government Bonds:Aggressive rhetoric against Iran escalated, once pushing oil prices back above $100. This week, global bond yields surged significantly, reflecting the market's rapid elimination of hopes for short-term rate cuts, driven by what is historically the largest oil supply disruption. The International Energy Agency (IEA) warned that global supplies would decrease by 8 million barrels per day in March, and US Navy escorts might be the only hope for reopening the Strait of Hormuz before the end of the month. In the G10 cash market, the US Dollar Index (DXY) has risen 2.04% so far this month, quickly breaking through the 100-point barrier. The US interest rate curve noticeably flattened in a bearish manner (2-year: +9bp; 30-year: 0bp) as higher oil prices and inflation expectations prompted investors to completely rule out the possibility of a second Fed rate cut in 2026. The unexpected sharp narrowing of the US trade deficit may alter Q1 growth expectations, while the University of Michigan’s January consumer inflation expectations remained stable, not yet affected by the Middle East situation. The market expects no change in policy rates at next week’s FOMC meeting. We maintain our forecast for rate cuts in June and September but recognize the risk of later cuts.
Credit bonds:Investment-grade Chinese USD bonds saw spreads remain flat to slightly narrow by 1-2bps this week. Despite geopolitical tensions triggering risk aversion in the credit bond market, persistently climbing oil prices boosted inflation expectations, and the US Treasury yield curve rose over 10bps during the week, driving demand from yield-oriented investors. Selling pressure remained restrained, with benchmark Chinese names performing better than non-Chinese. Specifically, in the TMT sector, the 10-year Kuaishou USD bond and Meituan USD bond spreads remained flat, while the 10-year Alibaba USD bond spread narrowed by 2bps. Hong Kong issuers also saw slight tightening, with the 10-year Link REIT USD bond spread remaining flat and the 10-year Hongkong Electric USD bond spread narrowing by 1bp.
Outlook:Consumer surveys conducted by the University of Michigan from February 17 to March 9 showed that the preliminary US consumer confidence index for March fell from 56.6 in February to 55.5, against market expectations of 54.8. As Brent and WTI broke through $100/barrel and continued to rise, rising inflation expectations triggered sell-offs in US stocks and Treasuries, while the US Dollar Index broke through 100 on Friday. Before the easing of tensions in the Middle East, oil prices remained the most important market driver, with unchanged trends in US stocks, bonds, and currency.
The transmission of crude oil prices to US consumer prices can be broken down into three main pathways: 1) Direct Effect: Changes in crude oil prices directly affect the prices of energy components such as gasoline, diesel, and fuel oil through the refined product processing stage; in the US CPI basket, energy goods and services account for a relative weight of approximately 6.5%-7.5% (dynamically adjusted based on price fluctuations), with gasoline alone accounting for about 3%; this effect is transmitted quickly, usually fully reflected in gas station retail prices within 2-4 weeks; 2) Indirect Effect/Second-Round Effect: Rising energy costs are passed on to food, core goods, and service prices through production costs, transportation costs, agricultural inputs (fertilizers, diesel), etc.; Fed research (Dallas Fed Working Paper 2224, December 2022) shows that about 70% of energy-driven cost changes in manufacturing firms will be transmitted to consumer prices in the medium term; this effect has a longer transmission cycle, typically manifesting gradually over 2-8 quarters; 3) Expectations Effect: Soaring oil prices may raise inflation expectations among consumers and businesses, thereby affecting wage negotiations and pricing behavior; Fed research (a paper published in Energy Economics by the Dallas Fed in September 2022) indicates that oil price shocks can lift US one-year inflation expectations by about 0.7 percentage points, but long-term expectations at five years are only mildly affected by about 0.15 percentage points, indicating that the Fed's ability to anchor inflation expectations remains credible on a long-term scale. Empirical research frameworks from IMF Working Paper WP/17/196 and the Federal Reserve's FEDS Notes (2023) show that every 10% increase in crude oil prices will raise overall US CPI by about 0.3-0.4 percentage points after full transmission through direct and indirect channels. In order to force Iran to open the Strait of Hormuz, the US carried out 'one of the most powerful bombing operations in Middle Eastern history' on Friday, including destroying military targets on Kharg Island. Trump posted on social media: 'Out of basic decency, I chose not to destroy the island's oil infrastructure.' However, he also warned Iran that if it interfered with vessels passing through the Strait of Hormuz, he would immediately reconsider this decision. If the strait reopens (which may take some time), oil prices are expected to drop rapidly, thereby boosting market sentiment.
We also note that the easing of the Middle East crisis has diverted market attention away from concerns about US private credit issues, which continued to develop this week: Cliffwater LLC’s flagship private credit fund faced redemption requests exceeding 7%; a US-based bank restricted redemptions on one of its private credit funds, returning about half of what investors tried to cash out; Deutsche Bank disclosed in its annual report on March 12 that its loan exposure in the private credit portfolio, calculated on an amortized cost basis, increased to 25.9 billion euros (29.9 billion US dollars), up from 24.5 billion euros in 2024. If the Middle East crisis subsides, the market focus will shift back to private credit, which could drive US stocks to fall again after a brief rebound, cause US Treasury yields to drop sharply, and weaken the US Dollar Index. The Federal Reserve is expected to remain on hold next week, and Fed officials may continue to forecast only a 25bp rate cut within 2026 in the new dot plot.
Foreign exchange market
Offshore Renminbi: This week, the market continued to fluctuate around news headlines of the Middle East conflict, with the Strait of Hormuz remaining closed and oil prices rising. The market no longer fully prices in a single Fed rate cut within the year, and both US stocks and US bonds extended their declines this week, while the US Dollar Index broke above the 100 level on Friday. Under the dual influence of a stronger US Dollar Index and strong Chinese exports, the RMB index remained relatively strong, with USD/CNH trading between 6.8600-6.9070 this week. Data released by the General Administration of Customs on Tuesday showed that China's exports from January to February reached $656.58 billion, increasing by 21.8% year-on-year, surpassing market expectations of a 7.2% increase. In the medium to long term, the RMB still has room for appreciation, although the pace may slow after the RMB index breaks above 100.
US Dollar:This week saw significant market volatility, with almost no signs of easing in the Middle East conflict. At the beginning of the week, there was noticeable panic in the markets, with crude oil prices spiking shortly after the market opened, and Brent crude oil approaching $120 per barrel within hours of Monday's opening. The deterioration in risk appetite led to a sharp decline in equities, and bonds were sold off due to ongoing concerns over persistently high energy prices. Later on Monday, President Trump stated in a tweet that he believed the war would “end soon,” pushing oil prices back below $90/barrel and causing other assets to briefly rebound. However, with no substantial negotiations between the parties and newly elected Iranian Supreme Leader Mojtaba Khamenei stating his intention to keep the strait closed and fight to the end, energy prices rose again. Developed market interest rates thus exhibited a bear-flattening trend, with pricing in most markets eliminating the possibility of central bank rate cuts and even pricing in several rate hikes; currently, the market views the Federal Reserve as having only 21 basis points of easing space until the end of the year. Adding extra resistance to government bonds was this week's record issuance of investment-grade bonds – totaling $115 billion by Thursday, including large offerings of $37 billion from Amazon and $25 billion from Salesforce. On the data front, US February CPI inflation met expectations (overall 2.4% year-on-year, core 2.5% year-on-year), but the market largely ignored it as the impact of rising energy costs had not been fully reflected in the data. This week, the yield curve flattened in a bearish manner, moving by about 19-14 basis points, with similar widening seen in SOFR OIS of 19-10 basis points. Given that yields, particularly short-term ones, are close to recent highs, close attention will continue to be paid to developments in the Middle East situation.
Macroeconomics
China:
Driven by the Middle East conflict, international oil prices and domestic commodity prices rose, narrowing the PPI decline to 0.9% in February and potentially turning positive earlier than expected. Although post-Chinese New Year construction activity resumed slowly and industrial production remained weak, and March exports might turn negative due to seasonal factors, residents’ travel maintained high momentum, and the real estate sector experienced structural recovery, especially in first-tier cities where new home and second-hand housing transactions improved significantly year-on-year (rising to 22.0% and 13.2%, respectively). Attention should be focused on the upcoming release of January-February economic activity data.
United States:
Divergences within the Federal Reserve have continued to widen, compounded by four key factors forming the core drivers of this week’s market movements: February's weaker-than-expected non-farm payroll data, escalating tensions in the Middle East driving oil prices higher, and the implementation of a 15% global tariff, with stagflation risks and policy divergence emerging as the primary contradictions. Statements by Fed officials displayed stark contrasts: on March 6, Fed Governor Waller reiterated his preference for a 25-basis-point rate cut, arguing that the oil price increases caused by Middle East tensions were temporary disruptions unlikely to result in sustained inflation, with core inflation being the key determinant for policy decisions; San Francisco Fed President Daly clearly expressed that February’s non-farm payroll data deepened concerns about the labor market, but rising oil prices brought inflationary pressure that required the Fed to be cautious about dual risks of ‘economic weakness + inflation rebound,’ suggesting no immediate rate cuts; Boston Fed President Collins and Cleveland Fed President Mester adopted a neutral stance, advocating for keeping rates unchanged for 'a period of time.' This extreme divergence caused market expectations for rate cuts to fluctuate, with CME’s “FedWatch” showing increased bets on a June rate cut, though expectations for maintaining current rates still dominated. Policy uncertainty significantly increased, further complicated by potential impacts from Trump’s nomination of Kevin Warsh as Fed Chair, adding more variables to future policy directions.
In terms of core economic and market dynamics, three key variables continued to disturb the markets this week, further exacerbating market volatility. Regarding economic data, the US net loss of non-farm payrolls in February was 92,000, far below market expectations of a 55,000 gain, marking only the second negative monthly growth since 2020, with the unemployment rate rising to 4.4%. The unexpected softness in the job market raised concerns about a soft landing for the US economy. Coupled with escalating tensions in the Middle East driving a significant spike in international oil prices, WTI crude oil futures for April delivery surged 35.6% this week, further intensifying market worries about stagflation risks. JPMorgan explicitly pointed out that the Fed is facing a challenging stagflation combination of 'economic weakness + soaring oil prices,' which became the core suppressive factor for market sentiment this week. On trade policy, the 15% US global import tariff officially came into effect this week, following adjustments made under the Trade Act of 1974 after the Supreme Court ruled Trump's previous tariffs exceeded his authority, previously increased from 10% to 15%. Over 20 US states have filed lawsuits against this tariff policy, alongside a growing wave of litigation from importers seeking refunds. The uncertainty surrounding tariff policies severely disrupted market sentiment, raising concerns over rising US corporate costs and inflation rebounds, significantly pressuring export-oriented sectors and further amplifying market volatility. Additionally, Goldman Sachs warned of three major risks in the current US stock market: extreme concentration, AI bubble, and high leverage in options. The accumulation of risks behind this 'false calm' also became an important reason for this week's capital flight to safe havens.
Japan:
Monetary Level: Unilateral yen weakening dominated market sentiment, with policy expectations diverging. This week, the yen showed unilateral weakness against both the dollar and renminbi, closely aligned with US-Japan interest rate differentials and global dollar liquidity forecasts, directly impacting exporters' profits and stock performance. The Bank of Japan maintained its current policy rate around 0.75%, making no new moves toward monetary normalization consistent with general market expectations, yet views on future policy paths remain starkly divided. The IMF previously issued a report warning the Bank of Japan to maintain independence and continue exiting monetary easing, aiming for a neutral interest rate by 2027. Recently, Japanese Prime Minister Sanae Takagi signaled tax cuts again, causing sharp fluctuations in the bond and forex markets, leading to a rapid yen depreciation and significant rises in long-term interest rates.
Industry Level: Tech sector corrections highlighted structural divergence. Momentum from the prolonged rally in memory chip prices waned, despite Kioxia announcing a first-quarter price hike for North American clients. Rising market concerns over the sustainability of price hikes and demand recovery led to significant pullbacks in semiconductor and other tech sectors, exacerbated by foreign capital outflows, substantially weakening support for tech investment tracks compared to previous robust performances. Implicit government support for the tech sector failed to offset declining economic conditions, with AI-related segments also under pressure. Traditional industries continued to struggle with slow transformation upgrades, compounded by structural challenges like aging populations and labor shortages, resulting in weak performances in traditional manufacturing and utility sectors, failing to provide market support and further increasing downward pressure on the stock market.
Europe:
Policy stabilization intertwined with external disturbances, highlighting structural contradictions, with uncertainty remaining the primary constraint on the market. On the monetary front, although this week did not see an ECB rate decision, market expectations for ECB policy stabilization continued to rise. With the approach of Global Central Bank Super Week, investors generally anticipate that the ECB will maintain the three key eurozone interest rates unchanged, continuing the previously 'steady stabilization' policy tone, providing phased support for the market. Recent statements by European Central Bank officials have shown a 'neutral to mild' stance, emphasizing that the current monetary policy position can effectively address potential shocks, while warning of dual risks of inflation rebound and economic downturn triggered by prolonged Middle East conflicts leading to rising energy prices and escalating US-EU trade frictions. Market institutions are divided on the ECB’s future policy path: some believe that core inflation in the Eurozone is expected to gradually decline, possibly opening a rate-cut window in the second half; others argue that fluctuations in energy prices and trade friction disruptions may slow the pace of inflation decline, leaving the ECB to maintain policy stability in the short term without meeting conditions for rate cuts.
On fiscal and trade fronts, favorable outcomes coexist with risk disturbances: On trade levels, the EU-Mercosur free trade agreement advanced significantly, with Brazil’s Federal Senate voting to approve the agreement on March 4, following Argentina and Uruguay completing approval procedures. This move is expected to broaden European trade space, benefiting related export enterprises and temporarily boosting market sentiment. However, internal EU divisions on the agreement have led the European Parliament to submit it to the EU Court for review, leaving long-term implementation uncertain. Meanwhile, US-EU trade frictions continue to escalate, with the US announcing plans to impose additional tariffs, prompting the EU to urgently convene meetings to reassess the US-EU trade agreement. The European Parliament previously froze the approval process for a trade agreement reached with the US in July 2025, with France opposing US 'green subsidy' clauses and Germany worried about damage to the automotive industry, further escalating bilateral disputes and disrupting market sentiment, increasing operational uncertainties for European exporters. On fiscal and economic levels, the EU carbon tariff policy will gradually come into effect starting January 1, 2026, covering 180 steel and aluminum-intensive downstream products, creating cost pressures for economies reliant on traditional manufacturing while injecting long-term momentum into environmental protection and high-end manufacturing. However, Germany’s economic recovery faces new uncertainties, with prolonged Middle East conflicts causing significant spikes in international energy prices, posing challenges to Germany, highly dependent on imported energy and with manufacturing as its backbone. Rising energy prices push up business costs, hampering industrial recovery; Germany’s January exports, imports, and industrial orders all declined, further intensifying market concerns about European economic recovery. Additionally, internal EU divisions remain unresolved, with disagreements among member states on trade policies and fiscal coordination further increasing uncertainties in policy implementation, compounded by ongoing Middle East conflicts and the Russia-Ukraine stalemate, bringing additional disturbances to European markets.
Global cyclical phase synchronization indicators:
China remains on the edge of recession; the probability of a US recession is low; Europe emerges from recession.

Data Source: Bloomberg and HARVEST
– China:Year-over-year real estate sales, year-over-year new real estate starts, year-over-year M1, year-over-year electricity generation, PMI new orders, auto sales
– United States:Unemployment-related indicators, real estate pre-sale permits, auto sales, consumer expectations, investor sentiment, new orders, stock drawdowns
– Eurozone:Economic activity indicators, real estate pre-sale permits, consumer confidence, manufacturing PMI, services PMI, credit spreads, stock drawdowns
Leading indicators of the global corporate earnings cycle
Growth LEI: Q1 China's economy may recover; European corporate earnings growth has stabilized; US corporate earnings growth is upward.

Data Source: Bloomberg and HARVEST
Key economic data from last week (Source: Bloomberg and Harvest Fund:
• [Existing Home Sales in February]:4.09 million units (consensus 3.88 million units), previous value revised to 4.02 million units (originally 3.91 million units). The key takeaway from the report is that despite continued pressure on affordability and median home prices rising for the 32nd consecutive month, sales still managed to grow.
• [Weekly MBA Mortgage Application Index]:Up 3.2%, previous value +11.0%. Purchase index rose 7.8%, refinancing index increased by 0.5%.
• [February CPI]:Month-over-month +0.3% (consensus +0.3%), year-over-year +2.4% (previous value +2.4%). Core CPI month-over-month +0.2% (consensus +0.2%), year-over-year +2.5% (previous value +2.5%). The key takeaway from the report is that the data met expectations, mildly positive, but given the recent surge in energy prices, the March reading could be hotter.
• [February Fiscal Deficit]:USD 307.5 billion (consensus -170 billion), slightly higher than the USD 307 billion deficit in February 2025. Revenue was USD 313.1 billion, expenditures were USD 620.6 billion. The key takeaway from the report is that although February's deficit far exceeded expectations, the fiscal year-to-date deficit is nearly USD 150 billion less than the same period last year, indicating some fiscal improvement.
• [Housing starts in January]:1.487 million units (consensus 1.34 million units), previous value revised to 1.387 million units (originally 1.404 million units). January building permits were 1.376 million units (consensus 1.392 million units), previous value revised to 1.455 million units (originally 1.448 million units). The key takeaway from the report is that strong growth in multi-family housing starts drove overall results above expectations, while single-family housing starts fell 2.8% month-over-month.
• [January Trade Balance]:-54.5 billion USD (consensus -67.9 billion USD), previous value revised to -72.9 billion USD (originally -70.3 billion USD). The key point of the report is that the monthly trade deficit returned to the 50-billion-USD range, a common level since tariffs were implemented last year.
• [Initial Jobless Claims Weekly]:213k (consensus 215k), previous value revised to 214k (originally 213k). Continuing claims for unemployment insurance stood at 1.850 million, with the previous value revised to 1.871 million (originally 1.868 million). The key takeaway from the report is that initial claims remained just above 200k, reflecting a low layoff environment.。
• [Second Estimate of Q4 GDP]:0.7% (consensus 1.4%), initial estimate was 1.4%. The GDP deflator was revised to 3.8% (initially 3.6%). The key takeaway is that growth slowed significantly while the price deflator was revised upwards, creating a disappointing combination.
• [January Personal Income and Outlays]:Personal income increased 0.4% month-over-month (consensus +0.4%), compared to the prior reading of +0.3%. Personal spending rose 0.4% month-over-month (consensus +0.2%), matching the prior reading of +0.4%. The PCE price index increased 0.3% month-over-month (consensus +0.3%) and 2.8% year-over-year (prior +2.9%). Core PCE price index rose 0.4% month-over-month (consensus +0.4%) and 3.1% year-over-year (prior +3.0%). The key takeaway is that the Fed's preferred inflation gauge, core PCE, edged up slightly, posing resistance to rate cut expectations.
• [January Durable Goods Orders]:Flat month-over-month (consensus +0.7%). Excluding transportation, durable goods orders increased 0.4% month-over-month (consensus +0.5%), with the previous value revised to +1.3% (originally +0.9%). The key takeaway is that the flat headline figure masked robust growth of 0.9% month-over-month in non-defense capital goods orders, a proxy for business investment.
• [Preliminary March University of Michigan Consumer Sentiment Index]:55.5 (consensus 55.7), previous final reading 56.6. The key point of the report is that about half of the interviews were completed before the Iranian military action, which triggered an increase in energy prices; therefore, the March final reading may be revised downward.
• [January JOLTS Job Openings]:6.946 million, previous reading revised to 6.550 million (originally 6.542 million). The key point of the report is that job openings rose to the highest level since December 2020.
Disclaimer:
Investment involves risks, including possible loss of principal. Past performance or any forecasts or expectations do not indicate future performance. Before making investment decisions, investors should review relevant sales documents, including risk disclosures. Investment returns not denominated in Hong Kong dollars or US dollars are subject to exchange rate fluctuations.
The interests of this company are not offered or sold in Hong Kong through advertisements, invitations, or any other documents, except in cases where it does not constitute a public offering. This document has not been approved under the Securities and Futures Ordinance or the Companies Ordinance and is intended solely for authorized persons. It must not be distributed to unauthorized persons in Hong Kong or to unauthorized persons in any other jurisdiction. This material has not been reviewed by the Securities and Futures Commission of Hong Kong. For the purposes of this statement, 'authorized persons' shall mean professional investors as defined under the Securities and Futures Ordinance whose ordinary business involves purchasing, selling, or holding securities (whether as principals or agents). Distribution of this material may be restricted in certain jurisdictions.
In cases where it would be illegal to make an offer to any person within a jurisdiction, this document shall not be deemed as an offer or invitation to such persons. This document is for reference only and does not constitute any investment advice or recommendation, nor does it constitute an offer or invitation. It is not a basis for contracts involving the purchase or sale of any securities or instruments, nor is it a basis for Harvest Fund Management Co., Ltd., Harvest Global Investments Limited, or their affiliates to enter into or arrange any type of transaction based on the information contained herein.
Although the third-party information provided above is sourced from what should be reliable sources, neither Harvest Fund Management Co., Ltd., Harvest Global Investments Limited, their authorized issuers, affiliates, nor any of their directors or employees shall bear any responsibility for any errors or omissions therein. The information and opinions expressed herein are for reference only and may be adjusted without notice, and therefore should not be relied upon for making investment decisions. You should consult your investment advisor before making any investment decision.
The issuer of this document is Harvest Global Investments Limited. This document belongs to Harvest Global Investments Limited, which holds the copyright. Further circulation of this document is prohibited without the written consent of Harvest Global Investments Limited. All rights reserved.
All rights reserved ©2026 Harvest Global Investments Limited
Risk Disclaimer: The above content only represents the author's view. It does not represent any position or investment advice of Futu. Futu makes no representation or warranty.Read more
Comments
to post a comment