
Hong Kong stocks pull back—how will they perform in the second half of the year?
HSBC rebounds over 2% - is it a technical rebound or the start of a new uptrend?
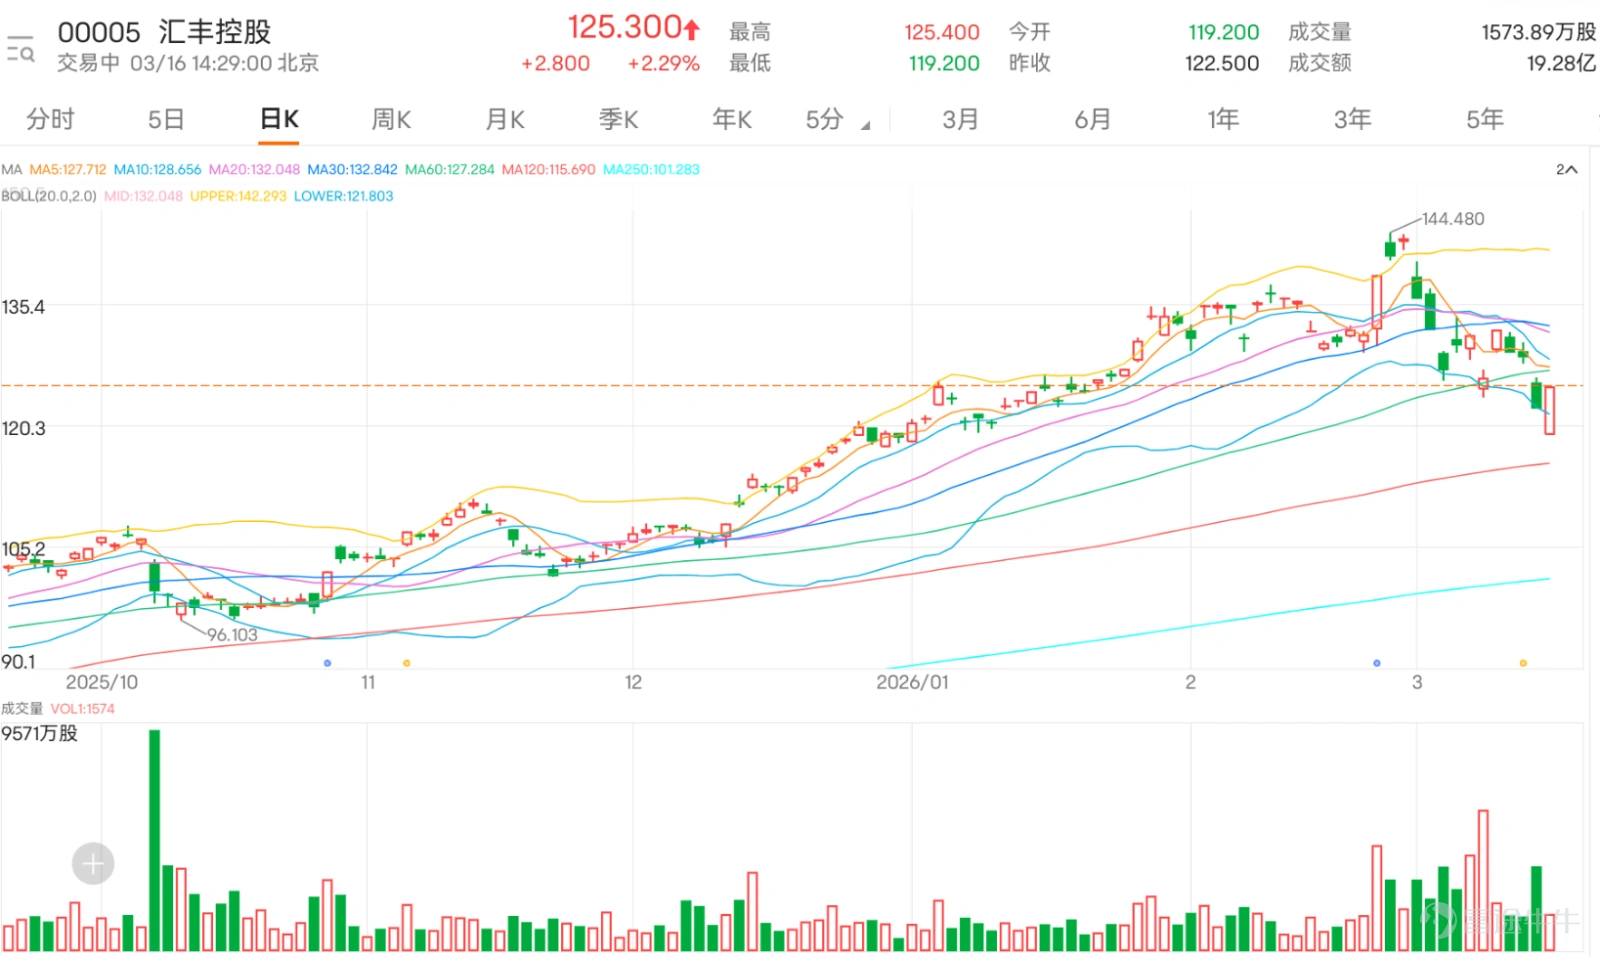
Heavyweight blue-chip stocks in Hong Kong $HSBC HOLDINGS (00005.HK)$ The recent trend shows a clear technical correction pattern. After hitting a low of HKD 119.2 in early trading, a rebound began and the stock is currently at HKD 125.3, temporarily halting the continuous downtrend. However, the price has completely fallen below the 10-day moving average at HKD 131.01, the 30-day moving average at HKD 135.97, and the 60-day moving average at HKD 130.61. The current rebound remains a technical pullback after breaking through the moving average system. Whether it can effectively break above the 60-day line (approximately HKD 130.6) will be the key observation point to determine if the rebound can upgrade into a trend recovery.
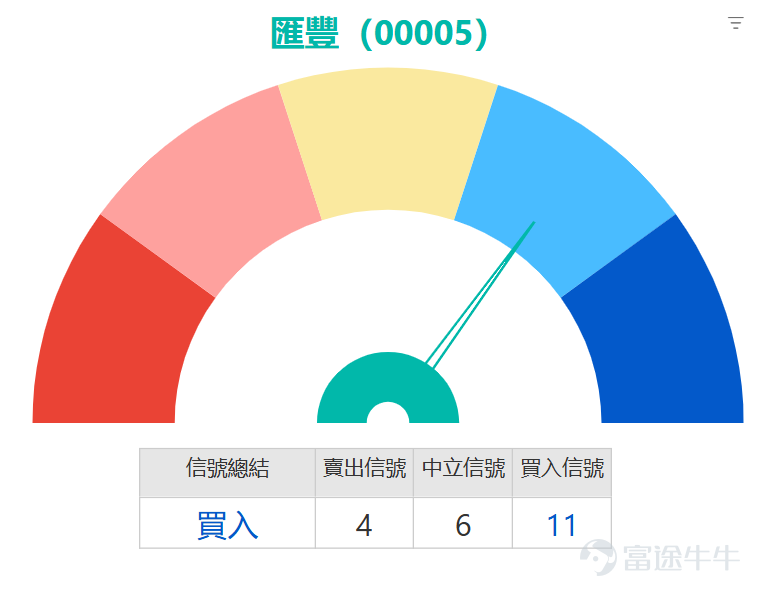
From the perspective of oscillation indicators, short-term rebound momentum is gradually building: the Relative Strength Index (RSI) has fallen to 35 in the oversold region, indicating that short-term selling pressure has been excessively released; the Stochastic Oscillator (KD) and CCI have simultaneously issued buy signals, while the Williams %R indicator also confirms the oversold condition, suggesting a technical recovery need in the short term. However, it should be noted that such momentum indicators can easily show repeated signals in a one-sided downtrend, and their reliability needs to be verified by price breakthroughs.
Trend indicators still lean towards bearish dominance: the Moving Average Convergence Divergence (MACD) maintains a sell signal, and the downward momentum in the medium and short term has not fundamentally reversed; Bollinger Bands indicate that prices are operating in the middle to lower range, with limited downside space but without extreme compression as they have not touched the lower band; Ichimoku Cloud and the Average Directional Index (ADX) similarly remain bearish, meaning overall trend control remains in the hands of the bears.
Key Price Levels and Derivatives Market Signals
In terms of price levels, the first resistance above is at $132.5, with the next resistance level at $142 upon a breakout; initial support below is seen at $118.1, acting as a short-term battleground between bulls and bears. A break below this level would test the key support at $106.4. Recently, HSBC's 5-day volatility reached 13.4%, intensifying market fluctuations and bringing bullish-bearish battles to a fever pitch.
Looking at HSBC Holdings' recent price action and derivatives positioning changes, after a continuous pullback in its share price, derivatives data reveals strong bullish sentiment: call warrant street volume surged from 410.56 million contracts to 511.67 million contracts within three days, an increase of 24.6%; meanwhile, put warrant street volume continuously declined from 507.22 million contracts to 467.3 million contracts; bull contract street volume remained largely stable, oscillating within a range of 265-269 million contracts, showing little overall change in positions; bear contract street volume steadily increased from 71.46 million contracts to 77.62 million contracts, indicating some funds are still betting on further downward pressure on the stock.

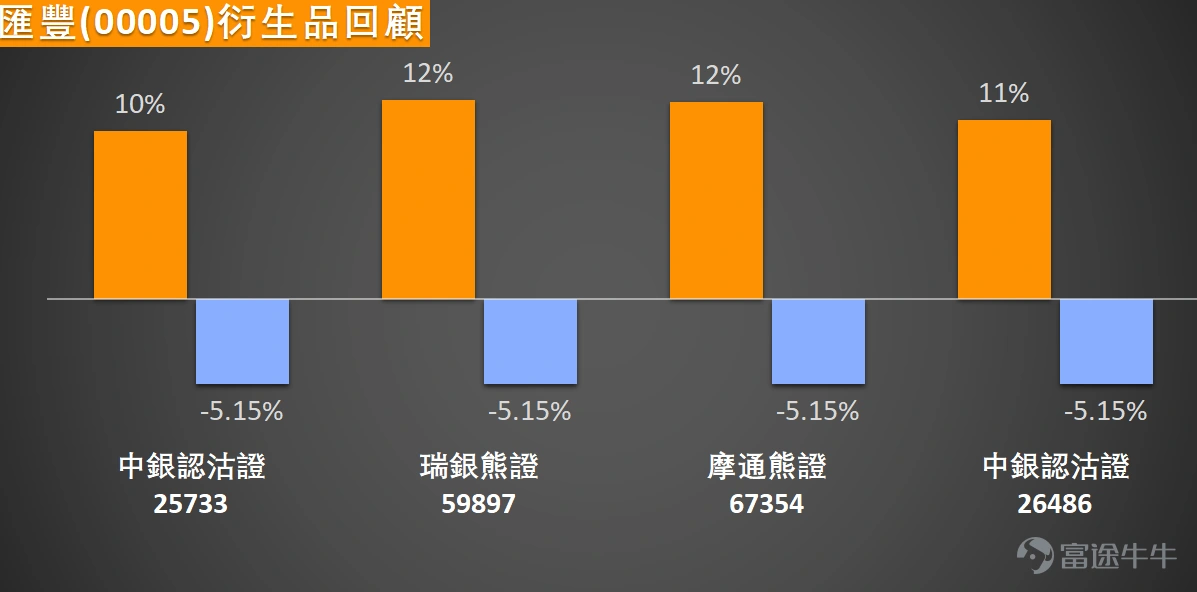
Reviewing March 10th, when HSBC’s underlying stock fell 5.15% over two days, the mentioned bearish products performed well afterward: $JP#HSBC RP2702C.P (67354.HK)$ )、 $UB#HSBC RP2702A.P (59897.HK)$ with two-day gains reaching 12%, $BI-HSBC@EP2609B.P (26486.HK)$ 、 $BI-HSBC@EP2607B.P (25733.HK)$ while others rose by 11% and 10%, respectively.
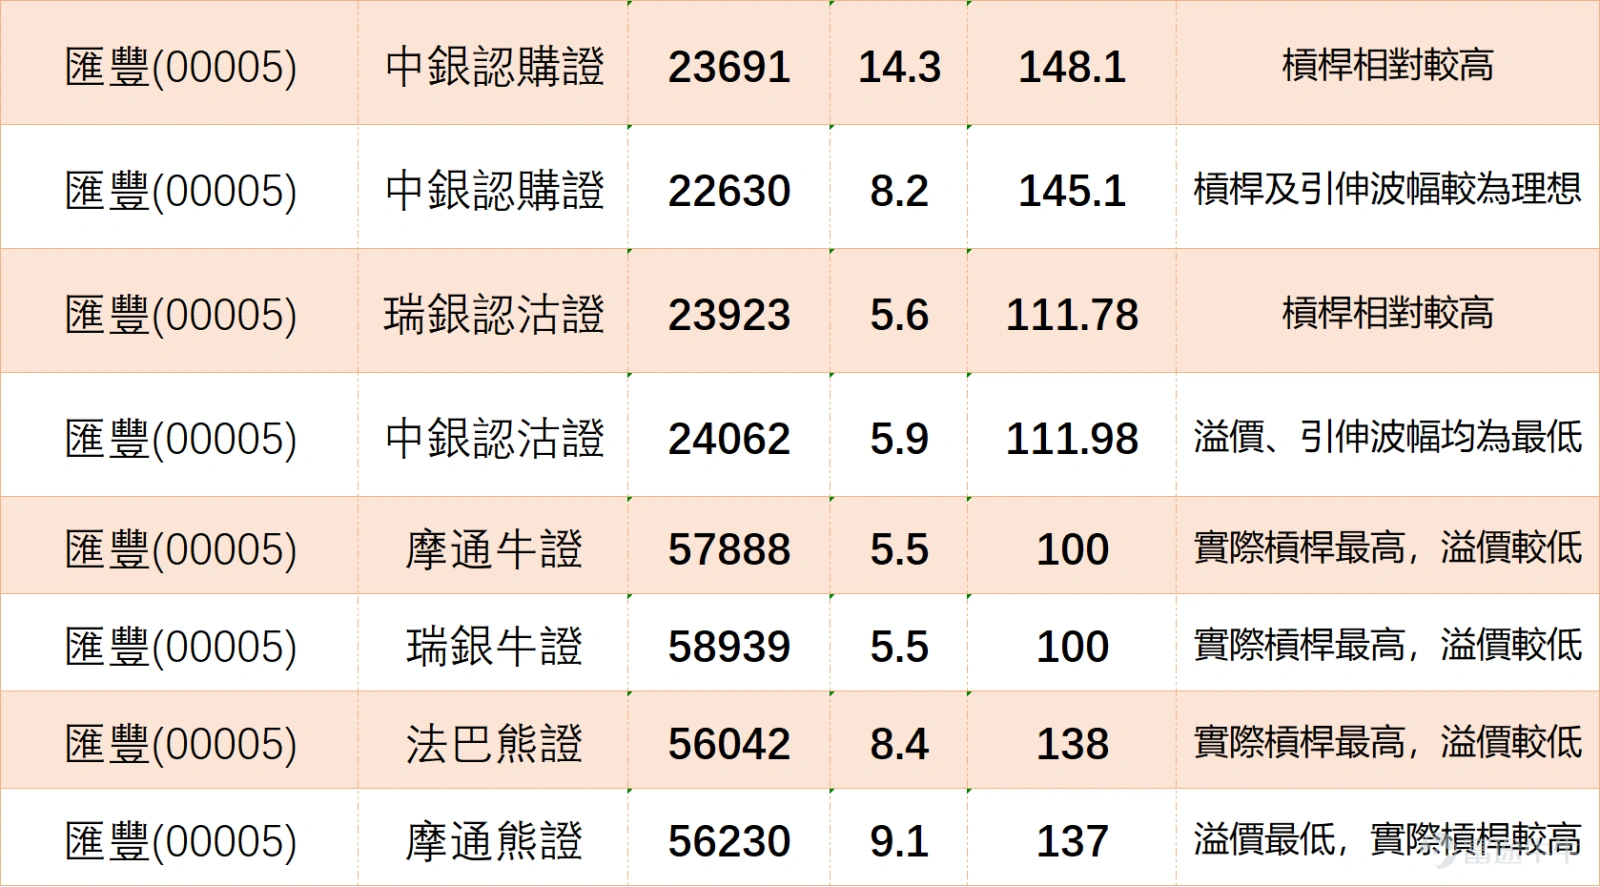
If you are optimistic about HSBC breaking through resistance and moving higher, consider $BI-HSBC@EC2605A.C (23691.HK)$ , which has a strike price of $148.1 and relatively high leverage, amplifying potential gains; another option is $BI-HSBC@EC2609B.C (22630.HK)$The strike price is 145.1 yuan, with relatively ideal leverage and implied volatility, offering an efficient bullish deployment.
If bearish or in need of risk hedging,$UB-HSBC@EP2609B.P (23923.HK)$The strike price is 111.78 yuan, with relatively higher leverage, suitable for capturing pullback opportunities; and$BI-HSBC@EP2609A.P (24062.HK)$The strike price is 111.98 yuan, with the lowest premium and implied volatility among similar products, providing better downside protection.
For leveraged products directly tracking the underlying stock, those bullish may consider$JP#HSBC RC2806G.C (57888.HK)$ or $UB#HSBC RC2806E.C (58939.HK)$Both have a stop-loss level at 100 yuan, offering the highest actual leverage and lower premiums, making them suitable for short-term rebound plays. Those bearish might consider$BP#HSBC RP2701C.P (56042.HK)$With a stop-loss level at 138 yuan, offering the highest actual leverage and lower premiums; or$JP#HSBC RP2809B.P (56230.HK)$With a stop-loss level at 137 yuan, having the lowest premium and relatively high actual leverage among similar products, suitable for betting on a pullback if resistance levels fail to break. All these products require attention to associated risks, and investors should carefully review terms and make decisions based on their risk tolerance before investing.
Do you think HSBC Holdings' recent correction has bottomed out? Is the support around 120 yuan sufficiently strong? Facing a nearly 25% short-term surge in call warrant positions, would you choose to buy the dip or mainly stay on the sidelines? Feel free to share your insights in the comment section. For more market analysis, keep following 'HK Warrants Jenny' daily updates!
Reminder: This article does not constitute any investment advice.
This article is for reference only and does not constitute any investment advice. The market data, opinions, and analysis contained herein may change at any time without prior notice. We are not responsible for any loss or damage caused by reliance on the information in this article. Technical analysis only shows whether certain technical conditions are met; a comprehensive assessment of asset performance should be conducted using additional data. Decisions to trade should not be based solely on this article. Please note that past performance is not indicative of future results.
#HongKongStocks #HangSengIndex #RealTimeAnalysis #WarrantsSelection #WarrantsStrategy #DerivativesHedging #HongKongWarrantsJenny #HSBC #00005 #TechnicalAnalysis$Hang Seng Index (800000.HK)$$Banks (LIST1079.HK)$$HSBC Holdings (HSBC.US)$
Risk Disclaimer: The above content only represents the author's view. It does not represent any position or investment advice of Futu. Futu makes no representation or warranty.Read more

Comments
to post a comment
2