

Hua Hong's Moving Average Battle: After Losing the 90 Mark, Where is the Next Line of Defense?
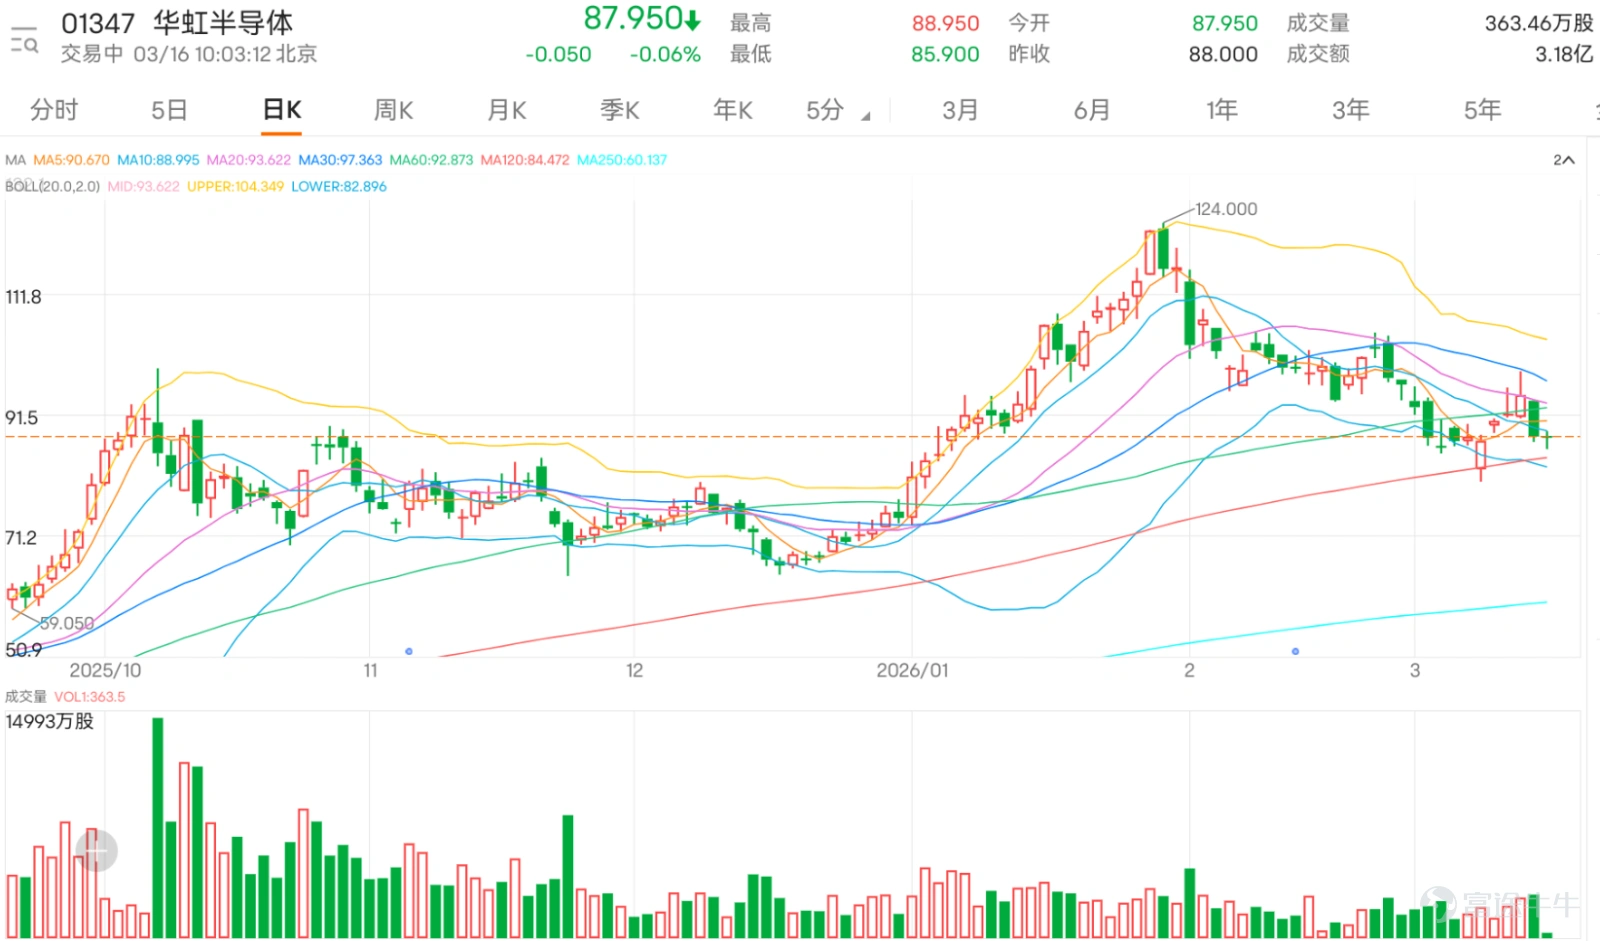
$HUA HONG GRACE (01347.HK)$ Amidst the tug-of-war between bulls and bears, today (August 16) saw an intra-day low of HKD 86.3, not only erasing all recent rebound gains but also clearly breaking below multiple key moving averages such as the 10-day (HKD 89.5), 30-day (HKD 98.52), and 60-day (HKD 92.61) lines. This indicates that the medium- to short-term trend has shifted into a bearish pattern, with significant overhead pressure from the moving average system.
Although the stock price continues to test new lows, the stochastic oscillator (KDJ) and CCI have both entered deeply oversold territory, issuing preliminary 'buy' signals. This typically means that downward momentum may be waning in the short term, suggesting excessive selling pressure. Meanwhile, the RSI relative strength index stands at 44, which, though not extremely oversold, has moved away from the strong zone into a neutral-to-weak state, leaving room for a rebound. Additionally, the momentum oscillation indicator (MTM) also gives a 'buy' signal, further reinforcing the possibility of a shift in momentum. However, trend indicators like MACD and Ichimoku Cloud still clearly show 'sell' signals, indicating that the mid-term downward inertia has not been completely reversed, explaining why any rebound in the early stages may face significant resistance. The overall technical indicator summary signal is 'buy,' with an intensity of 10.
In terms of key price levels, the stock is currently testing the first important support level at 83.6 yuan. If it breaks below this, it may further drop to a strong support zone at 72.5 yuan. On the upside, the rebound will first face strong resistance at 97.8 yuan (the lower edge of the previous consolidation range intersecting with the short-term moving average). If it can break through, the next target will be around 104.9 yuan. The current 5-day volatility of about 21.1% shows that market fluctuations have sharply increased, with fierce battles between bulls and bears, creating conditions for short-term trading.

Hua Hong's share price fell more than 7% in the last trading session. Looking at the data on derivatives street volume over the past three trading days, market funds have already begun significant positioning at key levels. First, the call warrant street volume climbed continuously from 294.07 million units on March 11 to 323.29 million units on March 13, with a cumulative increase of nearly 10%. In contrast, the put warrant street volume grew only from 57.99 million units to 61.87 million units during the same period, with an increase of less than 7%.
Bull-bear certificate data also releases bullish signals, with bull certificate street volume surging 27.3% in three days from 28.65 million units to 36.47 million units. Conversely, bear certificate street volume dropped on March 13 from 20.43 million units the day before to 19.83 million units, showing that bearish forces are starting to converge near key support levels. However, it’s worth noting that the concentration of bullish derivatives holdings is relatively high. If the stock price fails to quickly recover above 90 yuan in the short term, profit-taking pressure before expiration could temporarily affect the stock's performance.
Looking back at March 9th, two days later, Huahong's stock rose by 5.10%, driving the performance of related derivatives, among which $BI#HUAHORC2612A.C (65970.HK)$ the two-day increase reached 34%; $UB#HUAHORC2607N.C (65160.HK)$ a similar rise of 27% followed closely; $BIHUAHO@EC2607A.C (23605.HK)$ with a rise of 16%.

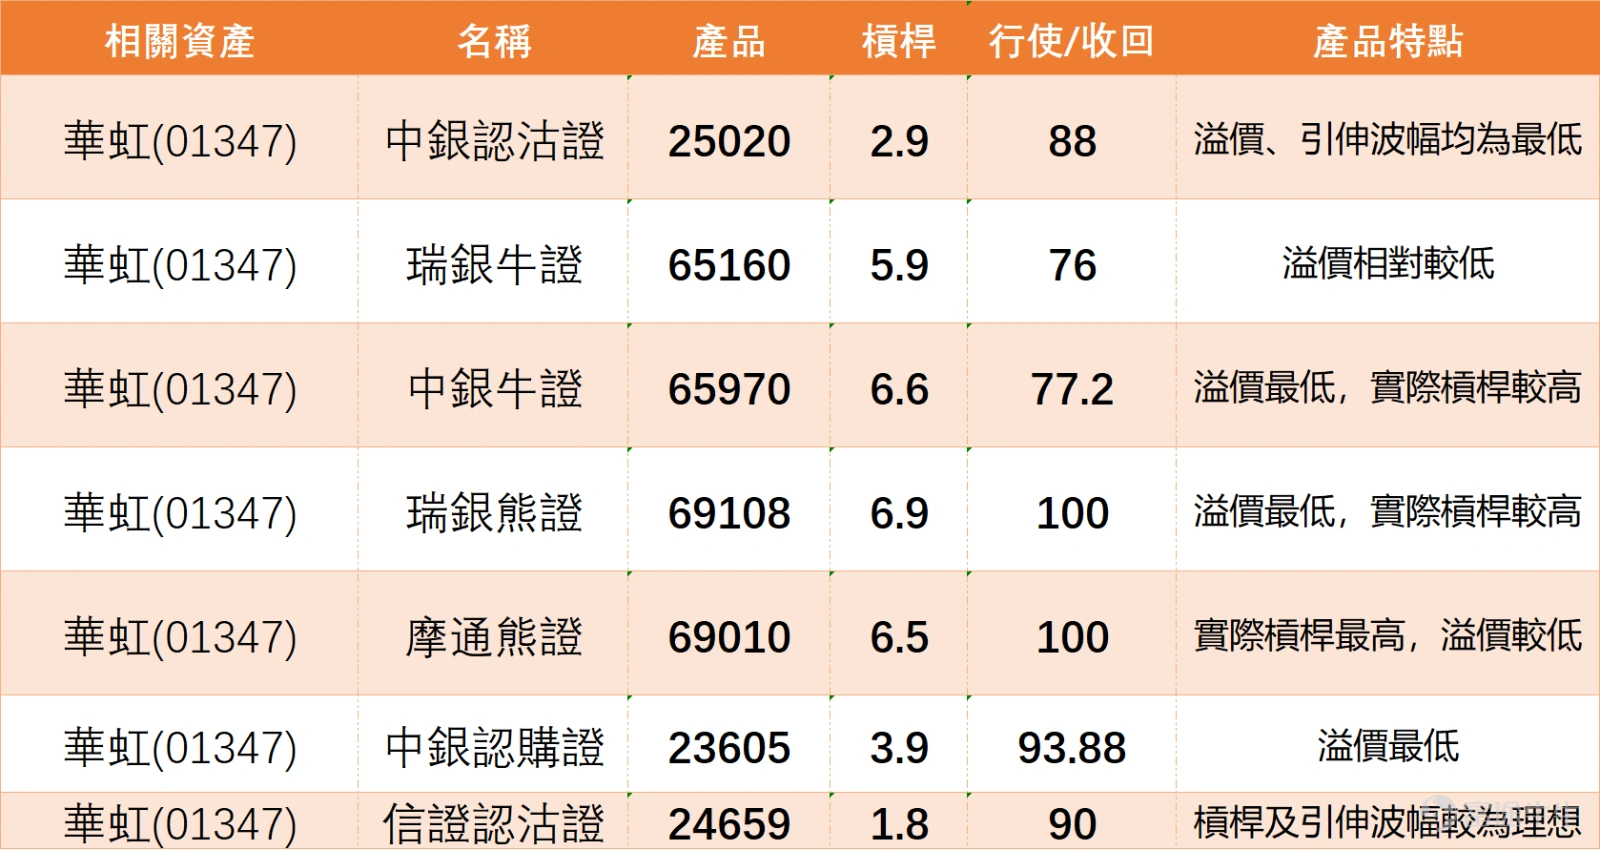
If optimistic about Huahong’s short-term rebound potential, for call warrants, investors can consider $BIHUAHO@EC2607A.C (23605.HK)$ , with an exercise price of 93.88 yuan and an actual leverage of approximately 3.9 times. This warrant has the lowest premium among similar products in the market, making it suitable for investors who are bullish on Huahong's future performance and wish to deploy a rebound strategy at a relatively low cost.
For put warrants, there are two options to consider: the first is $BIHUAHO@EP2607C.P (25020.HK)$ , with an exercise price of 88 yuan and leverage of about 2.9 times, featuring the lowest premium and implied volatility among current choices, effectively reducing holding costs. The other is $CIHUAHO@EP2611A.P (24659.HK)$ , with an exercise price of 90 yuan and leverage of about 1.8 times, offering relatively ideal leverage and implied volatility, making it suitable for investors who are bearish on the stock price and wish to capture downside opportunities with moderate leverage.
Bull certificate options include $UB#HUAHORC2607N.C (65160.HK)$ , with a recovery price of 76 yuan, leverage of approximately 5.9 times, and relatively low premium, suitable for those optimistic about the market and wishing to deploy higher leverage in the medium to short term. Another one $BI#HUAHORC2612A.C (65970.HK)$ , with a recovery price of 77.2 yuan, leverage of around 6.6 times, this product has the lowest premium in its category, and its actual leverage is relatively high, enhancing capital efficiency.
Regarding bearish certificates, $UB#HUAHORP2812K.P (69108.HK)$The recovery price is 100 yuan, leverage is about 6.9 times, and the premium is one of the lowest in the market. The actual leverage is also relatively high, making it suitable for investors who are bearish on the market outlook and seeking higher leverage. Another one $JP#HUAHORP2809A.P (69010.HK)$ , with the same recovery price of 100 yuan, leverage of around 6.5 times, its actual leverage is the highest among similar products, and the premium is relatively low, ideal for capturing stock price pullback opportunities.
Do you believe that the current divergence between oscillation indicators and trend indicators signals more of a rebound within a continuing downtrend or the establishment of a阶段性 bottom?
Feel free to share your insights in the comment section. For more market analysis, please continue following ‘Hong Kong Stock Warrants Jenny’ for daily updates!
Reminder: This article does not constitute any investment advice.
This article is for reference only and does not constitute any investment advice. The market data, opinions, and analysis contained herein may change at any time without prior notice. We are not responsible for any loss or damage caused by reliance on the information in this article. Technical analysis only shows whether certain technical conditions are met; a comprehensive assessment of asset performance should be conducted using additional data. Decisions to trade should not be based solely on this article. Please note that past performance is not indicative of future results.
#HongKongStocks #HangSengIndex #RealTimeAnalysis #WarrantsSelection #WarrantsStrategy #DerivativesHedging #HongKongWarrantsJenny #HuahongSemiconductor #01347 #TechnicalAnalysis$Hang Seng Index (800000.HK)$$Hang Seng TECH Index (800700.HK)$$Semiconductors (LIST1013.HK)$
Risk Disclaimer: The above content only represents the author's view. It does not represent any position or investment advice of Futu. Futu makes no representation or warranty.Read more
Comments (2)
to post a comment