

March 13 [Hong Kong Stock Podcast] Hang Seng Index, Mobvista, China Unicom, SMIC, JD.com, CNOOC
1. Hang Seng Index $Hang Seng Index (800000.HK)$
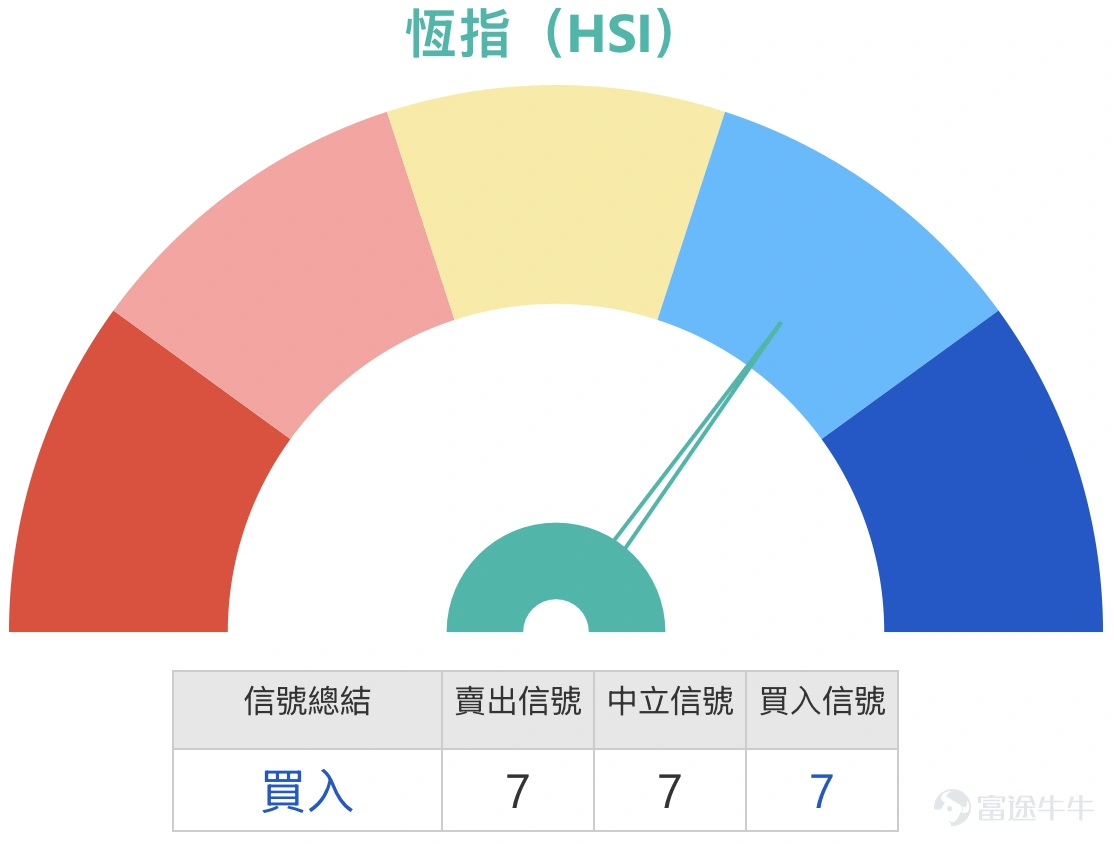
Observing from the daily chart, the Hang Seng Index is still in a recovery phase after a pullback. In mid-February, the index briefly tested the area near 28,000 points but subsequently saw significant profit-taking and gradually fell below short-term moving averages, forming a correction structure from recent highs. The recent low touched around 24,900 points before a technical rebound occurred, but the rebound strength remains limited. Currently, the index is still trading below several medium- and short-term moving averages, indicating that overall market sentiment remains cautious.
From the perspective of moving average structures, the 10-day, 20-day, and 30-day moving averages are all gradually converging downward, with the short-term average cost declining. At present, the index has not yet been able to regain a position above the 20-day moving average, reflecting that the short-term trend has not fully reversed. If the index fails to quickly recover the 20-day moving average zone, the market may continue to maintain a weak and volatile pattern. On the other hand, the 50-day moving average remains at a higher level, maintaining some distance from current prices, meaning the medium-term trend is still in an adjustment period.
From a technical range perspective, an important boundary for the market recently is approximately at the 25,400-point level. This position is close to the recent rebound zone and is also one of the short-term high-density trading areas, thus playing a key role as an indicator for short-term direction. If the index can stabilize above 25,400 points, there may be an opportunity to gradually challenge the 25,800 to 26,200-point region, which coincides with the overlap of multiple short-term moving averages, suggesting relatively noticeable resistance. A further breakout above 26,200 points could improve market sentiment, potentially leading to a gradual test of the 26,500 to 26,800-point area.
On the contrary, if the index cannot hold steady above 25,400 points, it indicates that the short-term rebound structure remains fragile, and the market may re-test lower support levels. The first notable support zone is near 25,000 to 24,900 points, which is the recently formed short-term low. If this area breaks down, the next important technical support would be around 24,800 points, which many investors currently view as a potential pullback target. Once the 24,800-point level is breached, the overall correction structure might expand further, and market volatility could significantly increase.
In terms of momentum indicators, the RSI is still hovering around 40, not entering an extremely oversold region, but remaining generally weak, indicating that market momentum has not fully recovered. Regarding trading volume, turnover increased during recent declines, while rebounds were relatively muted, showing that capital remains conservative in the short term, and there is no strong evidence of aggressive buying momentum.
Regarding the two perspectives proposed by investors, if the bullish investors believe that the index can stabilize above 25,400 points and open higher next Monday, it is indeed possible from a technical perspective. If the market opens higher in the early session on Monday and remains above 25,400 points, the short-term technical pattern could form a 'continued rebound from a low' structure. In this scenario, the market might gradually recover some of the recent losses, targeting the 25,800 to 26,200-point range in the short term. However, it’s important to note that if you choose to hold bullish warrants overnight, you still need to monitor whether the market can truly hold above 25,400 points after Monday's open. If it quickly reverses and falls below that level, the short-term risk for the bullish warrants will significantly increase.
As for bearish investors who believe that the market may open lower next week and break through 25,400 points, potentially testing 24,800 points, this view cannot be ruled out based on the current overall technical structure. If the market opens lower on Monday and quickly breaks below 25,400 points, short-term market sentiment could weaken again, and the index might test the 25,000 to 24,900-point range once more. If this range fails to hold, 24,800 points will become the next key technical support level. However, it should be noted that if significant buying emerges near 24,800 points, a rapid rebound could occur in the short term. Therefore, even when implementing a bearish warrant strategy, it is necessary to control the stop-loss price distance.
From the current structure, if bearish warrant investors consider using 26,382 points as a stop-loss line, technically this represents a relatively distant upper-risk zone. Since the area near 26,300 points is close to a cluster of short-term moving averages and the previous consolidation zone, if the index rebounds to this region, market sentiment could change significantly. Thus, when holding bearish warrants overnight, it is crucial to closely monitor whether there is a sharp rebound in the early session on Monday. Once the index stabilizes back above 25,800 points, the likelihood of advancing towards 26,300 points increases.
In terms of short-term trading strategies, the most reasonable approach is still to use 25,400 points as the dividing line for short-term direction. If the index can stabilize above 25,400 points after Monday's open and gradually push upward, it might be worth considering a moderately bullish position, targeting the 25,800 to 26,200-point range in the short term, but with a risk control in place for a potential drop below 25,400 points. Conversely, if the market opens lower and breaks below 25,400 points, it might be appropriate to adopt a moderately bearish strategy, targeting the 25,000 to 24,900-point range initially, then potentially looking towards the 24,800-point area, while being mindful of a possible technical rebound in this zone.
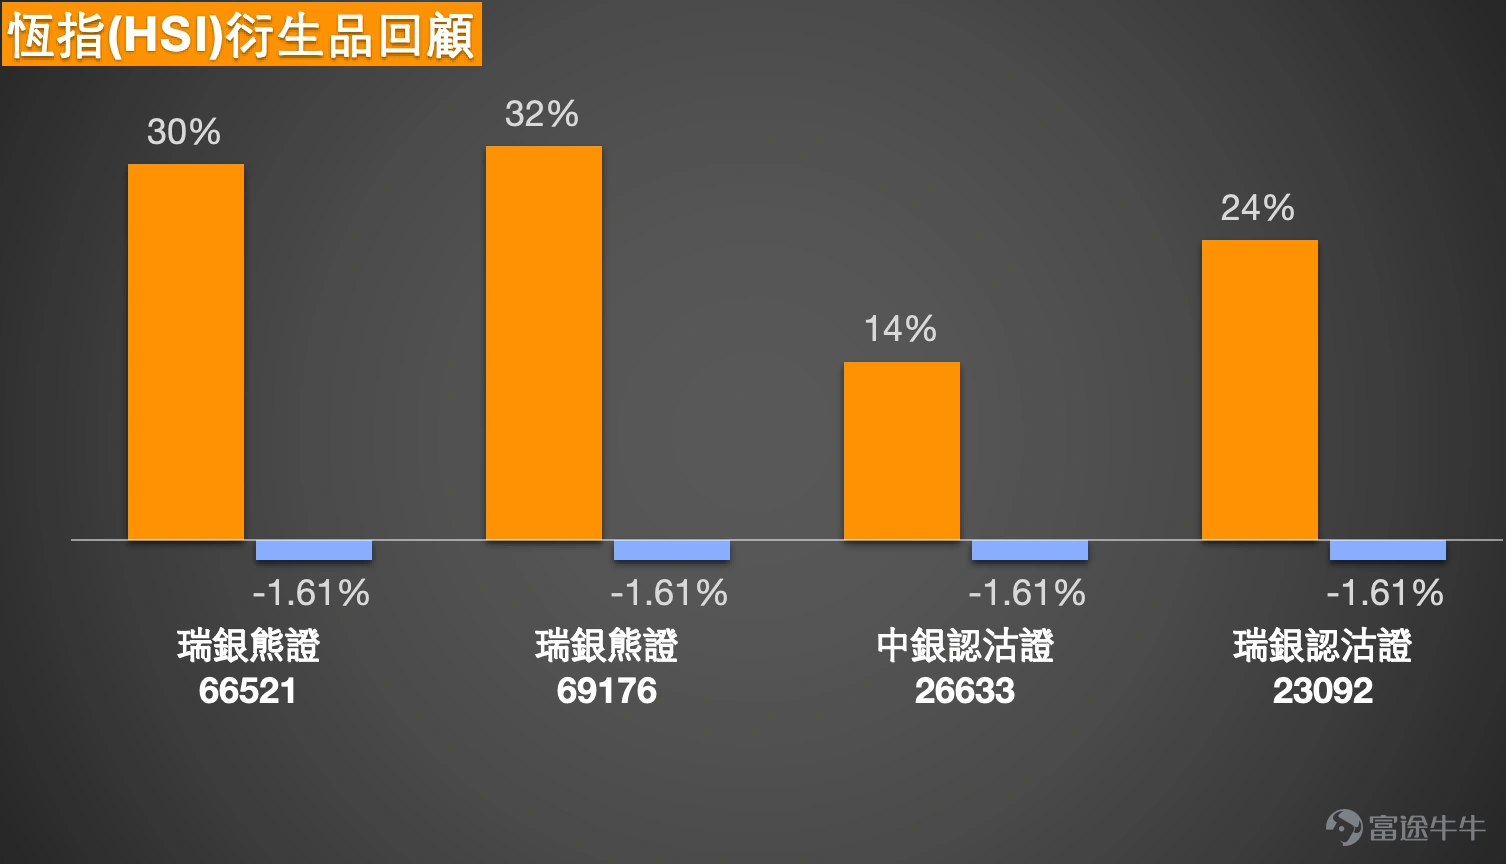
Overall, the Hang Seng Index (HSI) remains at a critical juncture between a rebound and adjustment, with 25,400 points serving as the key dividing line for short-term bulls and bears. When deploying bullish or bearish warrant strategies, short-term traders should focus not only on directional judgment but also on observing the actual market reaction around this level, along with controlling the stop-loss price distance to avoid excessive risk during volatile market conditions.$UB#HSI RP2804W.P (66521.HK)$$UB#HSI RP2811Y.P (69176.HK)$$BI-HSI @EP2608B.P (26633.HK)$$UB-HSI @EP2605B.P (23092.HK)$
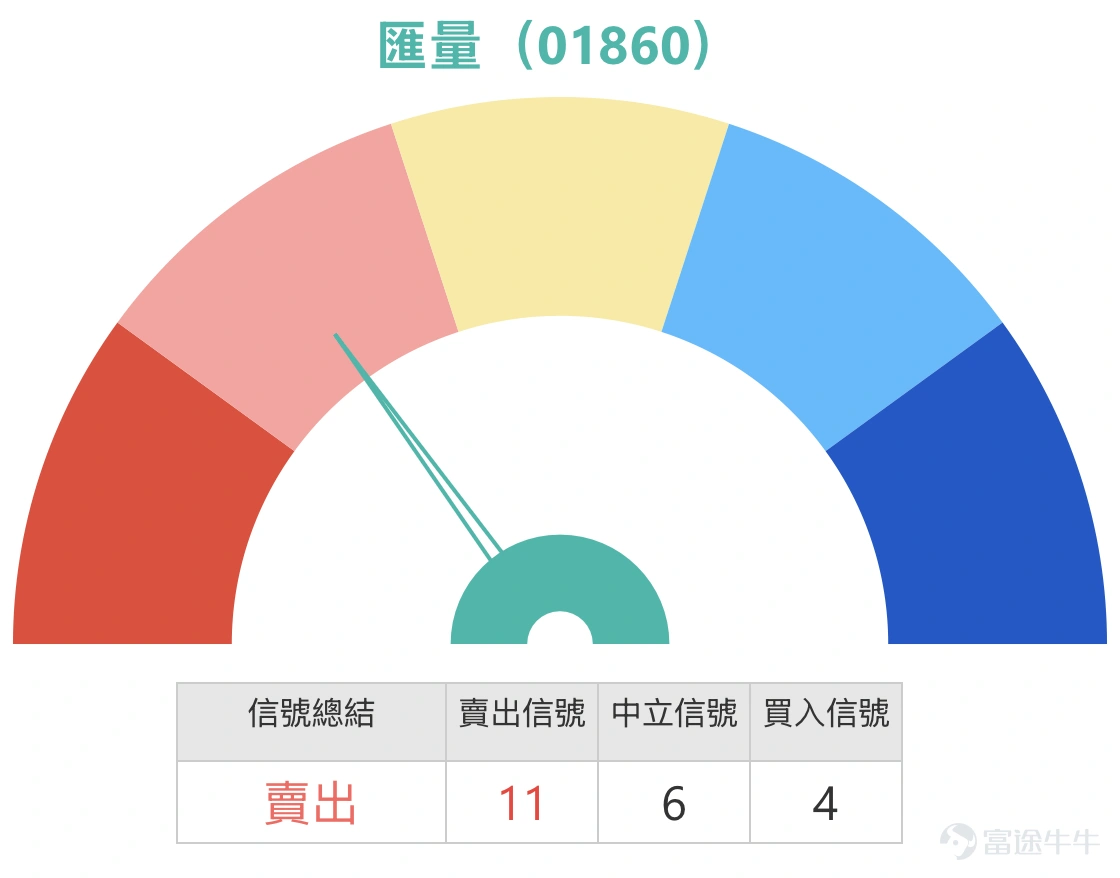
From the daily technical chart perspective, Mobvista Technology's stock price has recently formed a clear 'accelerated rebound from a low' pattern. After forming a temporary low around HK$11.27, the share price began to gradually rise, moving along the short-term moving averages, and more recently experienced a sharp upward phase, breaking back above both the 10-day and 20-day moving averages. Trading volume also increased significantly, indicating a return of capital flow into the stock. From a technical standpoint, this type of rally typically represents a 'trend recovery phase,' where an uptrend re-establishes itself following a mid-term correction. However, whether it can directly extend into a new long-term high requires monitoring the breakout situation of key resistance levels.
Technically, the first important short-term support zone is around HK$15 to HK$15.30, which is near the recent breakout area and the intersection of several short-term moving averages. If the share price can stabilize above this zone during pullbacks, the overall short-term uptrend structure can remain intact. The next support level lies around HK$14 to HK$14.30, corresponding to the previous consolidation zone and close to the 20-day moving average. A drop back to this level would significantly weaken the short-term upward momentum. On the upside, the initial resistance to watch is in the HK$17 to HK$17.50 range, near the recent heavy trading zone and a level where selling pressure has appeared multiple times in the past. If this range is successfully broken and stabilized, the next major resistance will be around HK$19 to HK$20, which is a key strike price level closely watched by many warrant investors.
Regarding investors' question about whether this wave will reach a new all-time high, historically, Mobvista Technology hit a peak of approximately HK$21.62.
Therefore, for the stock price to truly challenge its all-time high, technically it would need to first break through the mid-term resistance zone near 20 yuan, and then further test the region above 21 yuan. Based on the current trend, although recent rebound momentum has been strong, the stock price is still a certain distance away from its historical peak, with multiple resistance levels yet to be breached. Thus, the probability of reaching a new high in the short term still depends on whether there will be sustained capital inflow and sufficient trading volume. In other words, the technical pattern is improving, but it has not fully entered the 'all-time high breakout' phase.
In the warrant market, some investors holding call warrants with an exercise price of 20 yuan are essentially betting that the stock price may rise to challenge the 20-yuan level. From a technical perspective, 20 yuan indeed represents a psychologically significant resistance level and is also close to the mid-term pressure zone. Therefore, if the stock price fails to break through the 17-18 yuan range and form a new upward leg, the call warrants with a 20-yuan exercise price will remain deep out-of-the-money in the short term. In other words, such products are more suited for 'aggressive deployment,' requiring a sustained uptrend in the stock price to gradually move into a more favorable position.
From the perspective of short-term trading strategies, after the recent sharp rise, the stock price is now approaching the overbought zone, with the RSI clearly trending upwards, suggesting the possibility of a technical pullback in the short term. If investors wish to deploy a relatively stable short-term strategy following the trend, they could observe whether the stock consolidates and stabilizes again around 15 to 15.30 yuan. If support holds in this area and the price breaks through the 16.80-17 yuan zone again, there may still be opportunities to extend the upward movement toward the 18 or even 19 yuan levels. Conversely, if the stock falls below 15 yuan and fails to hold above 14.30 yuan, it indicates a clear weakening of the short-term uptrend, and the market may enter a period of consolidation.
Overall, Mobvista is currently in a rebound trend but has yet to enter the stage of breaking through its all-time high. In the short term, the key resistance zone will be between 17 and 17.50 yuan. If the stock can break through this zone, market sentiment will improve further, paving the way for a test of 20 yuan. If it fails to do so, the stock may consolidate within the 14-17 yuan range. For investors holding call warrants with an exercise price of 20 yuan, what matters most is not short-term fluctuations but whether the stock can gradually break through the two mid-term resistance levels at 17 and 18 yuan. Only when the stock approaches the 20-yuan area will the sensitivity and value of these out-of-the-money call warrants begin to increase significantly.
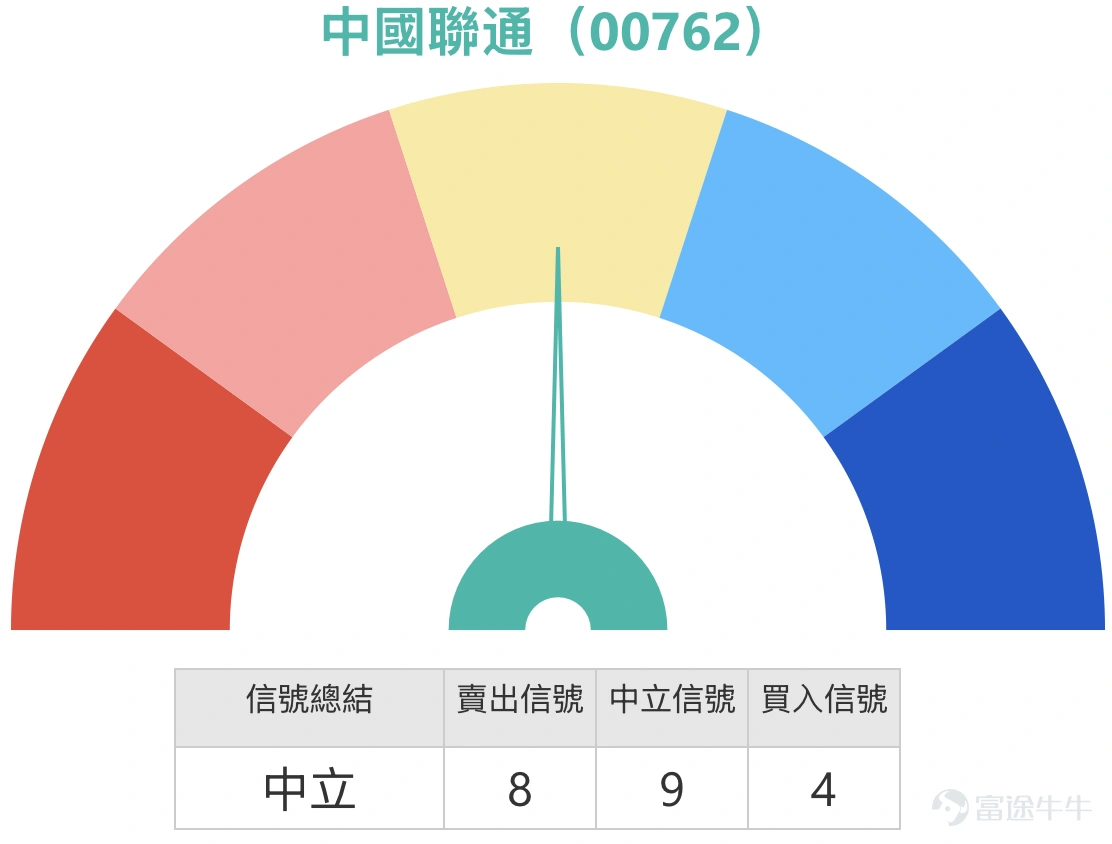
From the daily chart, China Unicom is still in a phase of low consolidation after a medium-term correction. The chart shows the stock price gradually declining from around 9.3 yuan to about 7.07 yuan, forming a temporary low before starting to show signs of a technical rebound. Currently, the stock price has recovered to around 7.79 yuan, showing a rebound structure where lows are gradually rising. However, the overall weak medium-term moving average arrangement has not been fully reversed.
Looking at the moving average structure, the short-term 5-day and 10-day moving averages have begun to converge upwards and approach the stock price, indicating that short-term rebound momentum is accumulating. However, the 20-day and 30-day moving averages are still above the stock price, and the longer-term moving averages continue to slope downward, showing that the overall trend has not yet turned bullish. Thus, the most reasonable interpretation is that the stock is in the 'early stage of a rebound from a low,' rather than having formed a definitive upward trend.
In terms of technical support, a notable short-term support zone is near 7.50-7.55 yuan, close to the consolidation area during the recent rebound and also near the short-term moving average zone. As long as the stock remains above this zone, the short-term rebound structure may continue. The next support level is around 7.30 yuan, while the more critical mid-term support is the previous low at 7.07 yuan. A drop back to this area would disrupt the overall rebound structure.
On the resistance side, the first level to watch is around 8.03 yuan, which was the previous rebound high and is near the intersection of several short- to medium-term moving averages. Therefore, continued short-term rebound toward this zone may encounter resistance. If the stock can break through and stabilize above 8.03 yuan, the next noticeable resistance will be near 8.27 yuan, followed by the medium-term moving average pressure zone around 8.50 yuan. Based on the current technical structure, for the stock to turn decisively bullish, it needs to first break through 8.03 yuan and gradually challenge the 8.27 yuan area.
Regarding investors' questions about whether China Unicom's lagging performance compared to other telecom companies makes it suitable for catching up, based purely on the current chart structure, the stock is indeed in the early stages of a rebound from a low but has not yet shown a clear breakout signal. At this stage, it is closer to a 'technical rebound phase' rather than a stable uptrend. Thus, a reasonable strategy for catching up isn’t chasing prices in the middle of a rebound but observing whether the stock can break through key resistance levels, such as around 8.03 yuan. Once the stock successfully breaks through and stabilizes above this zone, market sentiment may see a notable improvement.
As for holding call warrants with a strike price of 8.88 yuan, given the current stock price of about 7.79 yuan, this product still represents a significantly out-of-the-money structure. Even if the stock price rebounds to around 8.03 yuan or 8.27 yuan, there is still some distance from the strike price of 8.88 yuan. Therefore, such products are more geared towards aggressive positioning and require a sustained upward trend in the stock price to gradually improve sensitivity. In other words, a short-term rebound alone may not be sufficient to cause significant price changes in such out-of-the-money call warrants unless the stock price can break through multiple resistance levels and gradually approach the 8.8-yuan mark.
In terms of short-term trading strategies, the key observation point remains the support zone at 7.50 yuan. If the stock price can hold steady above 7.50 yuan during short-term pullbacks and break upward again through the 7.90 yuan to 8.03 yuan region, the short-term rebound has the potential to continue, with an initial target at 8.03 yuan and subsequently at 8.27 yuan. Conversely, if the stock fails to hold above 7.50 yuan and falls below 7.30 yuan, it would indicate weakening short-term rebound momentum, and the stock may revert to a lower-range consolidation pattern.
Overall, China Unicom’s technical pattern is still in the stage of lower-level recovery; a short-term rebound has begun, but no clear trend breakout signal has emerged yet. If the stock price can break through 8.03 yuan and stabilize above it, the market will have the opportunity to gradually form a clearer upward structure. Otherwise, it may remain in a range-bound consolidation between 7.30 yuan and 8.03 yuan. For investors holding call warrants with a strike price of 8.88 yuan, the more critical aspect is to observe whether the stock price can progressively break through these resistance levels, as only when the stock approaches the 8.5-yuan level or higher will the sensitivity and trading value of such out-of-the-money call warrants begin to show significant improvement.$CI-CUNI@EC2607A.C (24226.HK)$

From the perspective of the daily chart, SMIC's overall structure is still in an adjustment phase following a pullback from recent highs. The chart shows that the stock previously tested near 80.10, then gradually retreated, breaking below several medium- and short-term moving averages, forming a relatively evident downtrend. Subsequently, the stock found a阶段性 low near 58.30 before experiencing a technical rebound. Currently, the stock price has returned to around 62.20, but overall, it has failed to reclaim key mid-term moving averages, indicating that the market is still in a recovery phase and has not completely reversed the downward trend.
From the perspective of the moving average structure, the short-term 5-day and 10-day lines are approaching the stock price, while the 20-day line and longer-term averages remain above. Additionally, the moving averages are still arranged in a downward pattern, reflecting ongoing intermediate-term pressure. This pattern typically suggests that the market is in a "post-decline rebound" phase, meaning that while short-term technical rebounds may occur, if the price fails to break above the moving average resistance, the overall trend remains weak.
Regarding support levels, the most visible short-term support on the chart is first around 60 to 59 yuan, which is close to the starting point of the recent rebound and also near the short-term price consolidation zone. As long as the stock price can remain above this area, the short-term rebound structure can still be maintained. A more important next-tier support lies near 58.30, clearly marked as the recent low on the chart. If this level is broken again, the overall downtrend may resume. In other words, 58.30 is currently the most crucial technical support level on the entire chart.
In terms of resistance, the immediate short-term focus should be around 64 yuan, which is close to the recent rebound high and also aligns with the short-term moving average cluster. Thus, if the stock rebounds to this area, it is likely to encounter some resistance. If it can break through and stabilize above 64 yuan, the next resistance zone will be around 66 to 67 yuan, near the 20-day moving average position and also an important turning point in the previous decline. If the stock fails to break through 64 yuan, it will likely continue oscillating within the 58 to 64 yuan range.
Regarding investors' concerns about the 'support levels,' based on the current chart structure, support near 60 yuan serves as the first short-term line of defense, while 58.30 acts as the most critical technical barrier. As long as 58.30 is not breached, the market can still be viewed as being in a lower-range consolidation and recovery phase. However, if this level is broken, it would imply that the overall downtrend may resume.
As to whether it's a good time to "buy the dip," from a technical perspective, the market is still in the early stages of a rebound rather than a clear trend reversal. Although the stock price has rebounded from the low of 58.30, it hasn't yet broken through the resistance at 64 yuan or regained its position above the major moving averages. Therefore, a more reasonable strategy at this stage is to observe the support level and how well it holds, rather than chasing the stock mid-rebound. If the stock price pulls back to around 60 yuan and shows stable buying interest, coupled with rebound signals, then short-term technical positioning could be reasonable. Conversely, if the stock price falls directly back toward 58 yuan, we need to watch for significant buying interest reappearing at that level.
For short-term trading strategies, the range between 60 yuan and 58.30 can be considered the primary observation zone. If the stock finds support near 60 yuan and breaks upward through the 63 to 64 yuan region again, there’s potential for the rebound to extend toward the 66 yuan mark. On the other hand, if the stock falls below 60 yuan and gradually approaches 58.30, market sentiment may weaken again, and at that point, it will be critical to watch for the risk of breaking lower.
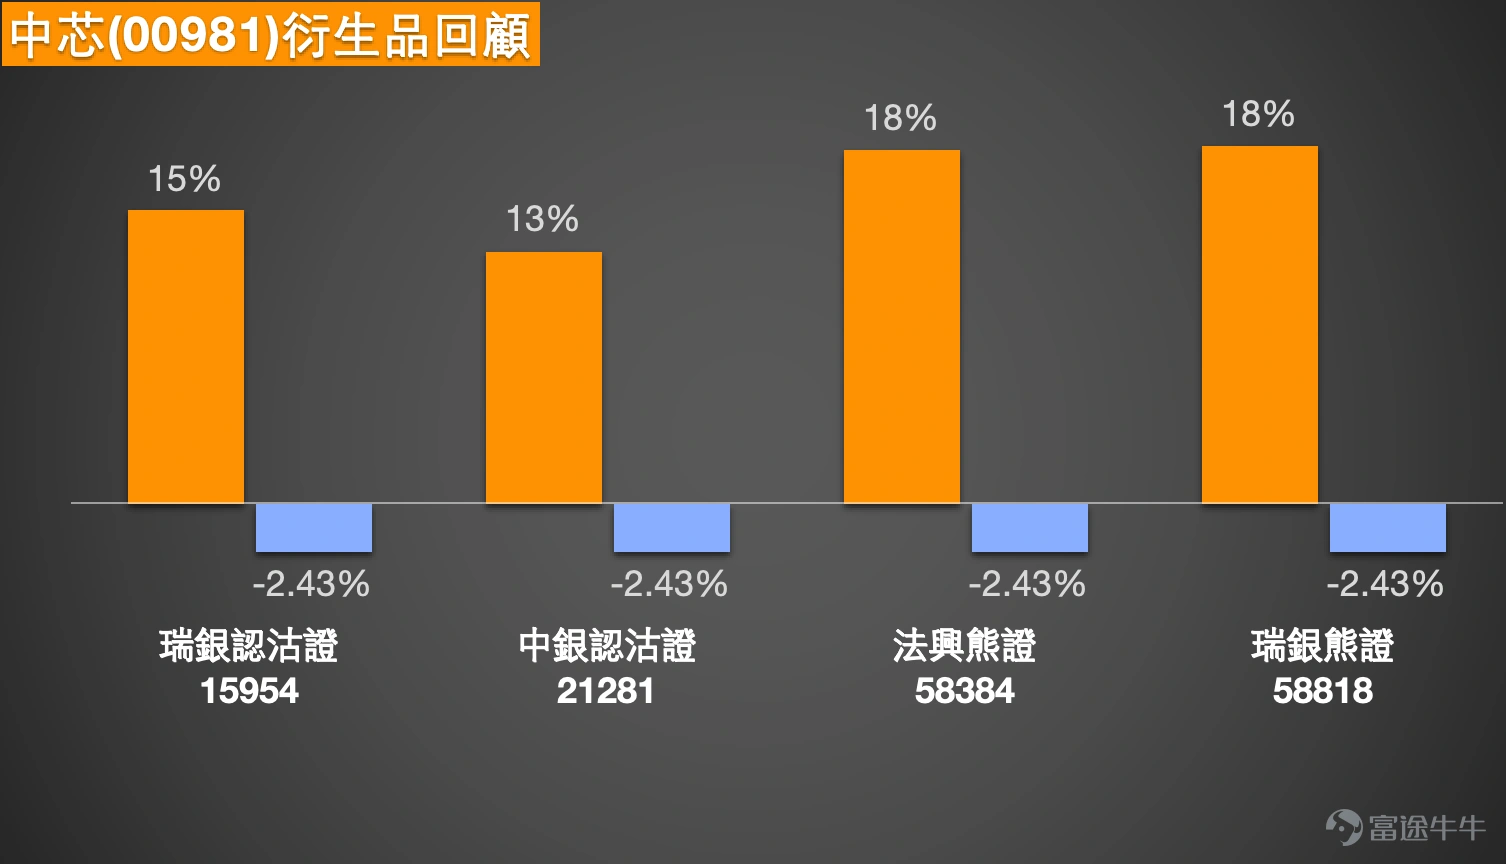
Overall, SMIC is still in the recovery phase after a medium-term correction. The most important support level on the chart is 58.30, while 64 yuan remains the key resistance for the short-term direction. As long as the stock price doesn’t break above 64 yuan, the market will likely remain in a range-bound consolidation. Thus, short-term operations should focus on observing the support levels rather than chasing the price during the rebound.$UB-SMIC@EP2606A.P (15954.HK)$$BI-SMIC@EP2606A.P (21281.HK)$$SG#SMIC RP2812V.P (58384.HK)$$UB#SMIC RP2812D.P (58818.HK)$
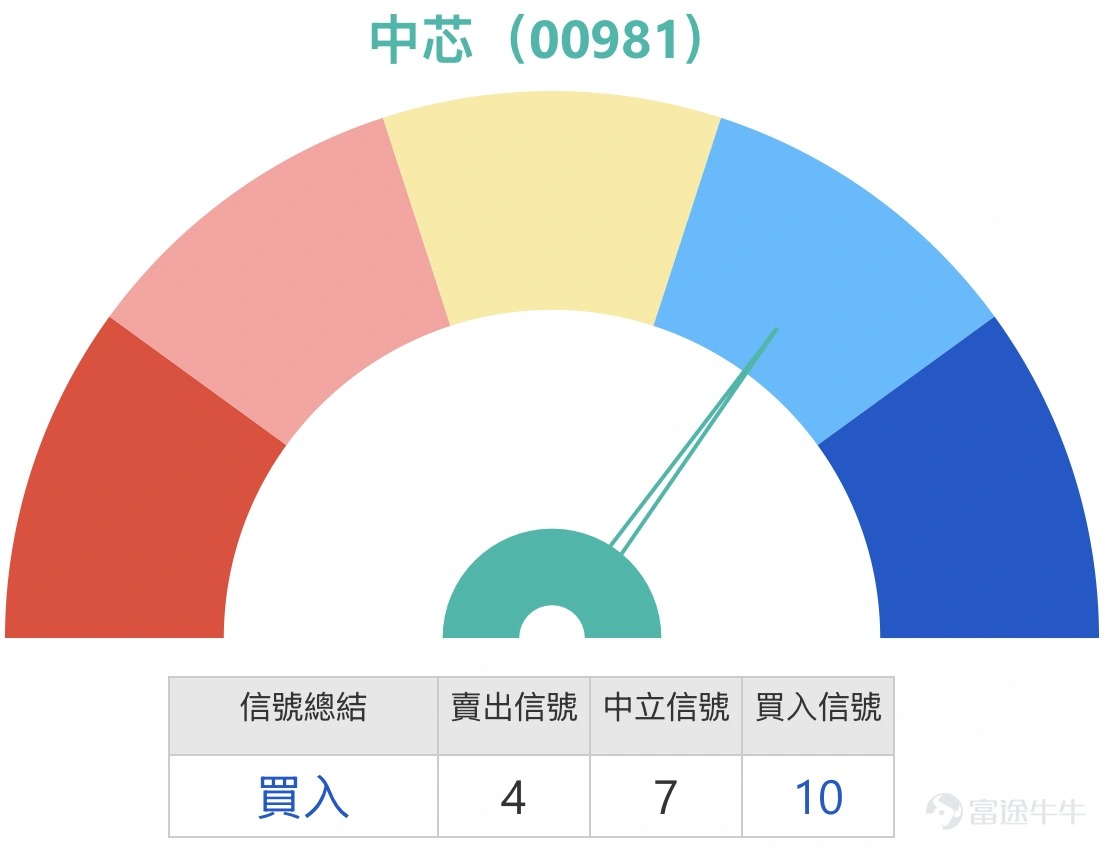
From the perspective of the daily chart, JD.com's overall structure is still in a technical recovery phase following a medium-term pullback. The chart shows that the stock previously tested around 120.40, but then gradually declined, breaking below several medium- and short-term moving averages, forming a relatively clear downtrend. Subsequently, the stock continued to fall to about 95.90, where it formed a阶段性低位 (stage low), and has since started to rebound. Currently, the stock has recovered to approximately 109.60. Judging by the pattern, the recent movement belongs to a bounce from the lows, but overall it hasn't fully returned above the major moving averages, so it still represents a rebound recovery rather than a full trend reversal.
Observing the moving average structure, the short-term 5-day line has clearly turned upward and is now close to the stock price, while the 10-day line is also gradually rising. However, the 20-day and 30-day lines are still above the stock price, indicating that the market is transitioning from weakness to stabilization. This arrangement of moving averages typically signifies improving short-term momentum, but a true medium-term strengthening would require a breakout above the pressure zone created by these moving averages.
On the support side, the short-term area to watch first is around 107 to 106 yuan, which is near the consolidation platform during the recent rebound and also close to where the short-term moving averages are operating. As long as the stock price stays above this zone, the short-term rebound structure can be maintained. The next key support level is around 104 yuan, an important retracement area after the rebound began. If the stock falls below 104 yuan, the short-term upward momentum will weaken significantly. The more crucial medium-term support is the previous low at 95.90; if the price approaches this area again, the overall correction pattern may widen once more.
On the resistance side, the immediate area to watch is around 112 to 113 yuan, which is near the middle Bollinger Band and where several short-term moving averages converge. Thus, the stock may face some resistance when rebounding to this zone. If it can break through and stabilize above this area, the next significant resistance will be around 116 to 118 yuan, followed by the previous high near 120 to 120.40 yuan, which is currently the most important medium-term resistance level on the entire chart.
Regarding investors' question: "The trend still looks solid—will it break 120 first?" From the current chart structure, the stock has indeed formed a continuous rebound from the low of 95.90, and short-term momentum has improved. However, multiple resistance levels must be overcome before reaching 120. Technically, to challenge 120, the stock would first need to break through 112 to 113 yuan, and then push past the 116 to 118 yuan area. Only when the stock gradually breaks through these resistances with supportive trading volumes does the market stand a chance to retest the 120 yuan mark. Therefore, based on the current structure, the stock is more likely to test the 112 to 116 yuan range first, with 120 being a target to monitor in the next phase.
For investors holding call warrants with a strike price of 122 yuan, the current stock price is around 109.60, still a certain distance from 122 yuan, so these products remain out-of-the-money structures. Even if the stock price rebounds in the short term to around 112 yuan or 116 yuan, there is still a gap from the 122-yuan strike price. Therefore, these call warrants are more aggressively positioned and require a sustained upward movement in the stock price gradually approaching the region above 120 yuan before their sensitivity begins to significantly increase.
In terms of short-term trading strategies, the currently reasonable observation range remains the support zone between 107 yuan and 106 yuan. If the stock price retraces to this area but can stabilize and break through the 110 yuan to 112 yuan region again, the short-term rebound may continue, with targets first at 112 yuan to 113 yuan, then near 116 yuan. Conversely, if the stock price falls below 107 yuan and retreats below 104 yuan, it would indicate weakening short-term rebound momentum, and the stock price might return to a consolidation pattern.
Overall, JD.com's current technical pattern is in the stage of a low-level rebound recovery, with short-term momentum improving but yet to break through key resistance areas. The vicinity of 107 yuan represents crucial short-term support, while the 112 yuan to 113 yuan range serves as a recent directional boundary. If the stock price can gradually surpass 112 yuan and 116 yuan, the market will have the opportunity to challenge the 120 yuan mark again; otherwise, it may continue to consolidate within the 104 yuan to 113 yuan range in the short term. For investors holding call warrants with a strike price of 122 yuan, the key is to observe whether the stock price can progressively break through the aforementioned resistance zones, as only when the stock price approaches the 120 yuan level will the sensitivity and trading value of such out-of-the-money call warrants begin to significantly rise.$BIJDCOM@EC2605A.C (23759.HK)$$MSJDCOM@EC2605A.C (23434.HK)$$JP#JDCOMRC2609B.C (55465.HK)$$SG#JDCOMRC2705B.C (55715.HK)$


Based on observations of the daily chart trend, China National Offshore Oil Corporation (CNOOC) has recently exhibited a rather clear uptrend. The chart shows that after forming a local low around 19.92, the stock price began a gradual ascent, subsequently advancing along multiple short-term moving averages, with the price structure rising step by step from lower levels. Recently, the stock price further broke through the previous consolidation zone, rising to approximately 29.76, while the chart also indicates a recent high around 29.92, showing that the uptrend is continuing.
In terms of the moving average structure, the 5-day, 10-day, and 20-day moving averages are all clearly aligned upwards, with the stock price steadily running above the short-term moving averages, reflecting that the short-term trend remains strong. Longer-term moving averages like the 30-day and longer-period ones are also gradually trending upwards, indicating that the overall intermediate-term trend continues to be bullish. Technically, this arrangement of multiple moving averages sloping upwards with prices trading above them usually signifies that the market is still in a trending phase.
In terms of support levels, the short-term focus should first be on the region near 28.70 to 28.30, which is close to the recent consolidation zone following the breakout and aligns with the operating regions of the 5-day and 10-day moving averages. As long as the stock price can remain above this zone, the short-term uptrend can continue. The next level of support is near 27.80, close to the 20-day moving average position and also the area of previous price consolidation. A breakdown below this level could notably slow down the short-term uptrend.
Regarding resistance, based on the current chart structure, the 30-yuan mark will be the first psychological resistance zone since the stock price is now nearing this integer threshold, and the recent high around 29.92 is also close to this area. If the stock price can effectively break through 30 yuan and stabilize above it, the upward trend may extend further, potentially opening up more upside space.
Concerning investors' comments about the "situation developing and the stock continuing to rise next week with a target of 35," from the perspective of the current chart structure, the stock price is indeed in a strong upward channel, and short-term momentum persists. However, as seen in the chart, the stock price has just approached the 30-yuan mark and remains a significant distance from 35 yuan, with multiple technical consolidations likely to occur in between. Therefore, from a technical standpoint, the immediate focus should be on whether the stock can stabilize above 30 yuan and maintain its uptrend. Only when prices consistently reach higher highs with corresponding trading volume will the market gradually raise expectations for higher target zones.
As for investors who choose to deploy bear certificates in the opposite direction, with a stop-loss level at 31 yuan, from the current technical structure, this stop-loss level is actually not far from the current price of approximately 29.76. Since the stock price is still in an upward trend, if the market continues its rise and breaks through the 30-yuan mark, the risk of moving closer to 31 yuan will increase. Therefore, deploying bear certificates during an uptrend would subject investors to relatively higher short-term volatility risks, especially when the trend remains upward.
Regarding short-term trading strategies, if the stock price can find support in the range of 28.70 to 28.30 and break above the recent high of 29.92 again, the short-term uptrend may continue, with the first key resistance level observed at 30 yuan. If it breaks through and stabilizes above 30 yuan, the market could potentially advance further. Conversely, if the stock price falls below 28.30 and gradually retreats to around 27.80, it would indicate that the short-term uptrend is losing momentum, and the stock might enter a consolidation phase.
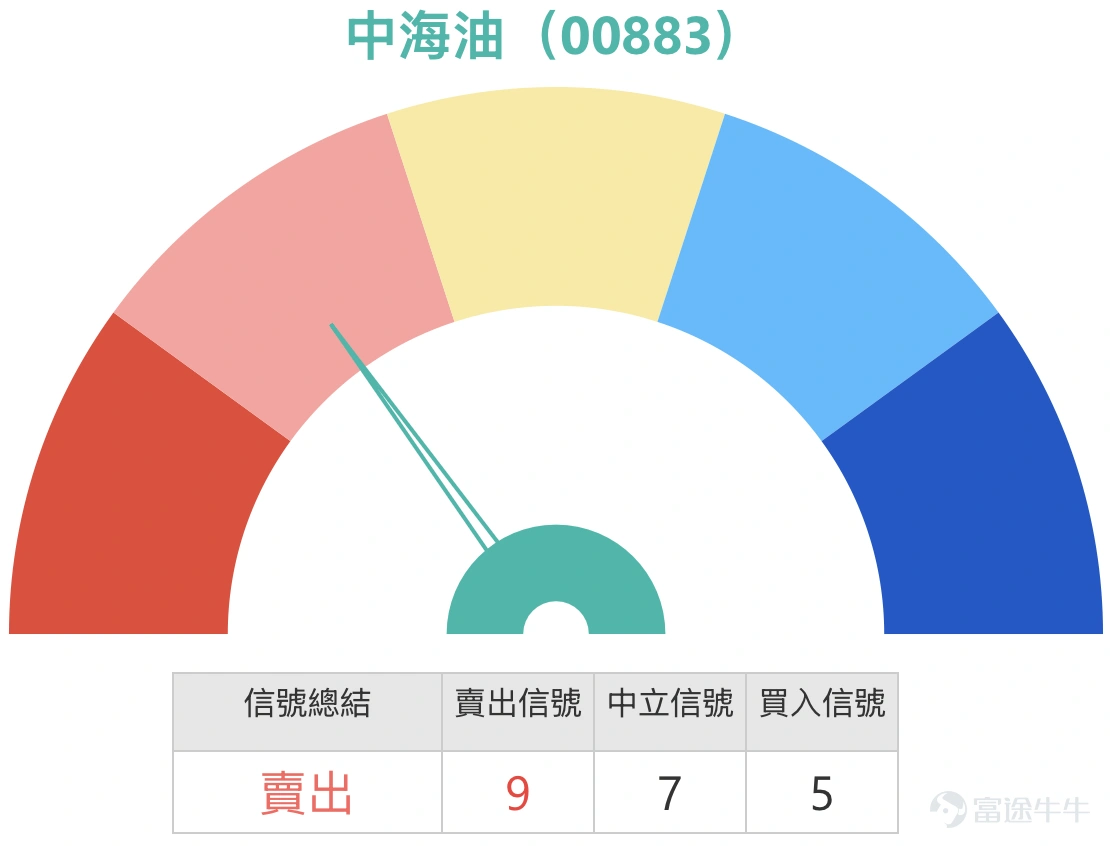
Overall, CNOOC’s current technical trend remains in an ascending structure, with short-term moving averages aligned upwards, indicating that the market is still within a trending phase. The area near 28.30 serves as important short-term support, while the range between 29.92 and 30 yuan represents the current key resistance zone. A breakout above 30 yuan could extend the uptrend; however, a failure to hold above 28 yuan might lead to a consolidation period at higher levels. For the market where both bullish bets and bear certificate deployments coexist, the decisive factor still lies in whether the 30-yuan threshold can be broken, which will determine the short-term market direction. $BICNOOC@EC2607A.C (22522.HK)$$UBCNOOC@EC2605A.C (23036.HK)$$HS#CNOOCRC2807A.C (61829.HK)$

Reminder: This article does not constitute any investment advice.
This article is for reference only and does not constitute any investment advice. The market data, opinions, and analysis contained herein may change at any time without prior notice. We are not responsible for any loss or damage caused by reliance on the information in this article. Technical analysis only shows whether certain technical conditions are met; a comprehensive assessment of asset performance should combine other data and should not solely rely on this article to make trading decisions. Please note that past performance is not indicative of future results. Follow Jenny's insights on Hong Kong stock warrants for more professional analysis.
Risk Disclaimer: The above content only represents the author's view. It does not represent any position or investment advice of Futu. Futu makes no representation or warranty.Read more
Comments
to post a comment
7