
The United States and Iran are sticking to their respective positions—can peace talks proceed smooth

Options Sir Macro View | Oil Price Shock Reshapes Rate Cut Rhythm! Amid Midterms Crosscurrents, What Should You Do With S&P 500 Options?
After the conflict in the Middle East pushed up oil prices, the first reaction of the market was to trade on 'reflation risk,' causing expectations for interest rate cuts to be quickly squeezed, with yields on two-year US Treasuries surging significantly. Growth stocks and high-valuation sectors were hit the hardest. However, if persistently high oil prices further erode consumer spending and corporate profits, the market will subsequentlyshift towards trading on slower growth or even recession risks, at which point the logic for rate cuts may return.。
For the S&P 500, the disruption caused by the Middle East conflict has brought forward and amplified the pullback that typically occurs during midterm election years; for the Nasdaq, it represents a stress test for interest-rate-sensitive assets in a high oil price environment.
Oil prices have rewritten interest rate expectations – will there still be rate cuts this year?
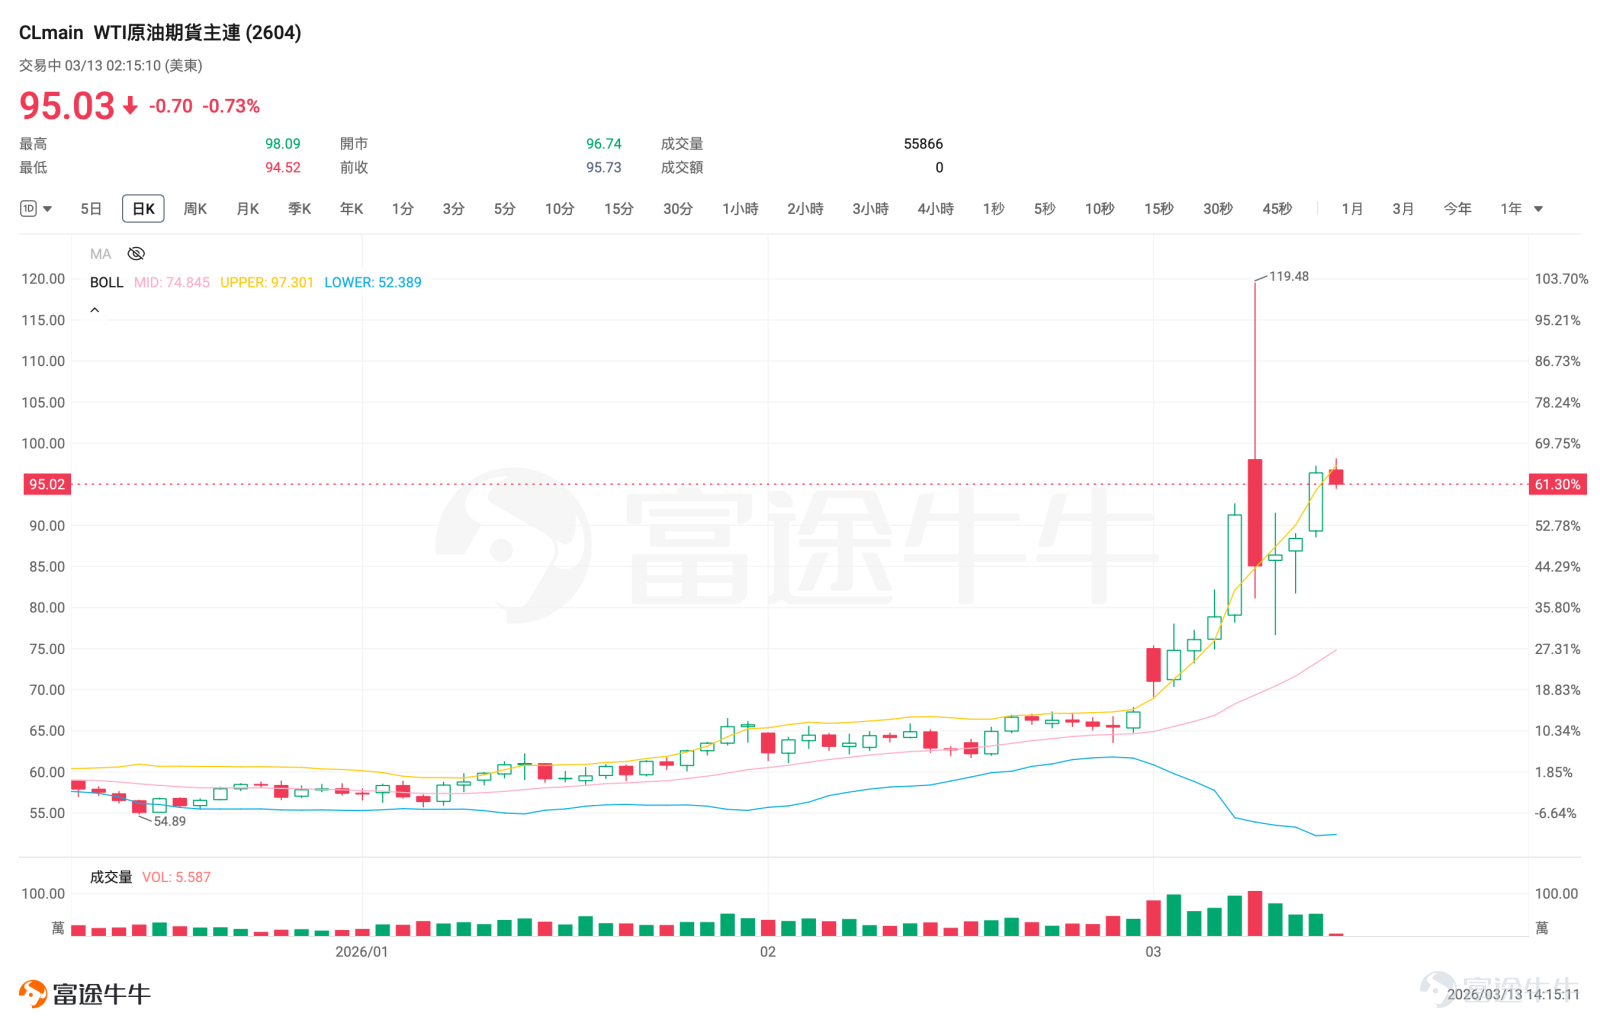
In terms of the latest oil prices, as of March 13,$Crude Oil Futures (AUG6) (CLmain.US)$WTI crude oil futures hovered around $95, a $30 increase from $65 before the Middle East conflict erupted just two weeks prior. More crucial is the official forecast: In the latest Short-Term Energy Outlook released by the EIA on March 10,Brent crude oil prices are expected to remain above $95 per barrel over the next two months, averaging about $91 per barrel in Q2 2026, before retreating to approximately $70 per barrel in Q4.This suggests that even if oil prices experience short-term fluctuations, it will be difficult for the market to immediately revert to the optimistic narrative of 'the oil price shock fading quickly.'

The rise in oil prices has directly compressed the space for rate cut trades. Market pricing shows thatthe probability of no rate cuts throughout 2026 has risen to 42%, with the 2-year US Treasury yield rising on Thursday to3.759%. In addition, Goldman Sachs has postponed its forecast for the Federal Reserve's first rate cut from June toSeptember, and expects only two 25-basis-point rate cuts in 2026, occurring inSeptember and December. The market's current pricing for a September rate cut is only about 34%. This means that 'at least one rate cut' is no longer the default assumption in the market.

The reason for the growing divergence in the market lies in the fact that this round of oil price shocks is more like a supply-side shock, which not only pushes up inflation but also simultaneously suppresses growth. BLS data shows that US nonfarm payrolls fell by 92,000 in February, with an unemployment rate of 4.4%; CPI was 2.4% year-on-year in the same month, core CPI was 2.5% year-on-year, and core CPI was only 0.2% month-on-month. In other words, the current environment in the US is not the kind of 'extremely strong demand, extremely hot employment, and persistently high core inflation' seen in 2022, but rather signs of weakening growth and slowing employment have emerged.
This is also the most critical point of contention for the Federal Reserve at present:In the short term, rising oil prices have heightened concerns about inflation, delaying expectations for interest rate cuts; in the medium term, if high oil prices persist, pressure on growth and employment could re-intensify calls for monetary easing.
According to the latest survey of economists by the media, although interest rate futures have pushed back the timing of the first rate cut, most surveyed economists still expect it to occur in June. In other words, the divergence between the market and economists essentially boils down to whether this cycle will initially manifest as an 'inflation issue' or quickly evolve into a 'growth issue.' Expectations regarding the timing of rate cuts are likely to fluctuate as more economic data and oil price movements emerge.
Historically, how has the S&P performed during midterm election years?
As the chart shows, during midterm election years, the S&P 500 often experiences a significant pullback at some point during the year. Statistics in the chart indicate that since1950, the average drawdown for the S&P from the beginning of the year to Election Day in midterm election years has been approximately 16.2%.The average return in the year following the election is roughly 18.8%; another chart shows that the average intra-year drawdown during midterm election years is around 18%.

External research also yields similar conclusions. Based on data since 1930, Capital Group found that the average return of the S&P 500 during midterm election years is only 4.7%, significantly lower than the 9.5% seen in non-midterm election years. Since 1970, the median volatility in midterm election years has been close to 16%, higher than the 13% observed in other years. However, since 1950, the average return for the S&P in the year following midterm elections has reached 15.4%. This suggests that the more common trajectory in midterm election years is not a one-sided bear market but rather an initial period of painful pullbacks and volatility expansion, followed by recovery once uncertainty subsides.

In the current context, the oil price shock seems to have brought this trajectory forward and amplified its effects. In other words, the current downturn does not necessarily mean a complete reversal of the S&P’s annual logic, but it does increase the probability of a scenario where valuations are hit first and risk appetite is suppressed earlier in the year.
SPY, QQQ Options Strategy Focus
From an industry structure perspective, $SPDR S&P 500 ETF (SPY.US)$ The internal sectors of energy, value, and defense provide a buffer, making it more akin to 'a pullback within a high-level wide-range consolidation'; whereas $Invesco QQQ Trust (QQQ.US)$ There is a stronger focus on technology and long-duration assets, which are more sensitive to interest rates, risk appetite, and valuation compression. Therefore, under the chain reaction of 'rising oil prices—delayed rate cuts—upward yield movement,' they typically face greater pressure.
The current options pricing environment also shows that it is not suitable to express views using overly aggressive one-sided bets. On March 12, the VIX closed at 27.29, already in a significantly elevated range, indicating that the market has certain expectations for subsequent volatility. Trading-wise, it is more appropriate to use defined-risk spread structures rather than simply chasing naked long or short positions.
- Investors with existing positions: prioritize using SPY for portfolio hedging
If the core objective is to buy insurance for an entire US stock portfolio, SPY remains a more efficient tool. It is currently more suitable to choose protective put spreads expiring in 30 to 45 days: buying slightly out-of-the-money or at-the-money Puts while selling Puts with lower strike prices to reduce premium costs. If one does not mind temporarily giving up some upside potential, a Collar structure can be used to further compress insurance costs. The rationale is that the primary risks currently stem from macro and index levels, rather than individual stocks.
– To express a bearish view: QQQ is more suitable as a directional tool
If it is determined that high oil prices will continue to delay rate cuts and suppress valuations in the tech sector, then QQQ is more suited than SPY to express this direction. A more prudent approach is not to directly buy deep out-of-the-money Puts but to adopt a Bear Put Spread expiring in 30 to 45 days: for example, buying Puts while selling Puts with even lower strike prices. This strategy helps mitigate time decay losses and implied volatility pullback risks faced by outright Put purchases, especially in the current environment where volatility has significantly risen.

- If it is judged that the market will later shift toward 'recession/rate-cut trading'
If two signals appear subsequently—oil prices no longer continuing to rise, and the 2-year US Treasury yield peaking and retreating—then the market may shift from 'fearing re-inflation' to 'worrying about growth slowdown.' In such a scenario, it may be worth considering bullish call spreads expiring in 45 to 75 days, but this type of strategy is better deployed in batches rather than placing heavy bets all at once.
The three most crucial threads to monitor going forward
First, whether oil prices can once again move away from the near-$100 high. If crude oil remains persistently at a high level, the market will still prioritize trading around reflation and profit compression. Second, whether the 2-year U.S. Treasury yield continues to rise. This is the most direct price signal that expectations of rate cuts are being pushed further out. Third, whether U.S. employment and consumption data continue to weaken. If subsequent data keeps confirming a cooling in growth, then the currently compressed rate cut expectations may eventually return as the main market theme at a later stage.
The essence of this round of market volatility is that the oil price shock first forced the market to withdraw overly optimistic rate cut pricing. However, the challenge with supply shocks is that they don’t just remain at the inflation level; ultimately, they will also erode growth and risk appetite.
Therefore, a more reasonable interpretation for the S&P 500 in the 2026 midterm election year isn't simply bearishness but rather accepting a more typical path:Volatility, pullbacks, and then waiting for clearer policy and growth signals to find the next window of opportunity with better cost performance.In this process, SPY is more suitable for portfolio hedging, while QQQ is better suited for expressing directional views.
Risk Disclaimer: The above content only represents the author's view. It does not represent any position or investment advice of Futu. Futu makes no representation or warranty.Read more


Comments
to post a comment
14
10