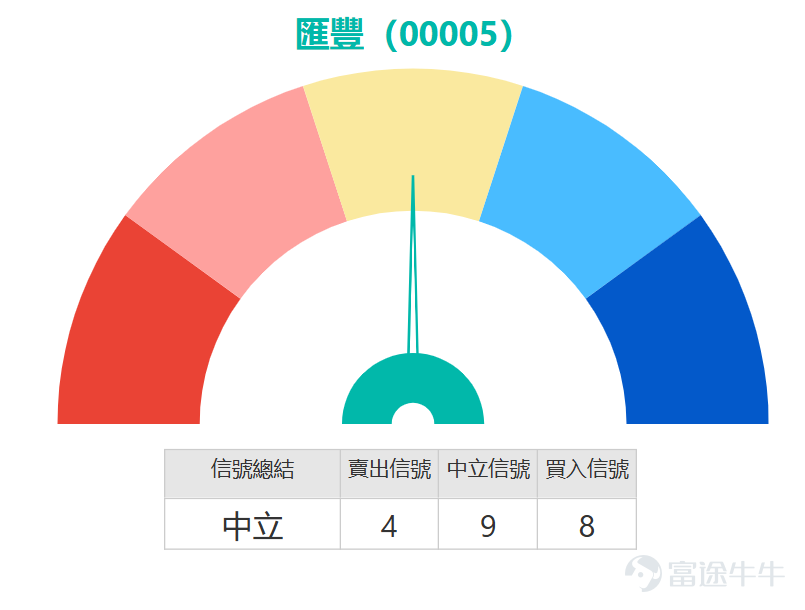

HSBC's stock price hits a monthly low. Has the decline bottomed out or is there still room to fall?
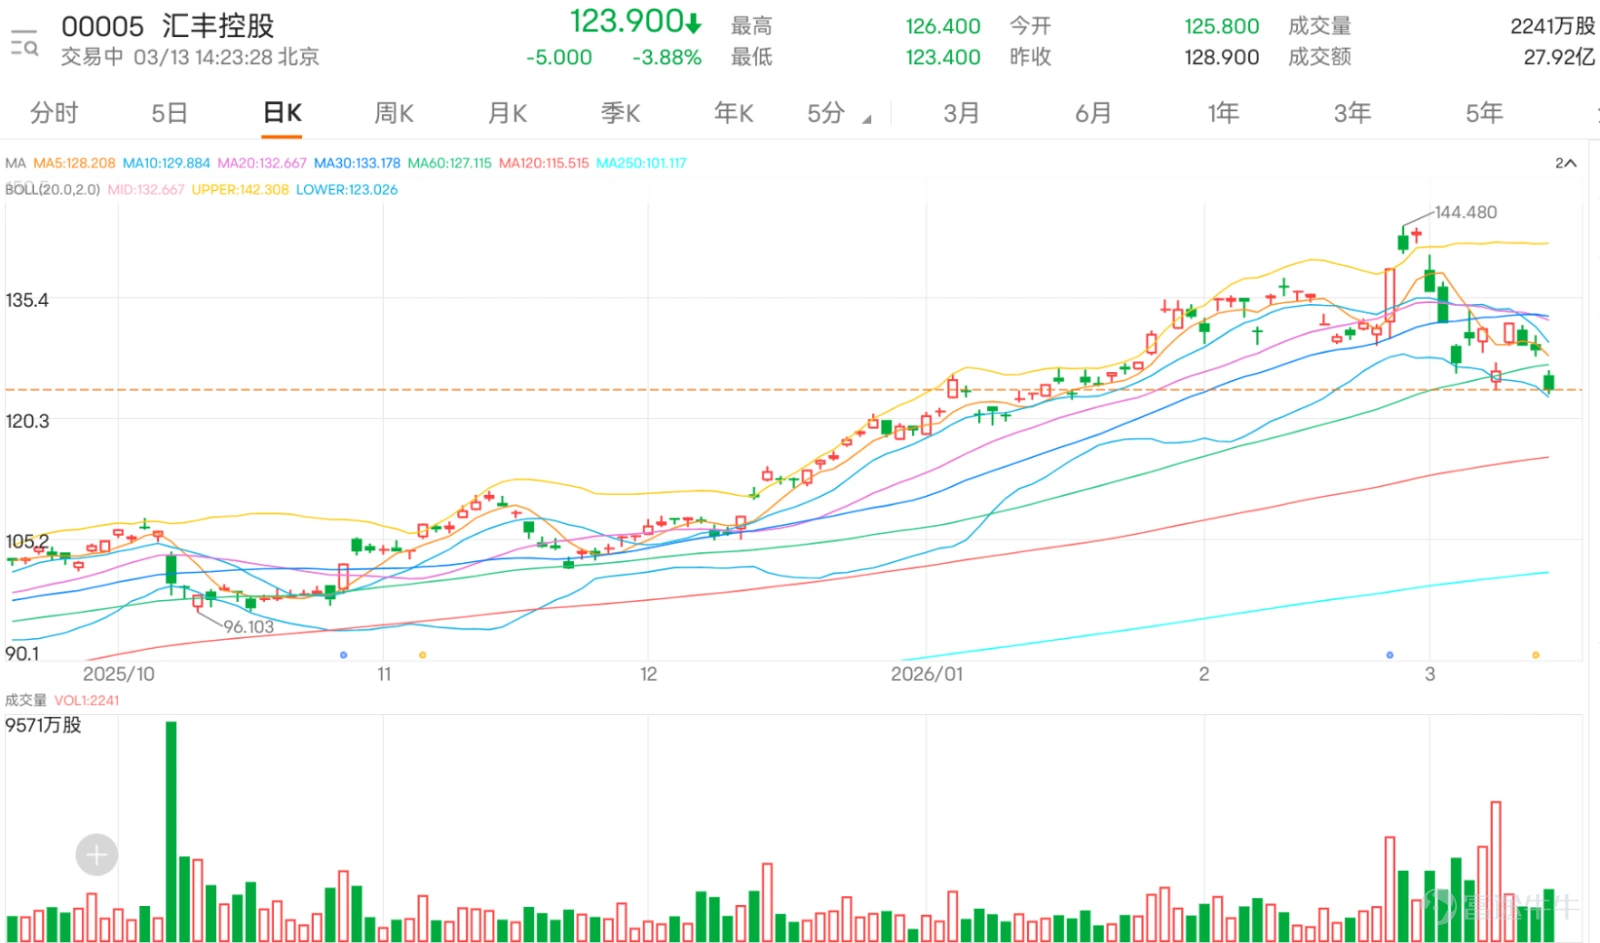
$HSBC HOLDINGS (00005.HK)$ Dropping nearly 4%, the intraday low reached HK$123.4, creating a one-month low. From a short-term technical perspective, HSBC’s current price has fallen below several key moving averages, including the 10-day MA at HK$132.71, the 30-day MA at HK$136.47, and is lower than the 60-day MA at HK$130.52, reflecting that the stock is in a weak pattern with a bearish short-term trend. However, multiple technical indicators are showing oversold conditions, which may suggest a rebound opportunity is brewing.
In the current trend, HSBC’s 5-day volatility has reached 9.8%, indicating increased volatility, which usually comes with directional choices. Observing technical signals, the stochastic oscillator has entered the oversold zone and issued a buy signal, suggesting that selling pressure may have been excessive in the short term, potentially triggering a technical rebound. The Relative Strength Index (RSI) is at 39, signaling neutrality, reflecting strong downward momentum but not yet extreme. CCI is also neutral, while Williams %R shows an oversold condition but remains neutral. These mixed signals from oscillators indicate divergent market sentiment, possibly leading to a consolidation phase in the short term. Additionally, both MACD and Bollinger Bands are issuing sell signals, pointing to a weaker trend, but the VR trading ratio indicator shows a buy signal, combined with increased trading volume, implying possible buying interest at lower levels.
In terms of support and resistance levels, HSBC's first support level is at HK$120.1, followed by the next support at HK$109, which will be the key defense line for short-term declines; the first resistance level is at HK$133.2, the primary challenge for a short-term rebound. A breakthrough would further open up upward potential, with the second resistance level located at HK$141.2, a medium-term strong pressure area that requires high-volume breakout to confirm a strengthening trend. There is a 55% probability of an upward move, but this needs to be verified through technical indicators. In a comprehensive analysis, although HSBC has broken below moving averages and multiple trend indicators like MACD are bearish, the oversold buy signals from the stochastic oscillator, along with Williams %R showing oversold status, provide a technical basis for a short-term rebound. However, investors should note that resistance near HK$133.2 overlaps with moving averages, forming strong pressure. If it cannot break through, the stock price may retest support levels.
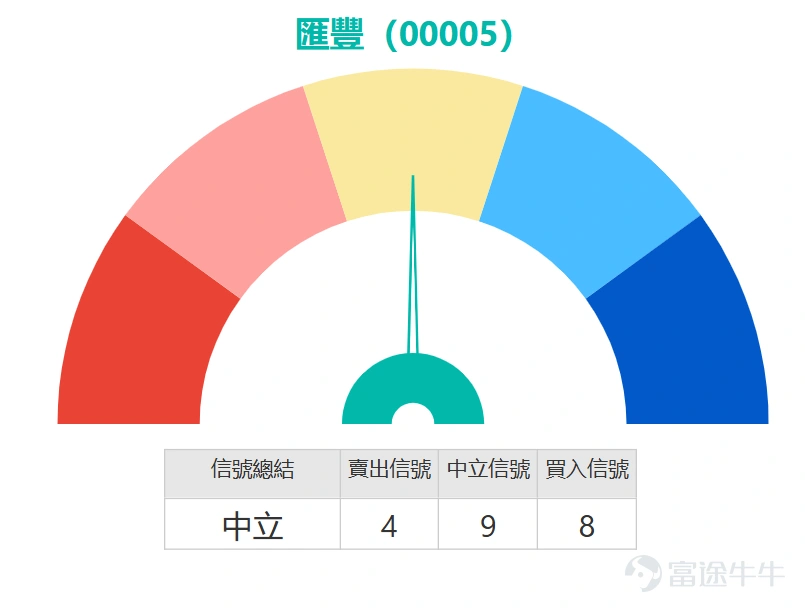
As mentioned on March 11, two days later, HSBC shares fell cumulatively by 6.77%, driving related inverse products significantly higher: $UB#HSBC RP2702A.P (59897.HK)$ Surging 29%, $BI-HSBC@EP2607B.P (25733.HK)$ Surging 34%, the rest of the bear contracts and put warrants also generally rose by 23%-27%, fully demonstrating the high elasticity hedging value of derivatives in a downward market.

HSBC derivatives market analysis: The call warrant with the most concentrated trading is in the exercise price range of 148-160 yuan, accounting for 56% of the total trading volume of call warrants. These products are moderately out-of-the-money with an out-of-the-money range of 19%-29%, offering actual leverage of 7-15 times, implied volatility range of 31%-34%, and expiration dates mostly within 3-9 months, making them the core choice for bullish investors betting on a medium-term rebound. Put warrant trading is concentrated in the exercise price range of 111-112 yuan, accounting for 42% of the total put warrant trading volume. The corresponding products are only 9.7%-9.9% out-of-the-money, offering actual leverage of 5.6-6 times, average implied volatility of 32.65%, and expiration dates mostly over 6 months, providing balanced cost-effectiveness suitable for bearish investors positioning for short-term downward moves.
In terms of bull and bear contracts, the most concentrated trading for bull contracts is in the forced-call price range of 100-105 yuan, accounting for 58% of the total bull contract trading volume. These products have a forced-call distance of 15%-19% while offering actual leverage of 5.5-7 times. The most active trading for bear contracts is in the forced-call price range of 137-140 yuan, accounting for 62% of the total bear contract trading volume, with corresponding products having a forced-call distance of 10%-13% and actual leverage of 7-9 times, making them the preferred choice for short-term bearish funds.
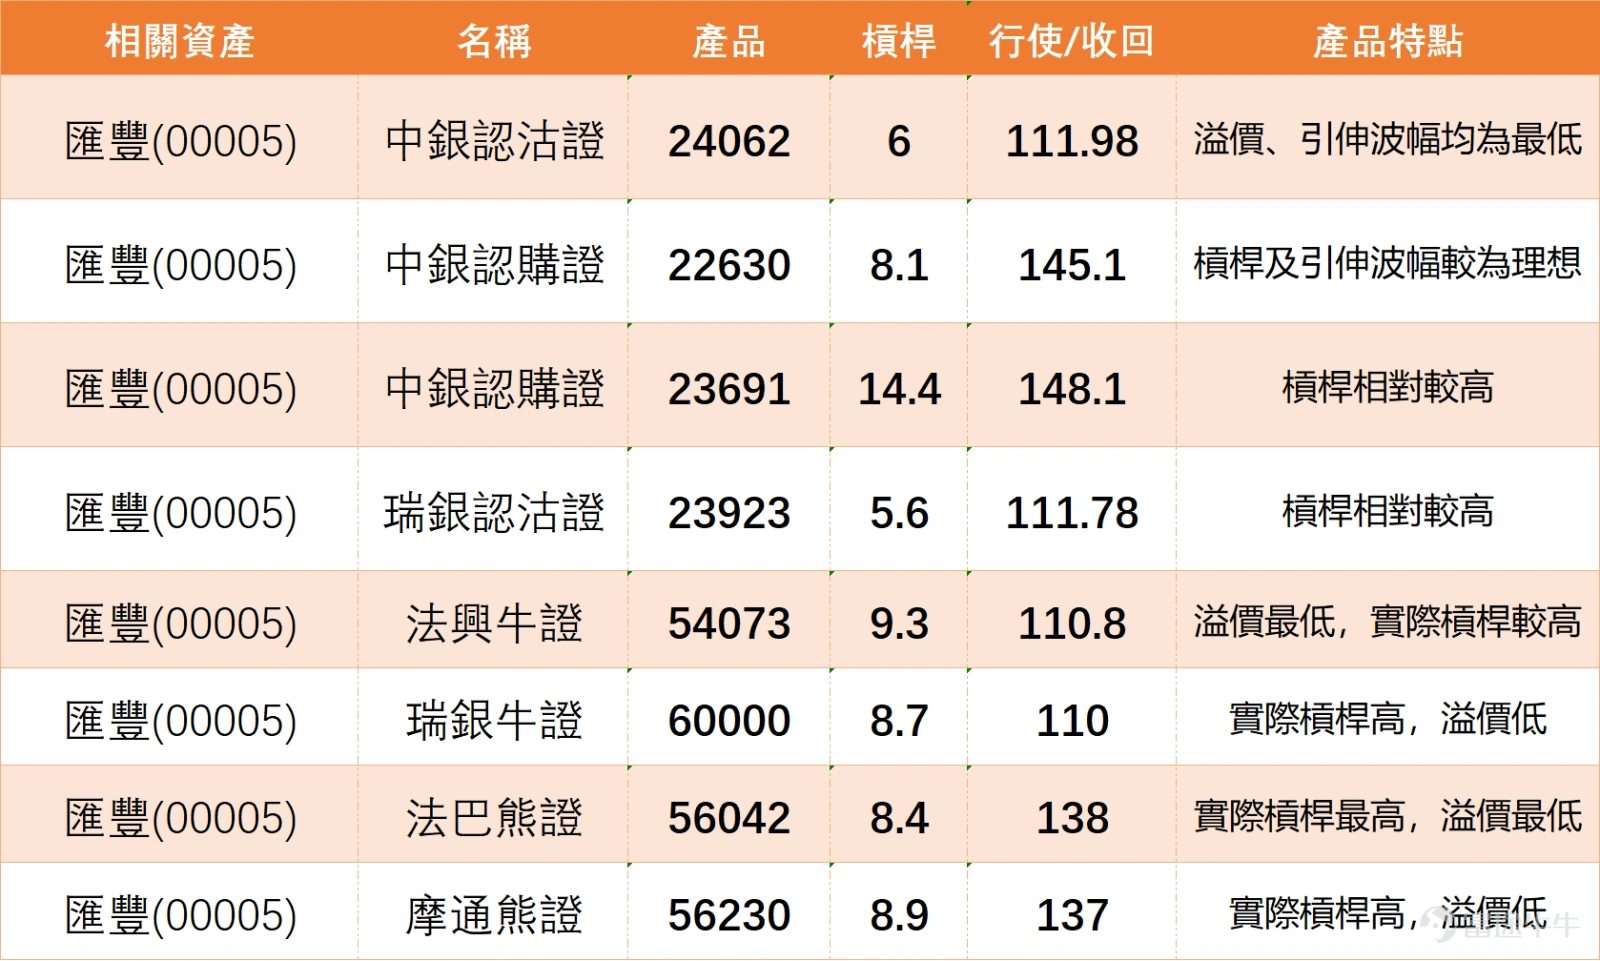
For the selected products targeting HSBC Holdings (00005), they cover four types of products: call warrants, put warrants, bull contracts, and bear contracts to meet investment needs based on different market views. First, regarding call warrants, $BI-HSBC@EC2609B.C (22630.HK)$ with an exercise price of 145.1 yuan and leverage of about 8.1 times, its leverage and implied volatility are relatively ideal, making it suitable for investors optimistic about HSBC's future performance; another one $BI-HSBC@EC2605A.C (23691.HK)$ with an exercise price of 148.1 yuan offers leverage of 14.4 times, which is relatively higher and can amplify potential returns. As for the put warrants, $BI-HSBC@EP2609A.P (24062.HK)$ with an exercise price of 111.98 yuan and leverage of 6 times, has the lowest premium and implied volatility, offering better cost efficiency; $UB-HSBC@EP2609B.P (23923.HK)$ with an exercise price of 111.78 yuan offers leverage of 5.6 times, which is relatively higher, providing an option for investors who are bearish on HSBC.
In the bull certificate section, $SG#HSBC RC2803D.C (54073.HK)$ with a forced-call price of 110.8 yuan and leverage of 9.3 times, has the lowest premium and relatively higher actual leverage, making it suitable for optimistic investors who want to control costs; $UB#HSBC RC2809G.C (60000.HK)$ with a forced-call price of 110 yuan and leverage of 8.7 times, offers high actual leverage and low premium, providing higher capital efficiency. As for the bear contracts, $BP#HSBC RP2701C.P (56042.HK)$The strike price is 138 yuan, with a leverage of 8.4 times; it offers the highest actual leverage and the lowest premium, making it suitable for investors who are bearish and seeking high leverage.$JP#HSBC RP2809B.P (56230.HK)$The strike price is 137 yuan, with a leverage of 8.9 times; it offers high actual leverage and low premium, providing another option for those with a bearish market outlook.
JPMorgan noted that HSBC (00005) and $STANCHART (02888.HK)$are the European banks with the largest exposure to Middle Eastern risk. Do you think now is the 'time to buy the dip' or a 'midway point in the decline'? Feel free to share your insights in the comment section. For more market analysis, stay tuned to Jenny's daily updates on 'HK Stock Warrants'!
Reminder: This article does not constitute any investment advice. It is for reference only and does not constitute investment advice. Market data, opinions, and analysis contained herein may change at any time without prior notice. We are not responsible for any loss or damage caused by reliance on the information in this article. Technical analysis only shows whether certain technical conditions are met; asset performance should be comprehensively evaluated with other data. Trading decisions should not be made solely based on this article. Please note that past performance is not indicative of future results.
#HongKongStocks #HangSengIndex #RealTimeAnalysis #WarrantsSelection #WarrantsStrategy #DerivativesHedging #HongKongWarrantsJenny #HSBC #00005 #InternationalFinancialStocks#$Hang Seng Index (800000.HK)$
Risk Disclaimer: The above content only represents the author's view. It does not represent any position or investment advice of Futu. Futu makes no representation or warranty.Read more

Comments
to post a comment
1