English
Back
Open Account
Earnings reports from Chinese giants raise concerns! Is it a good time to buy on dips?

米股研究
joined discussion · Mar 13 13:59 ·

Technical Analysis of Chinese Stocks (March 13): Alibaba/Baidu/Bilibili/Futu/PDD Holdings/Tencent Music/NetEase/JD.com/Tencent/Meituan/Kuaishou/Xiaomi

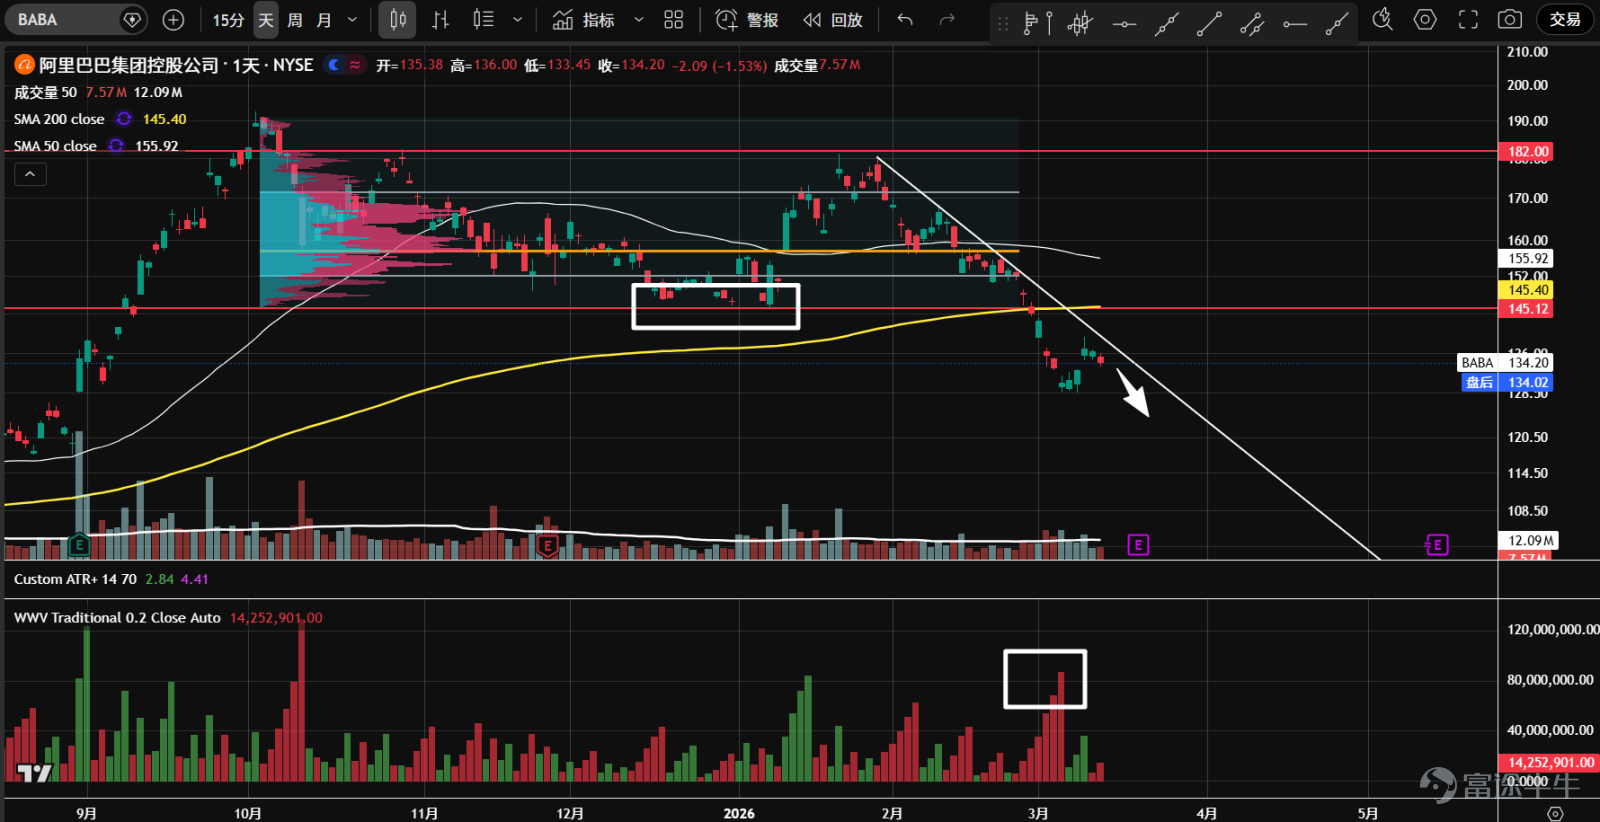
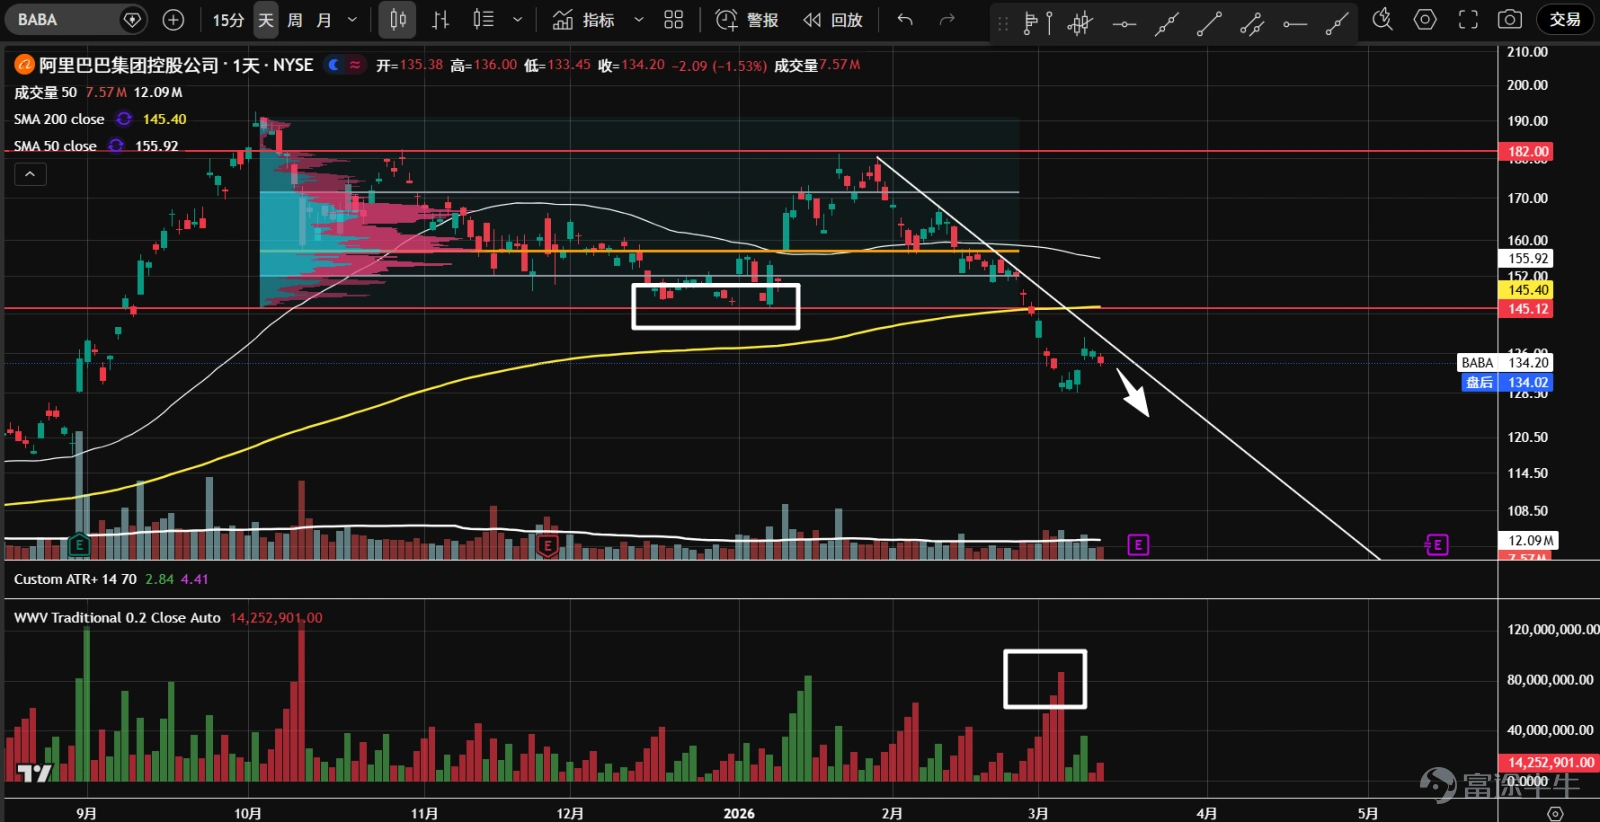
1、 $Alibaba (BABA.US)$The stock has been moving sideways since the end of January, when it retreated from its peak. The bearish price-volume cycle eventually led to a significant breakout below the support at 145 in early March, with deep declines and a high probability of an effective breakdown. A recent low-volume rebound shows insufficient demand, and resistance at the downtrend line suggests a potential continuation of the decline.
1、 $Alibaba (BABA.US)$The stock has been moving sideways since the end of January, when it retreated from its peak. The bearish price-volume cycle eventually led to a significant breakout below the support at 145 in early March, with deep declines and a high probability of an effective breakdown. A recent low-volume rebound shows insufficient demand, and resistance at the downtrend line suggests a potential continuation of the decline.  2、 $Baidu (BIDU.US)$The stock entered a sideways movement in October last year and retreated back into range after a false breakout in late January. The bearish price-volume cycle has left bullish rebounds weak. Currently near the volume control point (orange), no bottom-fishing should be considered until a new downtrend line is broken.  3、 $Bilibili (BILI.US)$The stock entered a sideways movement in October last year and retreated back into range after a false breakout in late January this year. Recently, panic selling appeared at the support level of 24.3 at the bottom of the range, currently undergoing a second test and heading towards the corner position while awaiting directional clarity.  4、 $Futu Holdings Ltd (FUTU.US)$The stock started moving sideways in August last year, forming a P-shaped volume distribution. In mid-February, it broke down significantly below the support line at 152.74, and even after half a month, it failed to recover, testing the support line with reduced volume. After the earnings report, a large bearish candlestick emerged on high volume, with the 50-day moving average crossing below the annual line, indicating a possible continuation of the downward trend.  5、 $PDD Holdings (PDD.US)$自2...
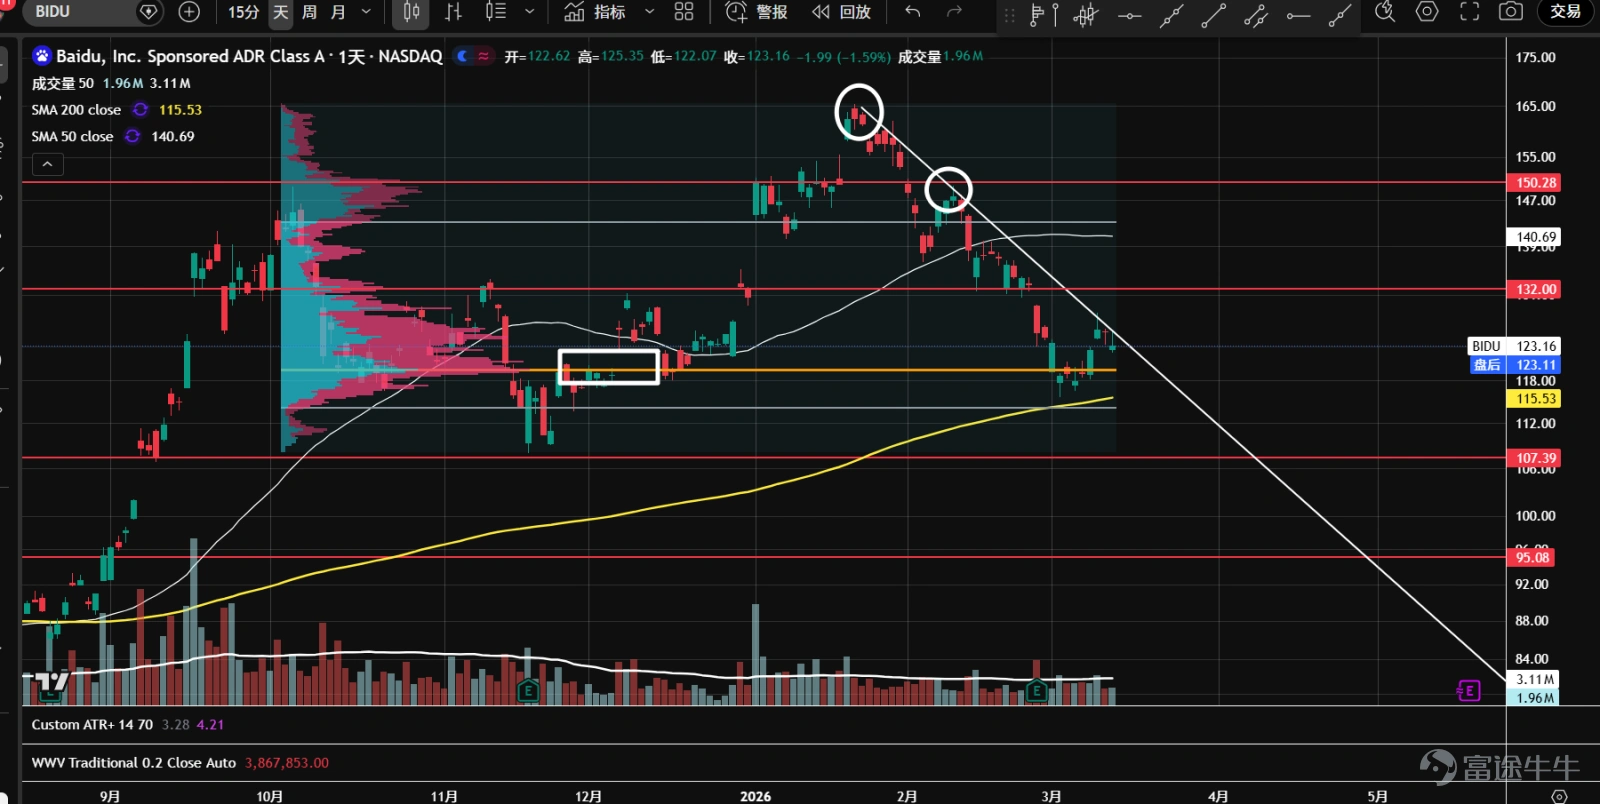
2、 $Baidu (BIDU.US)$The stock entered a sideways movement in October last year and retreated back into range after a false breakout in late January. The bearish price-volume cycle has left bullish rebounds weak. Currently near the volume control point (orange), no bottom-fishing should be considered until a new downtrend line is broken.
1、 $Alibaba (BABA.US)$The stock has been moving sideways since the end of January, when it retreated from its peak. The bearish price-volume cycle eventually led to a significant breakout below the support at 145 in early March, with deep declines and a high probability of an effective breakdown. A recent low-volume rebound shows insufficient demand, and resistance at the downtrend line suggests a potential continuation of the decline.  2、 $Baidu (BIDU.US)$The stock entered a sideways movement in October last year and retreated back into range after a false breakout in late January. The bearish price-volume cycle has left bullish rebounds weak. Currently near the volume control point (orange), no bottom-fishing should be considered until a new downtrend line is broken.  3、 $Bilibili (BILI.US)$The stock entered a sideways movement in October last year and retreated back into range after a false breakout in late January this year. Recently, panic selling appeared at the support level of 24.3 at the bottom of the range, currently undergoing a second test and heading towards the corner position while awaiting directional clarity.  4、 $Futu Holdings Ltd (FUTU.US)$The stock started moving sideways in August last year, forming a P-shaped volume distribution. In mid-February, it broke down significantly below the support line at 152.74, and even after half a month, it failed to recover, testing the support line with reduced volume. After the earnings report, a large bearish candlestick emerged on high volume, with the 50-day moving average crossing below the annual line, indicating a possible continuation of the downward trend.  5、 $PDD Holdings (PDD.US)$自2...
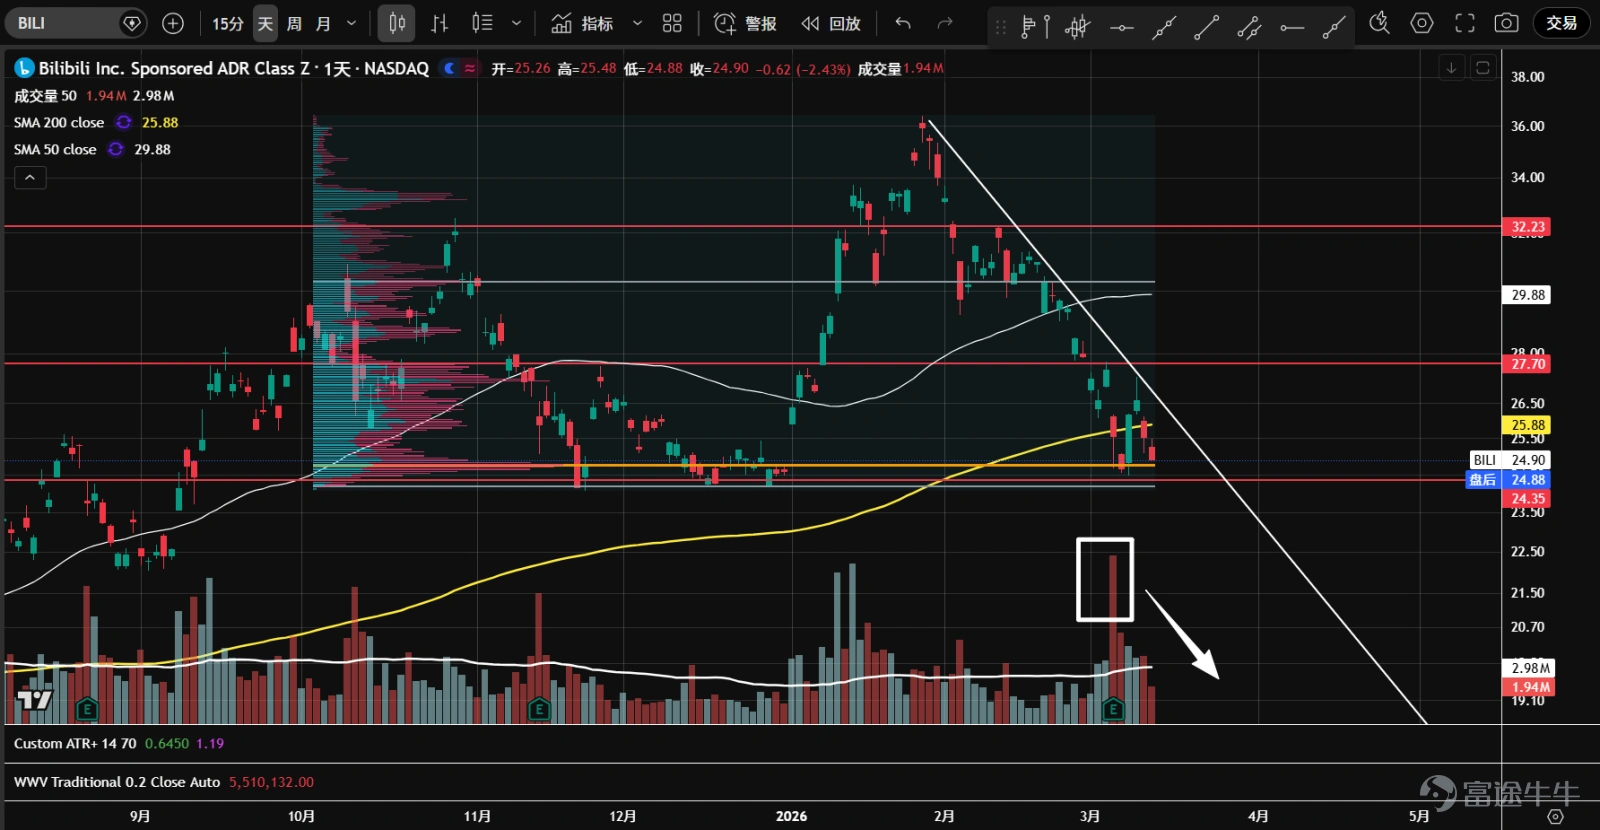
3、 $Bilibili (BILI.US)$The stock entered a sideways movement in October last year and retreated back into range after a false breakout in late January this year. Recently, panic selling appeared at the support level of 24.3 at the bottom of the range, currently undergoing a second test and heading towards the corner position while awaiting directional clarity.
1、 $Alibaba (BABA.US)$The stock has been moving sideways since the end of January, when it retreated from its peak. The bearish price-volume cycle eventually led to a significant breakout below the support at 145 in early March, with deep declines and a high probability of an effective breakdown. A recent low-volume rebound shows insufficient demand, and resistance at the downtrend line suggests a potential continuation of the decline.  2、 $Baidu (BIDU.US)$The stock entered a sideways movement in October last year and retreated back into range after a false breakout in late January. The bearish price-volume cycle has left bullish rebounds weak. Currently near the volume control point (orange), no bottom-fishing should be considered until a new downtrend line is broken.  3、 $Bilibili (BILI.US)$The stock entered a sideways movement in October last year and retreated back into range after a false breakout in late January this year. Recently, panic selling appeared at the support level of 24.3 at the bottom of the range, currently undergoing a second test and heading towards the corner position while awaiting directional clarity.  4、 $Futu Holdings Ltd (FUTU.US)$The stock started moving sideways in August last year, forming a P-shaped volume distribution. In mid-February, it broke down significantly below the support line at 152.74, and even after half a month, it failed to recover, testing the support line with reduced volume. After the earnings report, a large bearish candlestick emerged on high volume, with the 50-day moving average crossing below the annual line, indicating a possible continuation of the downward trend.  5、 $PDD Holdings (PDD.US)$自2...
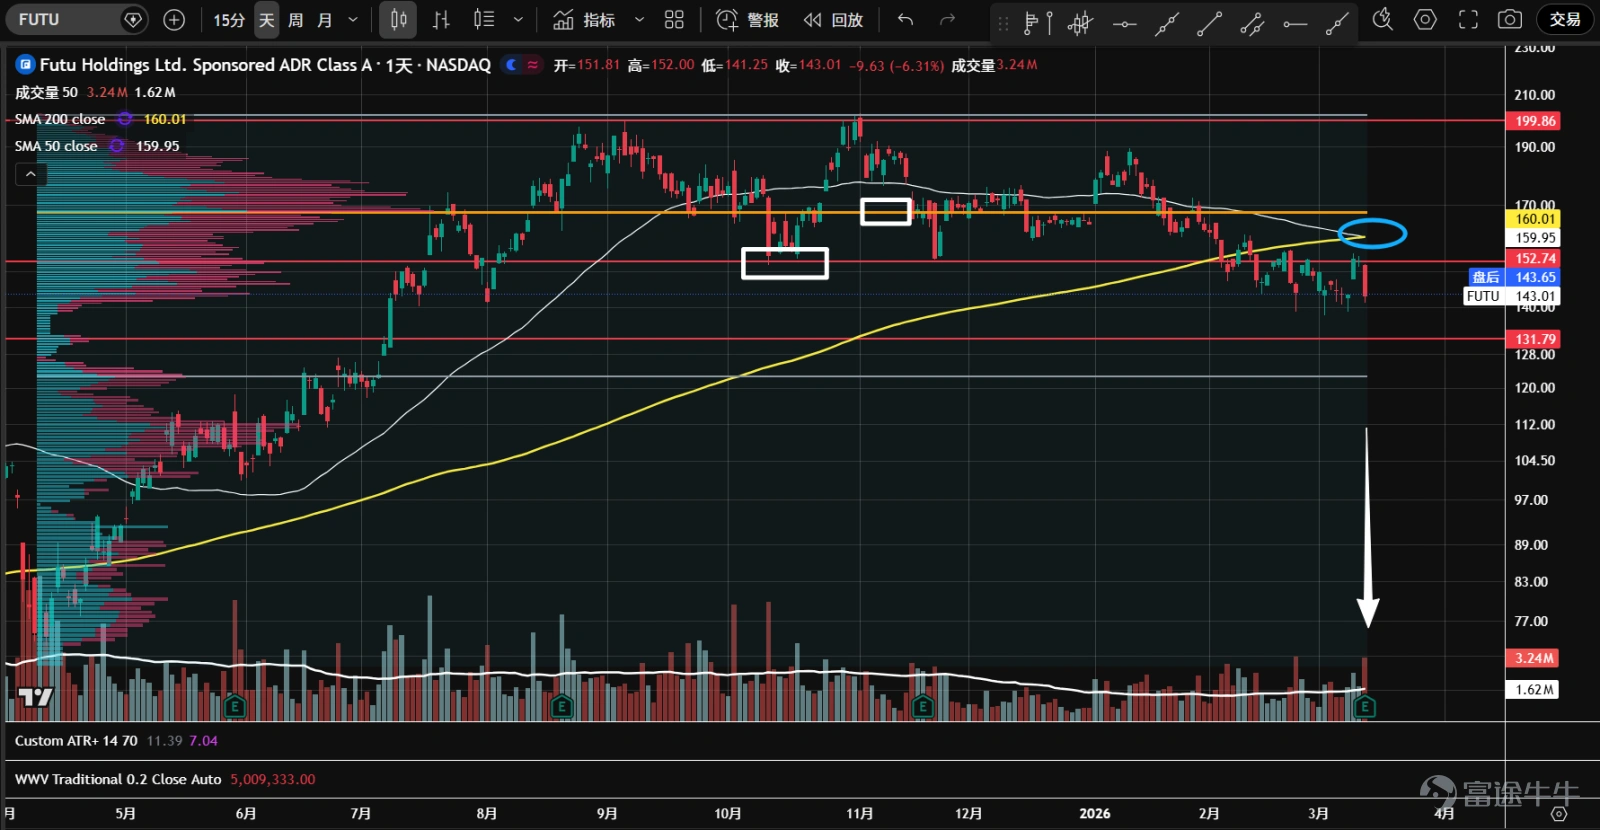
4、 $Futu Holdings Ltd (FUTU.US)$ The stock began consolidating with a sideways movement in August last year, forming a P-shaped volume distribution. In mid-February, it broke below the support level at 152.74 with high trading volume but failed to recover even after half a month. The volume contracted when testing this level. After the earnings report, a large bearish candle appeared with increased trading volume; the 50-day moving average crossed below the annual line, suggesting a possible continuation of the downtrend.
1、 $Alibaba (BABA.US)$The stock has been moving sideways since the end of January, when it retreated from its peak. The bearish price-volume cycle eventually led to a significant breakout below the support at 145 in early March, with deep declines and a high probability of an effective breakdown. A recent low-volume rebound shows insufficient demand, and resistance at the downtrend line suggests a potential continuation of the decline.  2、 $Baidu (BIDU.US)$The stock entered a sideways movement in October last year and retreated back into range after a false breakout in late January. The bearish price-volume cycle has left bullish rebounds weak. Currently near the volume control point (orange), no bottom-fishing should be considered until a new downtrend line is broken.  3、 $Bilibili (BILI.US)$The stock entered a sideways movement in October last year and retreated back into range after a false breakout in late January this year. Recently, panic selling appeared at the support level of 24.3 at the bottom of the range, currently undergoing a second test and heading towards the corner position while awaiting directional clarity.  4、 $Futu Holdings Ltd (FUTU.US)$The stock started moving sideways in August last year, forming a P-shaped volume distribution. In mid-February, it broke down significantly below the support line at 152.74, and even after half a month, it failed to recover, testing the support line with reduced volume. After the earnings report, a large bearish candlestick emerged on high volume, with the 50-day moving average crossing below the annual line, indicating a possible continuation of the downward trend.  5、 $PDD Holdings (PDD.US)$自2...
5、 $PDD Holdings (PDD.US)$ Since entering a broad consolidation range in 2024, the stock fell from its peak in November last year and is now oscillating within a narrow space bounded by the volume control point (orange), the axis line at 109.5 within the range, and a downward trendline. It is highly likely that it will continue to consolidate within this broader range going forward.
1、 $Alibaba (BABA.US)$The stock has been moving sideways since the end of January, when it retreated from its peak. The bearish price-volume cycle eventually led to a significant breakout below the support at 145 in early March, with deep declines and a high probability of an effective breakdown. A recent low-volume rebound shows insufficient demand, and resistance at the downtrend line suggests a potential continuation of the decline.  2、 $Baidu (BIDU.US)$The stock entered a sideways movement in October last year and retreated back into range after a false breakout in late January. The bearish price-volume cycle has left bullish rebounds weak. Currently near the volume control point (orange), no bottom-fishing should be considered until a new downtrend line is broken.  3、 $Bilibili (BILI.US)$The stock entered a sideways movement in October last year and retreated back into range after a false breakout in late January this year. Recently, panic selling appeared at the support level of 24.3 at the bottom of the range, currently undergoing a second test and heading towards the corner position while awaiting directional clarity.  4、 $Futu Holdings Ltd (FUTU.US)$The stock started moving sideways in August last year, forming a P-shaped volume distribution. In mid-February, it broke down significantly below the support line at 152.74, and even after half a month, it failed to recover, testing the support line with reduced volume. After the earnings report, a large bearish candlestick emerged on high volume, with the 50-day moving average crossing below the annual line, indicating a possible continuation of the downward trend.  5、 $PDD Holdings (PDD.US)$自2...
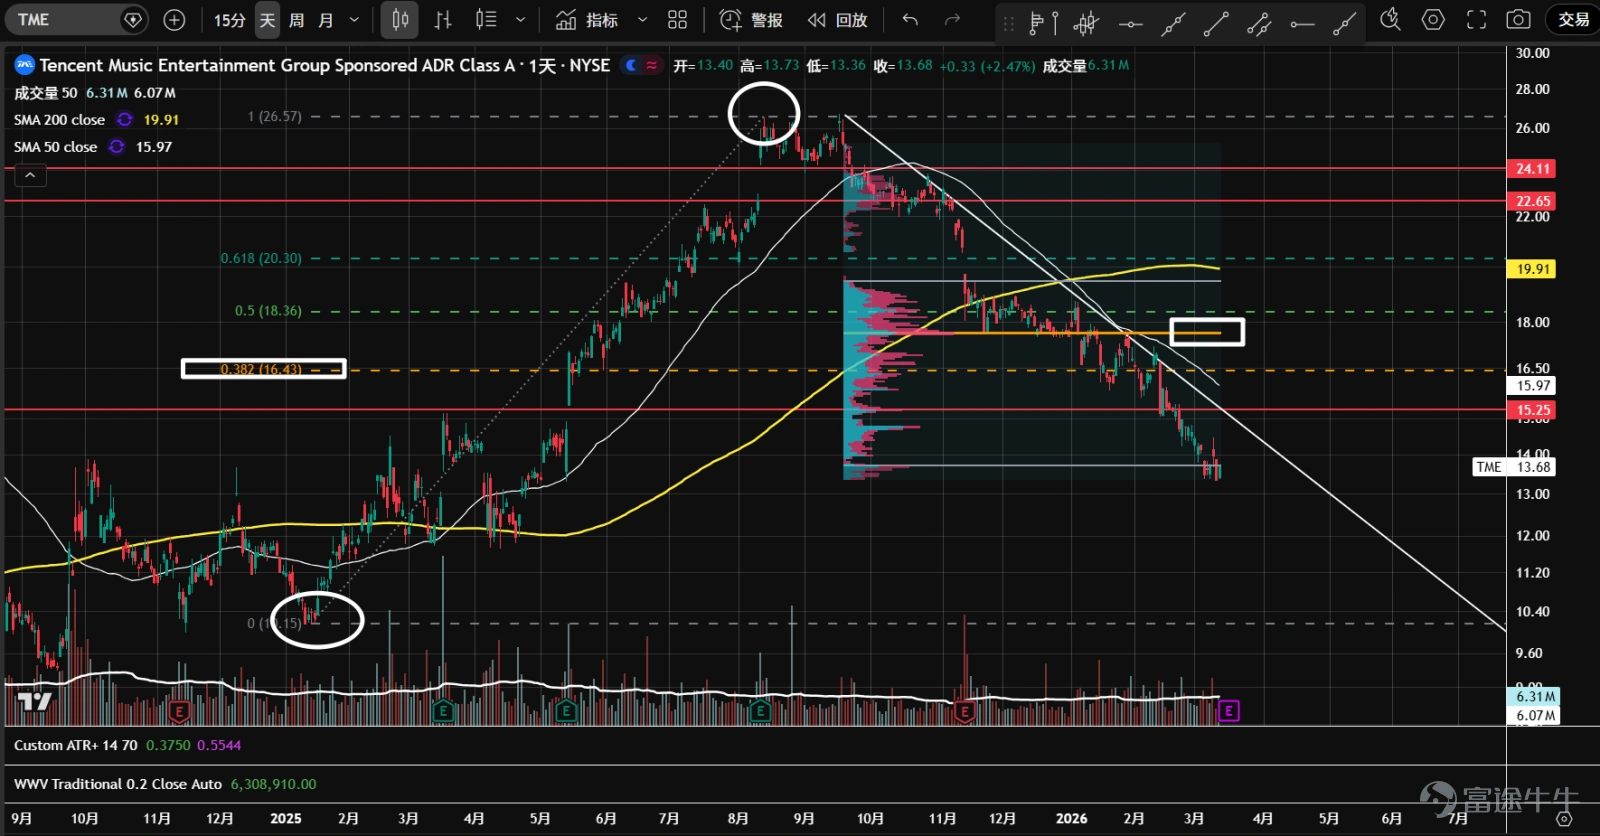
6、 $Tencent Music (TME.US)$ The stock has been on a persistently weak trajectory, breaking below the 38.2% retracement level of the previous rally without showing signs of panic selling. Every attempt at a bullish counterattack has been feeble. The volume control point (orange) has not shifted lower. Until the stock breaks above the descending trendline, bottom-fishing is not advisable.
1、 $Alibaba (BABA.US)$The stock has been moving sideways since the end of January, when it retreated from its peak. The bearish price-volume cycle eventually led to a significant breakout below the support at 145 in early March, with deep declines and a high probability of an effective breakdown. A recent low-volume rebound shows insufficient demand, and resistance at the downtrend line suggests a potential continuation of the decline.  2、 $Baidu (BIDU.US)$The stock entered a sideways movement in October last year and retreated back into range after a false breakout in late January. The bearish price-volume cycle has left bullish rebounds weak. Currently near the volume control point (orange), no bottom-fishing should be considered until a new downtrend line is broken.  3、 $Bilibili (BILI.US)$The stock entered a sideways movement in October last year and retreated back into range after a false breakout in late January this year. Recently, panic selling appeared at the support level of 24.3 at the bottom of the range, currently undergoing a second test and heading towards the corner position while awaiting directional clarity.  4、 $Futu Holdings Ltd (FUTU.US)$The stock started moving sideways in August last year, forming a P-shaped volume distribution. In mid-February, it broke down significantly below the support line at 152.74, and even after half a month, it failed to recover, testing the support line with reduced volume. After the earnings report, a large bearish candlestick emerged on high volume, with the 50-day moving average crossing below the annual line, indicating a possible continuation of the downward trend.  5、 $PDD Holdings (PDD.US)$自2...
7、 $NetEase (NTES.US)$ At the end of January, the stock broke below the top symmetrical triangle and the bottom ice line at 130 with heavy trading volume. In mid-February, there was a rebound, but the magnitude was minimal and could not reach the ice line. This indicates bearish price-volume cycles. Recently, there was another volume-driven rebound, but it was also very limited. Trading volume quickly dried up, suggesting the downtrend may resume soon.
1、 $Alibaba (BABA.US)$The stock has been moving sideways since the end of January, when it retreated from its peak. The bearish price-volume cycle eventually led to a significant breakout below the support at 145 in early March, with deep declines and a high probability of an effective breakdown. A recent low-volume rebound shows insufficient demand, and resistance at the downtrend line suggests a potential continuation of the decline.  2、 $Baidu (BIDU.US)$The stock entered a sideways movement in October last year and retreated back into range after a false breakout in late January. The bearish price-volume cycle has left bullish rebounds weak. Currently near the volume control point (orange), no bottom-fishing should be considered until a new downtrend line is broken.  3、 $Bilibili (BILI.US)$The stock entered a sideways movement in October last year and retreated back into range after a false breakout in late January this year. Recently, panic selling appeared at the support level of 24.3 at the bottom of the range, currently undergoing a second test and heading towards the corner position while awaiting directional clarity.  4、 $Futu Holdings Ltd (FUTU.US)$The stock started moving sideways in August last year, forming a P-shaped volume distribution. In mid-February, it broke down significantly below the support line at 152.74, and even after half a month, it failed to recover, testing the support line with reduced volume. After the earnings report, a large bearish candlestick emerged on high volume, with the 50-day moving average crossing below the annual line, indicating a possible continuation of the downward trend.  5、 $PDD Holdings (PDD.US)$自2...
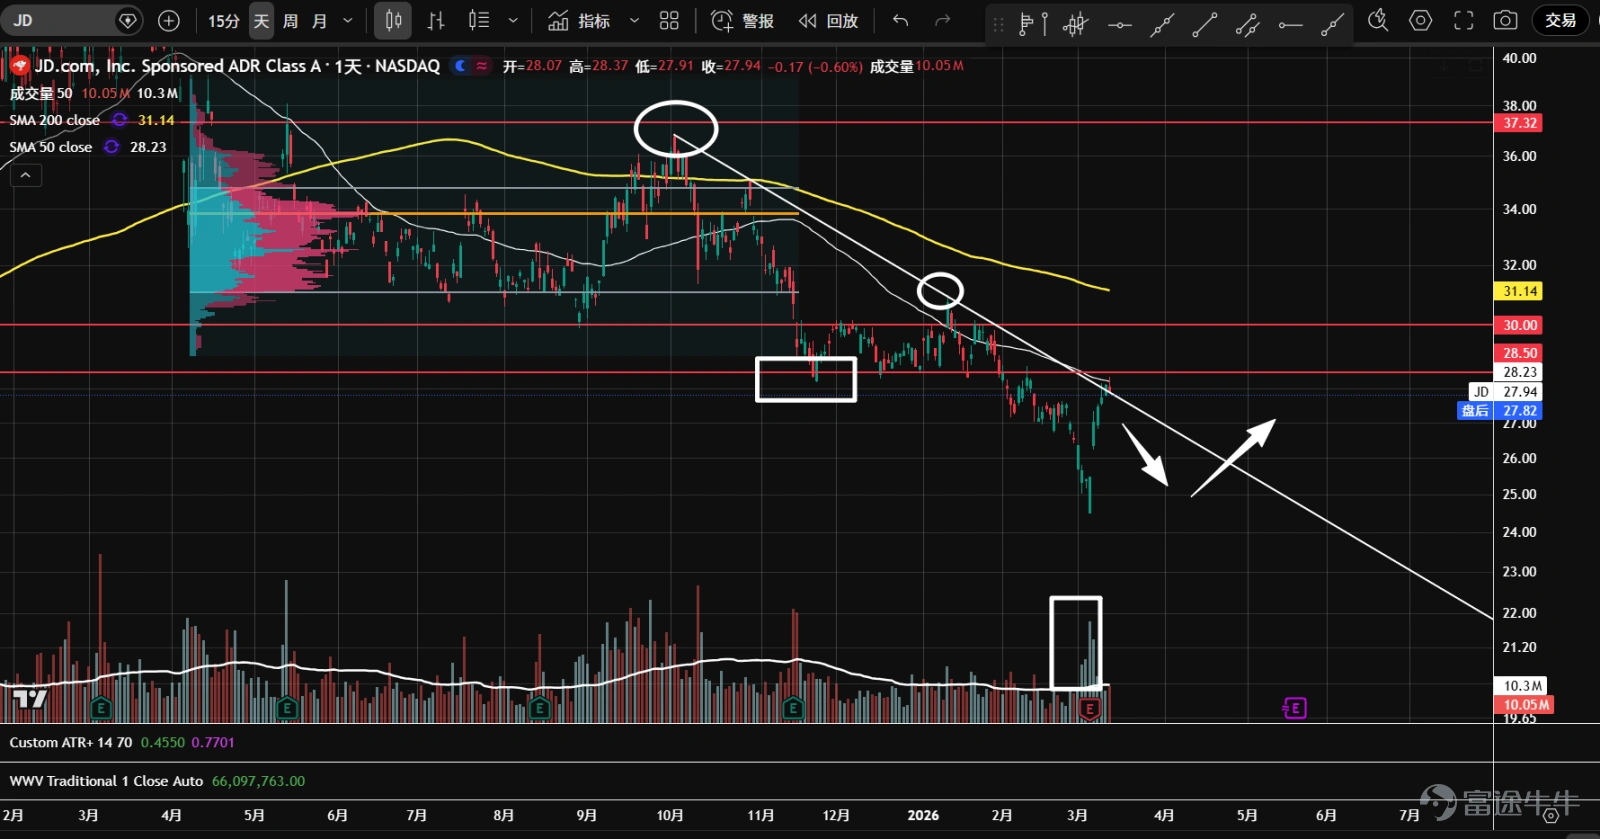
8、 $JD.com (JD.US)$ After breaking below the secondary distribution zone, the stock once experienced an accelerated decline with increasing trading volume. Following the earnings report, there was a massive rebound from the bottom with significant demand entering the market. However, the stock faced resistance at the descending trendline and at the 28.5 resistance level. Trading volume decreased, and we are waiting for a pullback to find a buying opportunity.
1、 $Alibaba (BABA.US)$The stock has been moving sideways since the end of January, when it retreated from its peak. The bearish price-volume cycle eventually led to a significant breakout below the support at 145 in early March, with deep declines and a high probability of an effective breakdown. A recent low-volume rebound shows insufficient demand, and resistance at the downtrend line suggests a potential continuation of the decline.  2、 $Baidu (BIDU.US)$The stock entered a sideways movement in October last year and retreated back into range after a false breakout in late January. The bearish price-volume cycle has left bullish rebounds weak. Currently near the volume control point (orange), no bottom-fishing should be considered until a new downtrend line is broken.  3、 $Bilibili (BILI.US)$The stock entered a sideways movement in October last year and retreated back into range after a false breakout in late January this year. Recently, panic selling appeared at the support level of 24.3 at the bottom of the range, currently undergoing a second test and heading towards the corner position while awaiting directional clarity.  4、 $Futu Holdings Ltd (FUTU.US)$The stock started moving sideways in August last year, forming a P-shaped volume distribution. In mid-February, it broke down significantly below the support line at 152.74, and even after half a month, it failed to recover, testing the support line with reduced volume. After the earnings report, a large bearish candlestick emerged on high volume, with the 50-day moving average crossing below the annual line, indicating a possible continuation of the downward trend.  5、 $PDD Holdings (PDD.US)$自2...
9、 $TENCENT (00700.HK)$ In early February, the stock broke below the top pattern with heavy trading volume and subsequently formed a descending wedge after continuous declines, followed by a strong rebound. However, during this rebound toward the annual moving average, there was unusually high trading volume accompanied by significant price volatility, indicating substantial supply pressure. Once trading volume dries up, the stock price may continue to retreat.
1、 $Alibaba (BABA.US)$The stock has been moving sideways since the end of January, when it retreated from its peak. The bearish price-volume cycle eventually led to a significant breakout below the support at 145 in early March, with deep declines and a high probability of an effective breakdown. A recent low-volume rebound shows insufficient demand, and resistance at the downtrend line suggests a potential continuation of the decline.  2、 $Baidu (BIDU.US)$The stock entered a sideways movement in October last year and retreated back into range after a false breakout in late January. The bearish price-volume cycle has left bullish rebounds weak. Currently near the volume control point (orange), no bottom-fishing should be considered until a new downtrend line is broken.  3、 $Bilibili (BILI.US)$The stock entered a sideways movement in October last year and retreated back into range after a false breakout in late January this year. Recently, panic selling appeared at the support level of 24.3 at the bottom of the range, currently undergoing a second test and heading towards the corner position while awaiting directional clarity.  4、 $Futu Holdings Ltd (FUTU.US)$The stock started moving sideways in August last year, forming a P-shaped volume distribution. In mid-February, it broke down significantly below the support line at 152.74, and even after half a month, it failed to recover, testing the support line with reduced volume. After the earnings report, a large bearish candlestick emerged on high volume, with the 50-day moving average crossing below the annual line, indicating a possible continuation of the downward trend.  5、 $PDD Holdings (PDD.US)$自2...
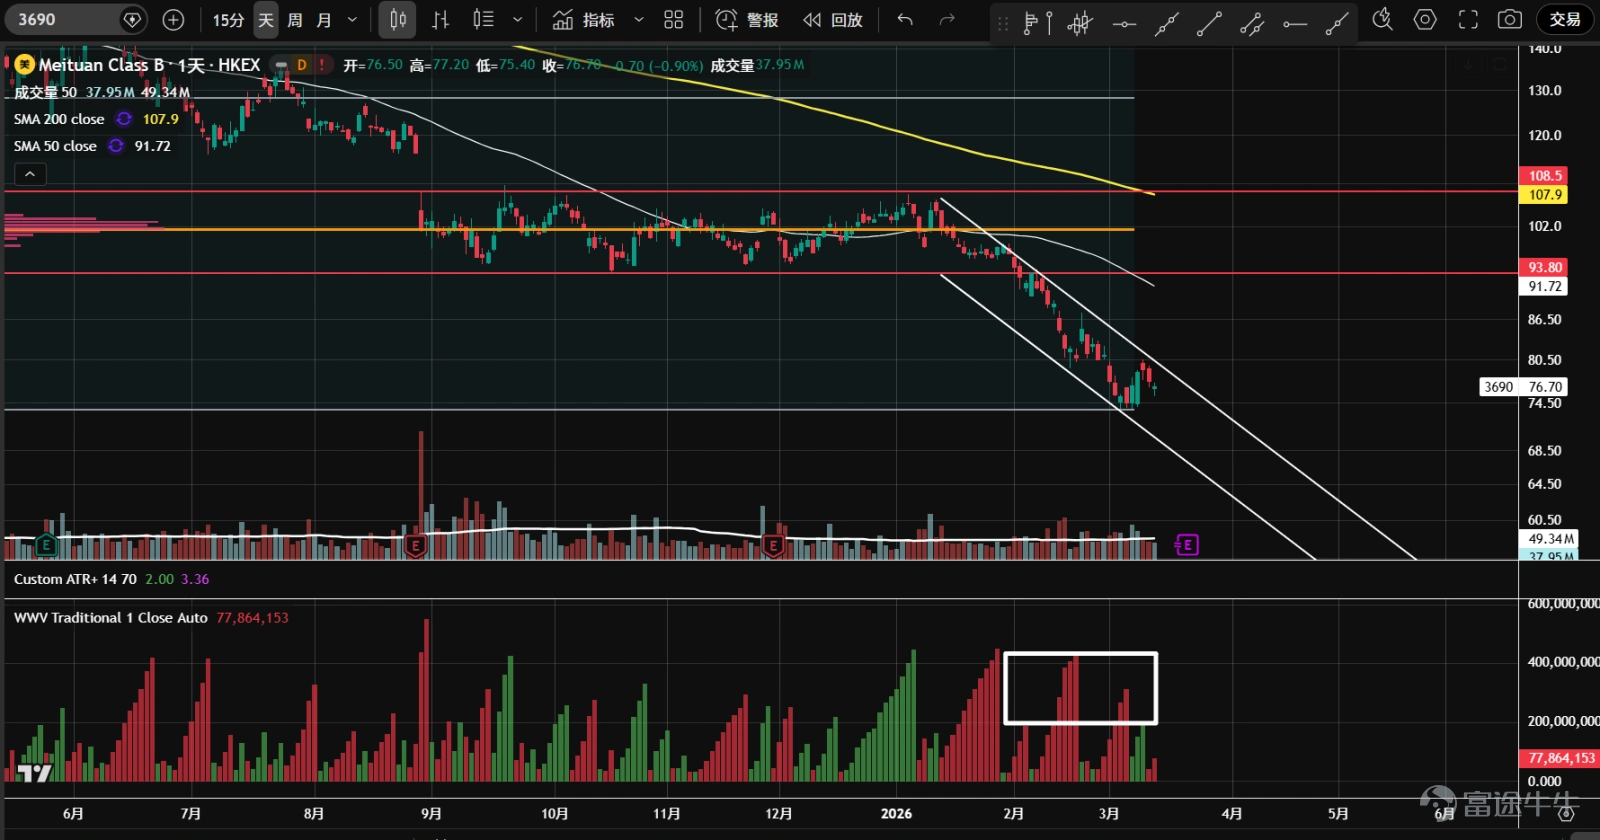
10、 $MEITUAN-W (03690.HK)$ In early February, the stock broke below the secondary distribution zone that had formed since September last year, opening up downside space and entering a descending channel with bearish price-volume cycles. With the upcoming earnings announcement, it is advised to stay on the sidelines for now.
1、 $Alibaba (BABA.US)$The stock has been moving sideways since the end of January, when it retreated from its peak. The bearish price-volume cycle eventually led to a significant breakout below the support at 145 in early March, with deep declines and a high probability of an effective breakdown. A recent low-volume rebound shows insufficient demand, and resistance at the downtrend line suggests a potential continuation of the decline.  2、 $Baidu (BIDU.US)$The stock entered a sideways movement in October last year and retreated back into range after a false breakout in late January. The bearish price-volume cycle has left bullish rebounds weak. Currently near the volume control point (orange), no bottom-fishing should be considered until a new downtrend line is broken.  3、 $Bilibili (BILI.US)$The stock entered a sideways movement in October last year and retreated back into range after a false breakout in late January this year. Recently, panic selling appeared at the support level of 24.3 at the bottom of the range, currently undergoing a second test and heading towards the corner position while awaiting directional clarity.  4、 $Futu Holdings Ltd (FUTU.US)$The stock started moving sideways in August last year, forming a P-shaped volume distribution. In mid-February, it broke down significantly below the support line at 152.74, and even after half a month, it failed to recover, testing the support line with reduced volume. After the earnings report, a large bearish candlestick emerged on high volume, with the 50-day moving average crossing below the annual line, indicating a possible continuation of the downward trend.  5、 $PDD Holdings (PDD.US)$自2...
11、 $KUAISHOU-W (01024.HK)$ Since July last year, the stock has been stuck in a consolidation range. In early February, it dropped from the resistance at the 82-axis line and formed a large bearish candle with heavy trading volume. All subsequent rebounds were feeble with contracting volume, showing bearish price-volume cycles. K-line patterns indicate clear distribution characteristics. At the beginning of March, the stock broke below the support of the bottom ice line at 62.6 with heavy volume. If it fails to recover shortly, the probability of an effective breakdown increases significantly.
1、 $Alibaba (BABA.US)$The stock has been moving sideways since the end of January, when it retreated from its peak. The bearish price-volume cycle eventually led to a significant breakout below the support at 145 in early March, with deep declines and a high probability of an effective breakdown. A recent low-volume rebound shows insufficient demand, and resistance at the downtrend line suggests a potential continuation of the decline.  2、 $Baidu (BIDU.US)$The stock entered a sideways movement in October last year and retreated back into range after a false breakout in late January. The bearish price-volume cycle has left bullish rebounds weak. Currently near the volume control point (orange), no bottom-fishing should be considered until a new downtrend line is broken.  3、 $Bilibili (BILI.US)$The stock entered a sideways movement in October last year and retreated back into range after a false breakout in late January this year. Recently, panic selling appeared at the support level of 24.3 at the bottom of the range, currently undergoing a second test and heading towards the corner position while awaiting directional clarity.  4、 $Futu Holdings Ltd (FUTU.US)$The stock started moving sideways in August last year, forming a P-shaped volume distribution. In mid-February, it broke down significantly below the support line at 152.74, and even after half a month, it failed to recover, testing the support line with reduced volume. After the earnings report, a large bearish candlestick emerged on high volume, with the 50-day moving average crossing below the annual line, indicating a possible continuation of the downward trend.  5、 $PDD Holdings (PDD.US)$自2...
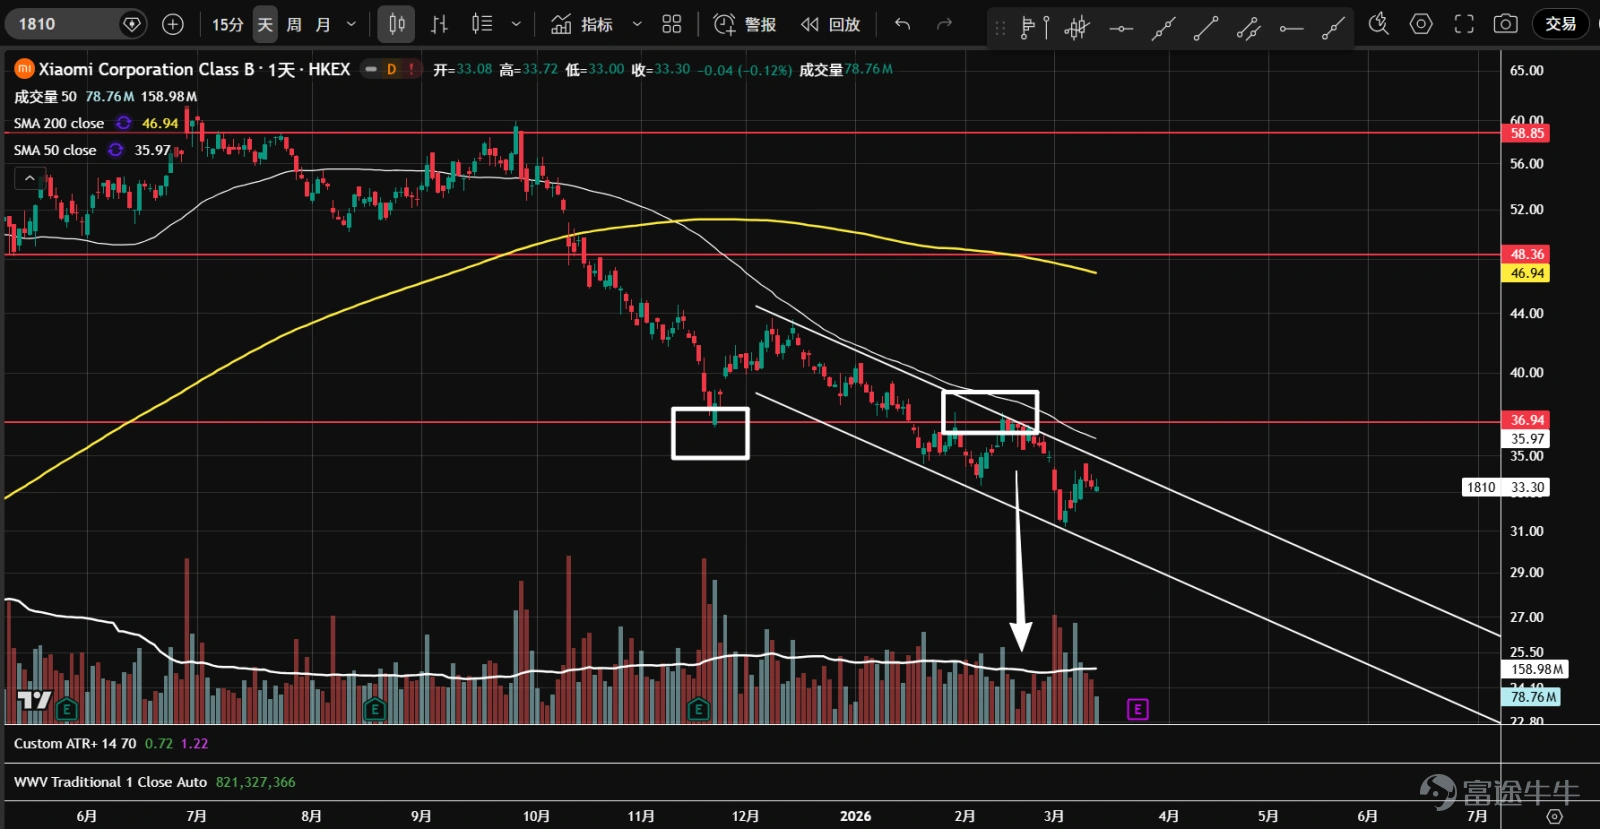
12、 $XIAOMI-W (01810.HK)$ After breaking below the top pattern in October last year, the stock has remained in a downtrend. Although there was a brief rebound at the major support level of 37, it quickly broke down again. After a low-volume rebound tested this position, the downtrend resumed with increasing trading volume, showing bearish price-volume cycles. Going forward, the stock may continue to move within a descending channel. With the earnings release imminent, it is recommended to stay on the sidelines.
1、 $Alibaba (BABA.US)$The stock has been moving sideways since the end of January, when it retreated from its peak. The bearish price-volume cycle eventually led to a significant breakout below the support at 145 in early March, with deep declines and a high probability of an effective breakdown. A recent low-volume rebound shows insufficient demand, and resistance at the downtrend line suggests a potential continuation of the decline.  2、 $Baidu (BIDU.US)$The stock entered a sideways movement in October last year and retreated back into range after a false breakout in late January. The bearish price-volume cycle has left bullish rebounds weak. Currently near the volume control point (orange), no bottom-fishing should be considered until a new downtrend line is broken.  3、 $Bilibili (BILI.US)$The stock entered a sideways movement in October last year and retreated back into range after a false breakout in late January this year. Recently, panic selling appeared at the support level of 24.3 at the bottom of the range, currently undergoing a second test and heading towards the corner position while awaiting directional clarity.  4、 $Futu Holdings Ltd (FUTU.US)$The stock started moving sideways in August last year, forming a P-shaped volume distribution. In mid-February, it broke down significantly below the support line at 152.74, and even after half a month, it failed to recover, testing the support line with reduced volume. After the earnings report, a large bearish candlestick emerged on high volume, with the 50-day moving average crossing below the annual line, indicating a possible continuation of the downward trend.  5、 $PDD Holdings (PDD.US)$自2...
Risk Disclaimer: The above content only represents the author's view. It does not represent any position or investment advice of Futu. Futu makes no representation or warranty.Read more
Thumbs Up
6
Heart
1
Sob
1
817K Views
Report
Comments (4)
Write a Comment...
4
8