

Bull-Bear Battle at 555 Yuan: How to Position for Tencent’s Short-Term Trading Opportunities?
The stock rose against the market trend by 1.56%, currently trading at $555. According to the moving average analysis, the price has moved above the 10-day moving average at $523.75 and the 30-day moving average at $545.33, while the 60-day moving average is located at $578.08, forming a significant resistance area above. This indicates that a short-term recovery trend has been established, but a medium-term reversal still needs to be validated by an effective breakout of the pressure zone.
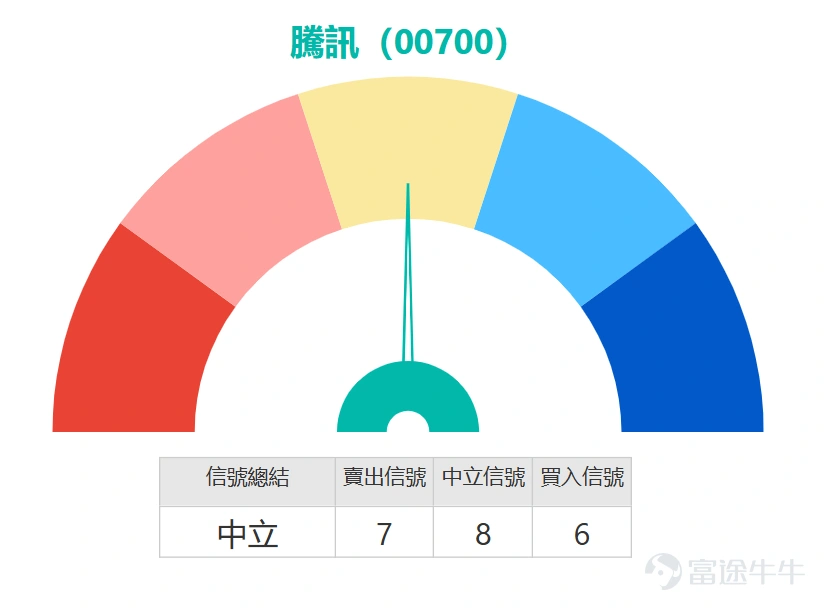
On the technical indicators front, the overall picture remains neutral. The Stochastic Oscillator and CCI indicators show no clear bullish or bearish signals, with the RSI index holding steady at 53—a midpoint level. Similarly, indicators such as the Williams %R and ADX are also leaning towards neutrality. The overall technical signal strength score is 8, and the comprehensive technical indicator assessment is 'Neutral.' However, there is notable divergence within the indicators: the ROC and MACD have issued buy signals, while the VR volume ratio indicator suggests 'severe oversold conditions and likely bottoming,' hinting at latent technical rebound potential. Conversely, the Bull-Bear Power Indicator and Ichimoku Cloud both display sell signals, reflecting lingering bearish pressure and highlighting an intense tug-of-war between bulls and bears.
In terms of key price levels, the first support lies at 523 yuan, with the second support extending down to 498 yuan. The first resistance sits at 572 yuan, followed by a second resistance at 595 yuan. If the price can hold above the 523-yuan level and break through the 572-yuan resistance, there's potential for a short-term move toward the 595-yuan mark. A breach below 523 yuan, however, could open up downside space, potentially testing the 498-yuan level. Coupled with a five-day volatility of 13.9% and an upward probability of 54%, this data underscores heightened volatility with a slight bullish bias, necessitating robust risk management in trading decisions.

The derivatives market has sent out a cautiously optimistic signal. From March 10th to 12th, call warrant street volumes remained stable at a high range of 8802-8889.99 million shares, consistently 14-18 times larger than put warrant volumes, indicating strong consensus among medium-to-long-term investors favoring bullish positions. Meanwhile, put warrant street volumes initially rose but later declined; after short sellers briefly added positions on March 11th as prices surged, they quickly reduced their positions by 24.15% on March 12th, signaling a rapid departure of bearish funds. In the bull-bear certificate segment, bullish signals were even stronger, with bull certificates seeing continuous increases over two days, registering a cumulative three-day rise of 37.82%. Bear certificates, on the other hand, experienced a cumulative reduction of 36.22%. Short-term capital appears to be betting strongly on an upward breakout. Overall, the derivatives market shows rising bullish positions and rapidly waning bearish strength, reflecting growing confidence in Tencent’s valuation recovery and making further upward price movement more likely.
Product Review:
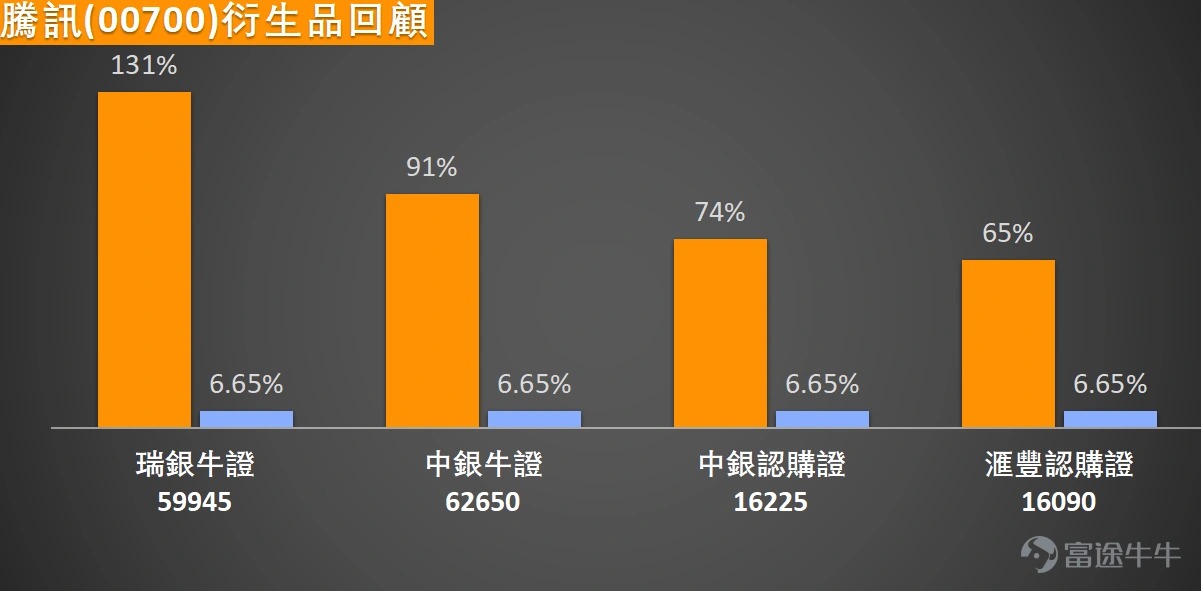
Looking back at Tencent's underlying stock performance since March 6th, the stock rebounded by a cumulative 6.65% over two days, driving significant gains across related derivatives. $UB#TENCTRC2608F.C (59945.HK)$ The cumulative increase over two days reached 131%, $BI#TENCTRC2612K.C (62650.HK)$ also achieving a considerable gain of 91%. The performance of call warrants was equally impressive, $BITENCT@EC2606A.C (16225.HK)$ 、 $HSTENCT@EC2606A.C (16090.HK)$ with respective gains of 74% and 65%.
In terms of call warrants, there are currently two products worth noting. $BITENCT@EC2608E.C (26418.HK)$ offering approximately 8.2 times leverage with an exercise price of 629.38 yuan; its advantage lies in relatively lower premium, making it suitable for investors optimistic about the future market while aiming to control costs. Another option is $GJTENCT@EC2607A.C (23121.HK)$ with leverage of about 9.4 times and an exercise price of 622.72 yuan; this warrant's premium and implied volatility are among the lowest in its category, effectively reducing the impact of time decay.
If investors are bearish on Tencent's short-term trend, they may consider put warrant products. $BPTENCT@EP2605A.P (19459.HK)$ with higher leverage at approximately 14.1 times and an exercise price of 460 yuan; its premium is the lowest in its category. Another one $BITENCT@EP2608A.P (26075.HK)$ with an exercise price of 466.46 yuan, offers about 7.8 times leverage, and its biggest advantage lies in having the lowest implied volatility, meaning its price is less affected by changes in volatility.
For investors who are bullish on the underlying stock and seek higher efficiency, bull contracts are a direct way to participate in the ups and downs. $UB#TENCTRC26076.C (59949.HK)$The call price is set at 480 yuan, with a leverage of approximately 7.4 times and a relatively low premium.$BI#TENCTRC2612K.C (62650.HK)$The call price is set at 489 yuan, offering a leverage of about 7.7 times, also featuring the advantage of a lower premium. Both are suitable for deployment if you believe the stock price will not reach the call level.
Conversely, if you expect the stock price to face adjustments, you may consider bear warrant products.$UB#TENCTRP2812L.P (58047.HK)$The call price is 580 yuan, with a high leverage of approximately 17.9 times and a relatively low premium.$BI#TENCTRP2812D.P (57847.HK)$The call price is set at 585 yuan, providing leverage of about 14.6 times, also making it a choice with a lower premium. Investors should remember that bull and bear warrants have a call mechanism. If the underlying stock price hits the call price, the product will be immediately suspended from trading and may result in losses.

Do you think Tencent's current rebound can break through the first resistance level of 572 yuan? What catalysts do you think might drive Tencent’s share price higher? Feel free to share your insights in the comments section. For more market analysis, please stay tuned to 'HK Stock Warrants Jenny' for daily updates!
Reminder: This article does not constitute any investment advice. It is for reference only and does not constitute investment advice. Market data, opinions, and analysis contained herein may change at any time without prior notice. We are not responsible for any loss or damage caused by reliance on the information in this article. Technical analysis only shows whether certain technical conditions are met; asset performance should be comprehensively evaluated with other data. Trading decisions should not be made solely based on this article. Please note that past performance is not indicative of future results.
#HongKongStocks #HangSengIndex #RealTimeAnalysis #WarrantsSelection #WarrantsStrategy #DerivativesHedging #HongKongWarrantsJenny #Tencent #00700 #TechStocks #$Hang Seng TECH Index (800700.HK)$$Hang Seng Index (800000.HK)$$Hang Seng China Enterprises Index (800100.HK)$
Risk Disclaimer: The above content only represents the author's view. It does not represent any position or investment advice of Futu. Futu makes no representation or warranty.Read more

Comments (5)
to post a comment
1
13