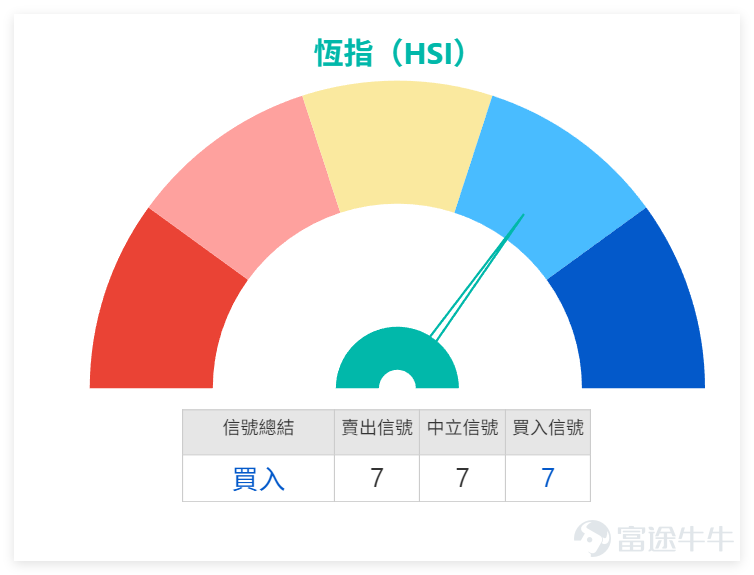

The Hang Seng Index has fallen below multiple moving averages, but the technical indicators show a strong signal of price decline. The short-term outlook involves fluctuations while seeking a bottom.
On March 12th, the Hong Kong stock market experienced an overall pullback, with mixed performances from blue-chip stocks. Technical indicators generally signaled buying opportunities, and the short-term market trend is inclined towards consolidation at the bottom, with potential for a technical rebound.
In our [Hong Kong Stock Report] yesterday (12th), we also provided commentary $Hang Seng Index (800000.HK)$
: The index closed at 25,716.76 points, down 182 points for the day, a decrease of about 0.7%. Observing the recent trend, after rebounding earlier, the index has fallen back again and is now below multiple short- to medium-term moving averages, indicating that short-term market momentum has weakened, with capital sentiment gradually turning cautious.
From a technical perspective, the Hang Seng Index is currently trading below its 10-day, 20-day, and 50-day moving averages. The 10-day moving average is around 25,777 points, the 20-day moving average is near 26,287 points, and the 50-day moving average is close to 26,527 points. This configuration of moving averages typically indicates that both short- and medium-term trends are in an adjustment phase, making it difficult for the market to sustain an upward trend until it moves back above the 10-day moving average.
In terms of momentum indicators, the 9-day RSI is at 42.98, retreating from the neutral zone to weaker levels. Although the RSI has not entered oversold territory, it already reflects weakening buying momentum in the market. Therefore, in the short term, the index is more likely to remain volatile or gradually seek support.
![On March 12th, the Hong Kong stock market experienced an overall pullback, with mixed performances from blue-chip stocks. Technical indicators generally signaled buying opportunities, and the short-term market trend is inclined towards consolidation at the bottom, with potential for a technical rebound. In our [Hong Kong Stock Report] yesterday (12th), we also provided commentary $Hang Seng Index (800000.HK)$ : The index closed at 25,716.76 points, down 182 points for the day, a decrease of about 0.7%. Observing the recent trend, after rebounding earlier, the index has fallen back again and is now below multiple short- to medium-term moving averages, indicating that short-term market momentum has weakened, with capital sentiment gradually turning cautious. From a technical perspective, the Hang Seng Index is currently trading below its 10-day, 20-day, and 50-day moving averages. The 10-day moving average is around 25,777 points, the 20-day moving average is near 26,287 points, and the 50-day moving average is close to 26,527 points. This configuration of moving averages typically indicates that both short- and medium-term trends are in an adjustment phase, making it difficult for the market to sustain an upward trend until it moves back above the 10-day moving average. In terms of momentum indicators, the 9-day RSI is at 42.98, retreating from the neutral zone to weaker levels. Although the RSI has not entered oversold territory, it already reflects weakening buying momentum in the market. Therefore, in the short term, the index is more likely to remain volatile or gradually seek support. In terms of support and resistance, the first short-term resistance level is near 25,780 points (the 10-day moving average position). If the index can stabilize above this area again, there may be an opportunity for improvement in the short-term trend; the first support level can refer to 25,...](https://nnqimage.futunn.com/sns_client_feed/228620/20260313/web-1773366430648-4ZGVEthZxe.png/big?area=1&is_public=true&imageMogr2/ignore-error/1/format/webp)
For support and resistance, the first short-term resistance level is near 25,780 points (the position of the 10-day moving average). If the index can stabilize above this area, the short-term trend may improve. The first support level is around 25,500 points. If it breaks below this level, it may test further support near 25,200 points.
The Hong Kong stock market has seen an overall correction, with key blue-chip stocks showing mixed performance the previous day. Technical signals have significantly strengthened; the following is a brief analysis of their technical highlights:
1. Tencent (00700): Closed at HKD 546.5 (down 1.00%), above the 10-day moving average, but below the 30-day and 60-day moving averages, RSI at 53, signal neutral, short-term direction awaits a breakout from the moving averages.
2. Alibaba (09988): Closed at HKD 131.6 (down 1.20%), below all major moving averages, RSI at 35 (near oversold territory), signal buy (strength 7), rebound demand accumulating.
3. Hong Kong Exchanges and Clearing (00388): Closed at HKD 406.4 (down 1.22%), below the 10-day and 30-day moving averages but above the 60-day moving average, RSI at 45, signal strong buy (strength 7), rebound momentum strong.
4. Meituan (03690): Closed at HKD 76.7 (down 0.90%), below all major moving averages, RSI at 32 (oversold), signal buy (strength 7), short-term rebound opportunity evident.
5. China Construction Bank (00939): Closed at HKD 7.92 (up 1.80%), above the 10-day and 30-day moving averages but below the 60-day moving average, RSI at 43, signal sell (strength 3), beware of profit-taking.
6. AIA (01299): Closed at HKD 84.35 (down 2.43%), below MA10 and MA30, slightly above MA60, RSI 51, signal to sell, focus on MA60 support.
7. ICBC (01398): Closed at HKD 6.31 (up 1.45%), slightly below MA10 and MA30, above MA60, RSI 39, signal to buy (strength 7), limited downside.
8. China Mobile (00941): Closed at HKD 79.0 (flat), above MA10 and MA30, below MA60, RSI 46, neutral signal, narrow range waiting for breakout.
9. HSBC Holdings (00005): Closed at HKD 128.9 (down 3.08%), below all major moving averages, RSI 44, neutral signal, possible recovery after short-term correction.
10. Ping An (02318): Closed at HKD 62.85 (down 1.02%), below all major moving averages, RSI 37, signal to buy (strength 7), rebound expected after oversold conditions.
Review and selection of call warrants and bull/bear products:
First, let's review the performance of the warrants and bull/bear products recommended earlier: The Hang Seng Index-related warrants and bull certificates recommended on March 6 showed decent gains. Specifically, the Bank of China bull certificate (53747) rose 20% in 2 days, the Bank of China bull certificate (68194) gained 17% in 2 days, and the HSBC call warrant (23723) increased by 5% in 2 days. Overall performance met technical expectations.
Here are two selected Hang Seng Index-related warrant products for your reference:
First pick: HSBC call warrant (23723), leverage 15.3, exercise price 26733, the main advantage is the lowest premium and implied volatility, good value for money, suitable for investors who are optimistic about a short-term rebound in the Hang Seng Index.
Second pick: Bank of China bull certificate (54626), leverage 24, recovery price 24750, relatively low premium, reasonable leverage, suitable for investors looking to capitalize on Hang Seng Index rebound opportunities while managing risk.
Risk Warning: Warrants are derivatives with significant leverage effects. Whether call warrants or bull/bear certificates, it's important to set stop-loss and act within your means.
The market on March 12 can be summarized as 'price drop but strong signals,' where the stock price decline contrasts sharply with widespread buy signals from technical indicators. This is an important technical sign that the market may be nearing a short-term bottom. Focus on warrants with low premiums and reasonable leverage, and manage risk effectively.
The Hang Seng Index has fallen below all moving averages, but technical indicators are frequently showing buy signals. What do you think now is:
A. A drop below 25,000 is imminent
B. A rebound will start within three days
C. Wait for the market to give clear signals
Feel free to share your insights in the comments section.
Reminder: This article does not constitute any investment advice.
This article is for reference only and does not constitute any investment advice. The market data, opinions, and analysis contained herein may change at any time without prior notice. We are not responsible for any loss or damage caused by reliance on the information in this article. Technical analysis only shows whether certain technical conditions are met; a comprehensive assessment of asset performance should be conducted using additional data. Decisions to trade should not be based solely on this article. Please note that past performance is not indicative of future results.
#HongKongStocks #HangSengIndex #RealTimeAnalysis #WarrantsSelection #WarrantsStrategy #DerivativesHedging #TencentHoldings #Alibaba #HongKongStockExchange #TechnicalAnalysis
Risk Disclaimer: The above content only represents the author's view. It does not represent any position or investment advice of Futu. Futu makes no representation or warranty.Read more

Comments
to post a comment
1