
HKEX support level faces test, rebound imminent?
$HKEX (00388.HK)$ The stock price has continued its weak performance, remaining under pressure after retreating from last month's high. The latest quote is HKD 404.4, down 1.7%, with an intraday low touching HKD 403, breaking below multiple moving averages including the 5-day, 10-day, 20-day, 30-day, and 60-day lines. Technically, a bearish pattern is evident, with the stock just a step away from the annual line at HKD 399.58.
Beneath the surface of the sluggish price movement, several key technical oscillators have begun to emit signals contrary to the price trend, suggesting that selling pressure may be waning and momentum could be quietly shifting. Although the Relative Strength Index (RSI) remains neutral at 46, the Stochastic Oscillator has rebounded from the oversold zone, showing potential for a 'bottom divergence'—where the stock hits recent lows but the indicator’s lows are gradually rising—a common precursor to weakening downward momentum. The CCI also shows similar divergence signs, starting to edge out of deeply oversold territory, increasing the likelihood of a short-term technical rebound.
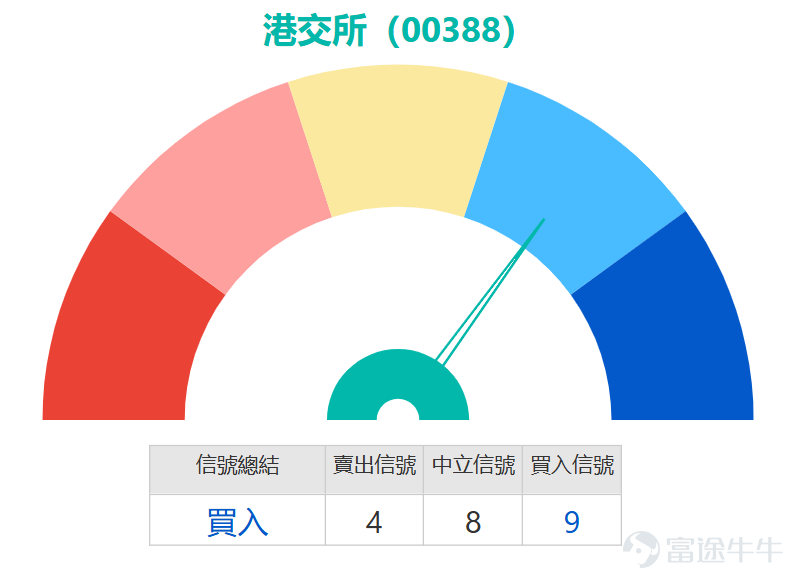
Moreover, while trend indicators like ADX and MACD still point to a bearish market, the decline in momentum oscillators such as Momentum (MTM) and Rate of Change (ROC) has notably slowed, with some short-term momentum indicators even quietly flattening. More notably, the system-generated 'Technical Indicator Summary Signal' is 'Buy,' with an intensity rating of 9, describing it as 'severely oversold, possibly bottoming, buy.' This corroborates with the Williams %R indicator, which remains in oversold territory, suggesting excessive market pessimism, creating conditions for a rebound.
In terms of key price levels, the current stock price is approaching the first major support level at HKD 397. If this position is breached, it may further drop to the second support level at HKD 389. On the upside, initial resistance is around HKD 414 (near the 10-day moving average and recent consolidation zone), with stronger resistance at around HKD 422, close to where the 30-day and 60-day moving averages converge. This will be the crucial test for determining whether the rebound can turn into a phase reversal.


If one judges that the stock price will stabilize and rebound near the current key support level, attention should be paid $BI-HKEX@EC2605A.C (23431.HK)$ or $UB-HKEX@EC2605B.C (23336.HK)$Both have the same strike price of 464.19 Hong Kong dollars, offering approximately 13 times actual leverage. Their advantage lies in relatively low premiums, effectively reducing the cost of time value erosion, making them suitable for investors who are optimistic about the market outlook and expect volatility to rise. Conversely, if you believe that the broader market remains weak and stock prices may fall below support levels, you can consider $UB-HKEX@EP2605A.P (24280.HK)$ or $BI-HKEX@EP2605A.P (24260.HK)$Put warrants with a strike price of 388.68 Hong Kong dollars, providing about 12 times leverage, also feature the advantage of lower premiums, serving as tools for hedging against downside risk or executing bearish strategies.
For bull/bear contracts, if you are optimistic about a rebound in HKEX, $HS#TENCTRC2608W.C (65814.HK)$ and $JP#HKEX RC2805G.C (58414.HK)$both set the forced call level at a distant 370 Hong Kong dollars, providing approximately 10 times actual leverage. Among these, J.P. Morgan's bull contract offers slightly higher actual leverage and has a lower premium, increasing capital efficiency. Investors who are bearish on the market outlook might consider $UB#HKEX RP2807G.P (67346.HK)$ or $JP#HKEX RP2812A.P (68170.HK)$with forced call levels set at 450 and 458 respectively. UBS Group’s bear contract has the lowest premium among similar products and offers relatively high actual leverage of about 9.3 times, providing an attractive bearish tool; J.P. Morgan's bear contract has a more distant forced call level, offering another option for more conservative bearish investors.

As a core target in the Hong Kong stock market, do you think the movement of HKEX reflects the subsequent direction of the broader market in advance? If HKEX rebounds subsequently, do you think it can successfully break through the resistance at the 10-day moving average of 414? Feel free to share your insights in the comment section. For more market analysis, please continue following 'Hong Kong Warrants Jenny' for daily updates!
Reminder: This article does not constitute any investment advice.
This article is for reference only and does not constitute any investment advice. The market data, opinions, and analysis contained herein may change at any time without prior notice. We are not responsible for any loss or damage caused by reliance on the information in this article. Technical analysis only shows whether certain technical conditions are met; a comprehensive assessment of asset performance should be conducted using additional data. Decisions to trade should not be based solely on this article. Please note that past performance is not indicative of future results.
#HongKongStocks #HangSengIndex #RealTimeAnalysis #WarrantsSelection #WarrantsStrategy #DerivativesHedging #HongKongWarrantsJenny #HongKongStockExchange #00388 #BlueChipStocks$Hang Seng Index (800000.HK)$
Risk Disclaimer: The above content only represents the author's view. It does not represent any position or investment advice of Futu. Futu makes no representation or warranty.Read more

Comments
to post a comment
2