
Technical Analysis of the Seven Major U.S. Tech Stocks (March 12): MAGS/NVIDIA/Microsoft/Apple/Amazon/Google/META/Tesla
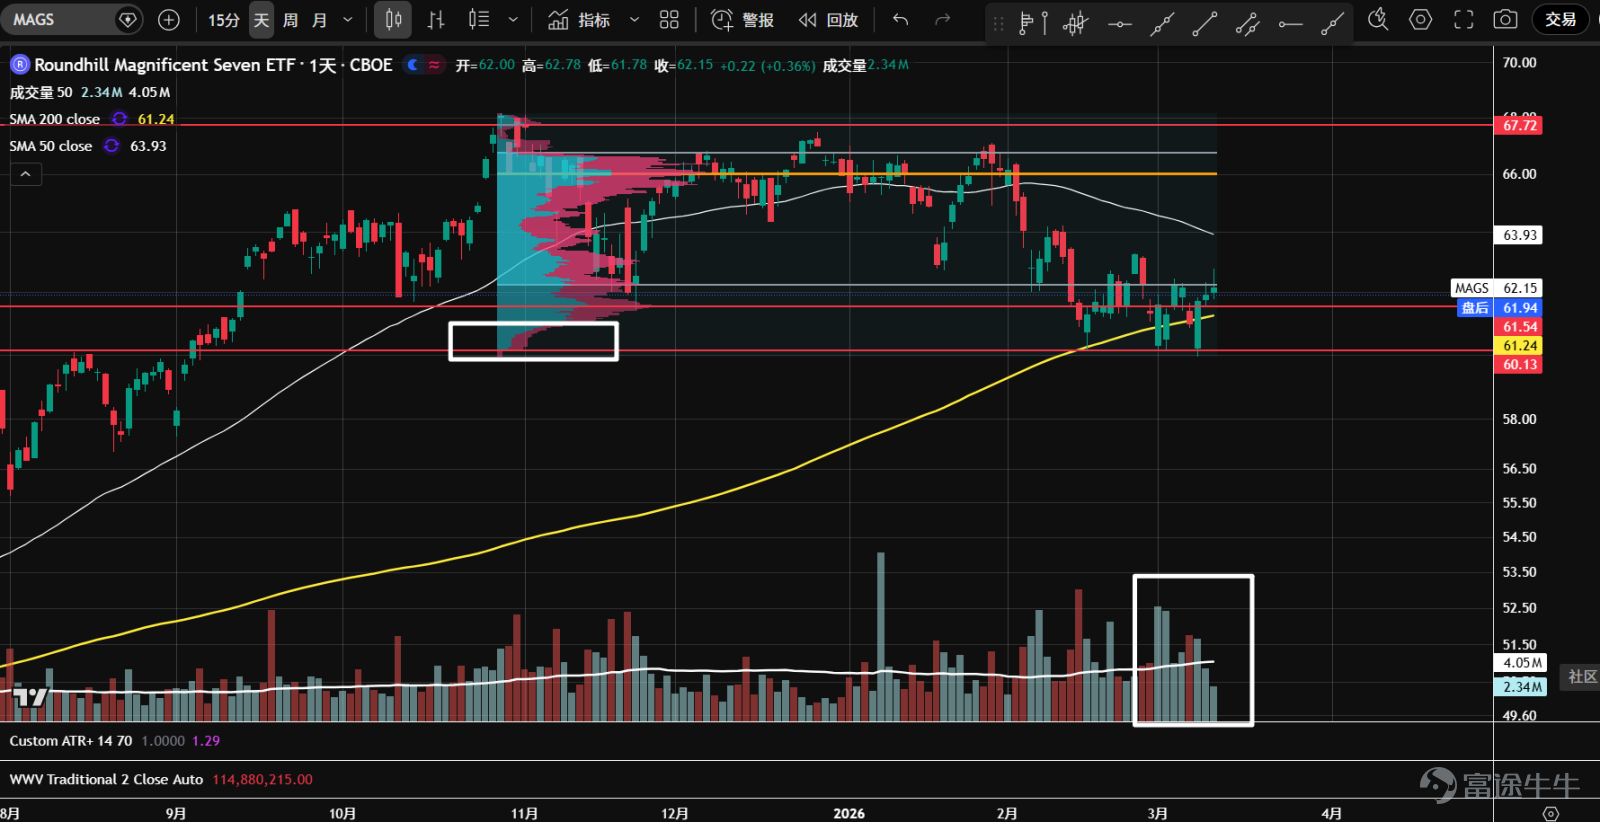
1. The ETF for the seven major tech stocks ( $Roundhill Magnificent Seven ETF (MAGS.US)$ The stock has been moving sideways with fluctuations, starting to fall from its peak at the end of January, while overall trading volume expanded, showing signs of a bearish price-volume cycle and clear distribution characteristics. Since March, continuous bullish candles have appeared at the 60 support level, with K-line closing at a high position, as bulls are absorbing selling pressure tenaciously, but the trading volume remains significant, indicating fierce competition between buyers and sellers.

2、 $NVIDIA (NVDA.US)$ Over the past few months, the stock has been fluctuating within a wide range. After the earnings report was released, it plummeted with heavy volume from resistance at the high point, triggering panic selling. However, after retesting the annual line support twice, it stabilized, with K-line closing at a high position, as bulls have gained footing. Currently, a doji has appeared at the volume control point (orange), likely waiting for guidance from the GTC conference on the 16th.

3、 $Microsoft (MSFT.US)$ After panic selling occurred near the April gap last year, the stock rebounded. In late February, although it hit a new low, it successfully rebounded after a second test with reduced volume. The volume control point has shifted downward, forming a b-type distribution, and wave volume showed the largest upward momentum since the decline. A reversal has occurred, transitioning into a consolidation phase.

4、 $Apple (AAPL.US)$ Adjustments began in December last year, currently forming a converging triangle pattern. On February 27, it plunged toward the uptrend line with heavy volume, showing weak rebounds. The bearish price-volume cycle persists, though it has stabilized with reduced volume at the support level. The volume control point (orange) is at a high position; even if there's a rebound later, there are many trapped positions above, making it difficult to break through upward all at once.

5、 $Amazon (AMZN.US)$ After the earnings report was released in early February, trading volume surged as the price broke below the sideways distribution range formed since last August. The price is currently rebounding on lower volume. Although it breached the bottom support (red) of the distribution range, there are signs of resistance at the lower boundary of the value zone (gray), indicating that a further decline may continue.

6、 $Alphabet-C (GOOG.US)$ Following the breakdown below the rising channel line in early February, the price began to pull back and bounced twice from the support level around 295, with trading volume gradually declining. From the perspective of wave volume analysis, the two significant selling volumes did not break below the range, forming a P-shaped volume distribution. The current assessment suggests that the price has entered a period of sideways consolidation.

7、 $Meta Platforms (META.US)$ Since November of last year, a large converging triangle has formed, and the pattern is gradually nearing its endpoint. A low-volume double test established support at 634, followed by another low-volume test of the uptrend line before bouncing. Candlesticks mostly closed near highs, with trading volume progressively declining, suggesting bulls remain in control.

8、 $Tesla (TSLA.US)$ The price has been moving sideways, starting its decline from the top of the range in December last year, repeatedly testing the dual support at the range bottom of 384 and the yearly moving average. Trading volume has steadily decreased, with bearish momentum gradually weakening. As the price approaches the narrowing angle, an upward breakout is expected. Next, the price may rebound toward the volume control point (orange) and the upper boundary of the value zone (gray).

$S&P 500 Index (.SPX.US)$ $SPDR S&P 500 ETF (SPY.US)$ $NASDAQ 100 Index (.NDX.US)$ $Invesco QQQ Trust (QQQ.US)$ $Dow Jones Industrial Average (.DJI.US)$ $State Street® SPDR® Dow Jones Industrial Average® ETF Trust (DIA.US)$ $Russell 2000 Index (.RUT.US)$ $iShares Russell 2000 ETF (IWM.US)$ $USD (USDindex.FX)$ $U.S. 10-Year Treasury Notes Yield (US10Y.BD)$ $XAU/USD (XAUUSD.CFD)$ $Bitcoin (BTC.CC)$ $Ethereum (ETH.CC)$
Risk Disclaimer: The above content only represents the author's view. It does not represent any position or investment advice of Futu. Futu makes no representation or warranty.Read more


Comments
to post a comment
9