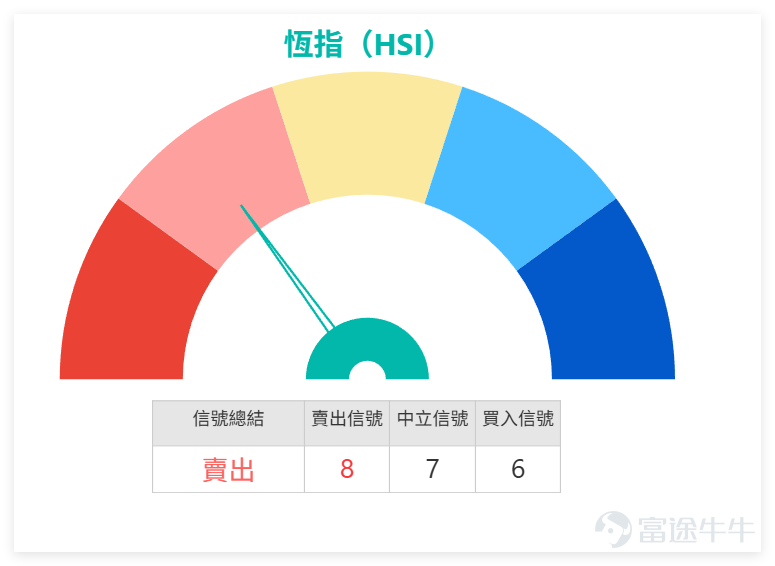

The Hang Seng Index technical indicators frequently show buy signals, with a short-term outlook neutral to slightly bullish.
On the previous day (March 11), the main Hong Kong stock indices: $Hang Seng Index (800000.HK)$
The HSTECH Index, Hang Seng China Enterprises Index, and others saw minor pullbacks. Individual stocks showed clear divergence, with technical indicators broadly signaling buy opportunities. The short-term market is exhibiting a consolidating bottoming pattern, viewed as moderately bullish.
In fact, in our 【HK Stock Broadcast】, we commented on the Hang Seng Index: On the previous day (11th), the Hang Seng Index ended slightly lower based on the closing price, closing at 25,898.76 points, with a single-day decline of 0.24%. Reviewing Tuesday’s (10th) session, the index rebounded from near the 24,900-point low. Over two trading days, it gained nearly 1,000 points, with the closing price reflecting a rebound of over 900 points—already quite close to the 1,000-point mark.
It is worth noting the performance of trading volume. Although stock prices stabilized, the trading value still saw a slight contraction, at only HKD 254.481 billion, reflecting that the market is temporarily in a wait-and-see state, without significant follow-up buying. The support level for the Hang Seng Index is at 25,355 points; if it breaks below 25,300 points, there may be further downside towards 24,500 points. Resistance is located at 26,600 points. The technology index also fell slightly by 0.11% on the same day, showing a synchronized pullback with the Hang Seng Index. From a technical signal perspective, sell signals currently have a slight edge, with 6 buy signals and 8 sell signals, making the short-term outlook less optimistic.

A minor pullback after two days of rebound is normal. The key focus will be whether subsequent trading can hold above critical support levels.
Performance of major blue-chip stocks on the previous day (11th) was mixed, with most closing lower but technical indicators generally showing buy signals, forming a divergence between falling prices and rising buy signals:
1. Tencent (00700): Closed at HKD 552.0, down 0.27% for the day. The share price is above the 10-day moving average (MA10) but below the MA30 and MA60. RSI stands at 56, with a technical buy signal (strength 7).
2. Hong Kong Exchange (00388): Closed at HKD 411.4, down 1.25% for the day, oscillating between moving averages, with strong technical buy signals (Strength 12).
3. AIA (01299): Closed at HKD 86.45, up 0.93% for the day, breaking above all moving averages, with technical sell signal (Strength 8).
4. Meituan (03690): Closed at HKD 77.4, down 2.15% for the day, with share price below multiple moving averages, RSI34 oversold, technical buy signal (Strength 9).
5. Construction Bank (00939): Closed at HKD 7.78, down 1.64% for the day, with share price below multiple moving averages, RSI44, technical buy signal (Strength 9).
6. Ping An (02318): Closed at HKD 63.5, slightly up 0.08% for the day, with share price below all moving averages, RSI39, technical buy signal (Strength 10).
7. ICBC (01398): Closing price at 6.22 yuan, down 0.96% in a single day, stock price under pressure of moving averages, RSI 41, technical signal indicates buy (strength 9).
8. China Mobile (00941): Closing price at 79.0 yuan, slightly up 0.25% in a single day, stock price oscillating between short-term and long-term moving averages, RSI 50, technical signal is neutral (strength 8).
9. HSBC Holdings (00005): Closing price at 133.0 yuan, down 2.13% in a single day, stock price broke below the short-term moving average but held above the medium- to long-term moving average, RSI 49, technical signal is neutral (strength 8).
Overall, most blue-chip stock prices are still trading below the moving averages; the trend has not fully strengthened, but technical indicators have frequently sent left-side trading signals.
Review and selection of call warrants and bull/bear products:
1. Warrant Review:
The Hang Seng Index-related warrant products recommended on March 5 performed well, with UBS Group's call warrant (23090) rising by 6% two days later, while the corresponding Hang Seng Index spot rose only 0.34% over the same period. This highlights the obvious leverage effect of warrants, but also reminds everyone that leverage comes with risk, so avoid blindly chasing highs.
2. Selected Warrant Products:
Based on the Hang Seng Index’s trend and technical signals, we’ve selected two call warrants with high cost-performance ratios suitable for investors expecting a short-term rebound in the index.
First: UBS Group call warrant (23090), leverage 14.9, strike price 26733, key feature is relatively low implied volatility, with controllable volatility risk, suitable for conservative investors.
Second: HSBC call warrant (23723), leverage 15.5, strike price 26733, premium and implied volatility are the lowest, offering strong cost-performance, suitable for investors seeking leverage with low-cost options.
Risk Warning: Warrants have expiration dates. Investors should be mindful of the product's maturity time, manage positions appropriately, and avoid risks associated with expiration.
The market showed a divergence of 'price drop but signals rise' on the previous day (11th), which is usually a technical sign of nearing a short-term bottom. Stay attentive, but do not blindly enter the market. Wait for confirmation signals such as volume increase and recovery above key moving averages. Warrant investments should be made according to one’s financial capacity; choose products with appropriate leverage based on your risk tolerance, and avoid excessive leverage.
After the Hang Seng Index rebounded nearly 1,000 points over two days, it has pulled back. What do you think this is:
A. The rebound is over, preparing to break below 25,300
B. A healthy pullback, about to break through 26,600
C. No direction, continue to stay flat
Feel free to share your insights in the comments section.
Reminder: This article does not constitute any investment advice.
This article is for reference only and does not constitute any investment advice. The market data, opinions, and analysis contained herein may change at any time without prior notice. We are not responsible for any loss or damage caused by reliance on the information in this article. Technical analysis only shows whether certain technical conditions are met; a comprehensive assessment of asset performance should be conducted using additional data. Decisions to trade should not be based solely on this article. Please note that past performance is not indicative of future results.
#HongKongStocks #HangSengIndex #RealTimeAnalysis #WarrantsSelection #WarrantsStrategy #DerivativesHedging #TencentHoldings #BlueChipStocks #TechnicalAnalysis
Risk Disclaimer: The above content only represents the author's view. It does not represent any position or investment advice of Futu. Futu makes no representation or warranty.Read more
Comments
to post a comment