
Hua Hong Semiconductor faced resistance and retreated, closely watching the 92 yuan level for a tug-of-war between buyers and sellers
$HUA HONG GRACE (01347.HK)$ The stock price today showed a clear pattern of 'surging high then retreating.' Although it initially rose to a high of 96.25 yuan, the increase could not be sustained, now trading at 92.25 yuan, reflecting heavy selling pressure above, forming a bearish pattern with a long upper shadow. The current stock price is significantly below the 30-day moving average (approximately 99.99 yuan), and is closely aligned with the 60-day moving average (approximately 92.04 yuan) in a struggle, making this level the most direct short-term battleground between bulls and bears.
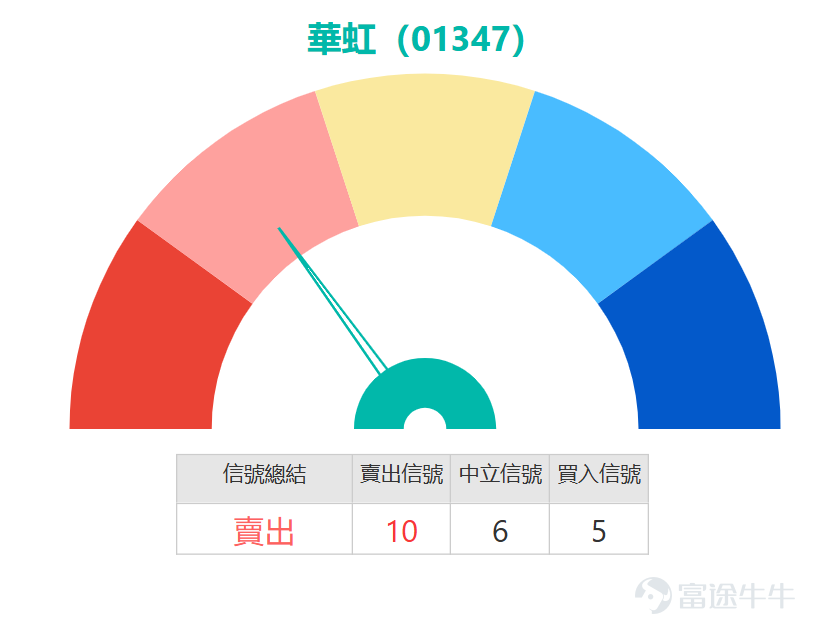
From a technical indicator perspective, market signals are contradictory but overall bearish. The Stochastic Oscillator (KD) and Williams %R indicators are neutral, showing no extreme oversold conditions, but also lacking reversal momentum. However, other key indicators are issuing bearish signals: MACD continues to show a sell signal, suggesting weak mid-term momentum; Bollinger Bands also indicate a sell signal, with the stock price operating within the lower-middle band, reflecting a possible downward shift in volatility range. Although the CCI indicator suggests 'severe oversold conditions, potentially bottoming out,' providing room for a potential rebound, the stock’s surge and retreat today has weakened the immediate validity of that signal. The ADX (Trend Strength Indicator) remains neutral, indicating that the strength of the current downtrend or consolidation is not particularly strong, which may offer some breathing space for the bulls from a technical standpoint.
Based on comprehensive technical analysis, the key support and resistance levels are as follows: the primary resistance level is located at 102.2 yuan, an important threshold for a recent rebound, requiring significant volume to break through to confirm a trend change; the secondary resistance level is at 108.8 yuan, where stronger resistance is anticipated. Below, the primary support level is at 86.3 yuan, and if breached, further downside space may open up; the secondary support level rests at 77.8 yuan, representing a long-term structural support level.
In summary, Hua Hong's short-term technical picture shows a situation of 'rebound facing resistance, structure tilting bearish.' Today's long upper shadow is a clear signal of renewed bearish pressure, reducing the likelihood of an immediate bottoming-out reversal due to CCI oversold conditions. Most trend indicators maintain a sell orientation, while oscillating indicators have yet to form a strong buy consensus.
In terms of operational strategy, now is not an ideal time to actively build positions. The stock price needs to first stabilize above the 60-day moving average (around 92 yuan), then break through 93.3 yuan (the upper shadow of today’s candle) to digest immediate selling pressure, thereby easing short-term downside risks. On the downside, the 86.3 yuan support level is critical and can be considered the last line of defense in the short term.


If you believe the stock price is likely to rebound after an adjustment, you may consider call warrants. Among them, $MSHUAHO@EC2605A.C (21582.HK)$ offers approximately 5.2x leverage with a strike price of 99.9 yuan. Its advantage lies in having the lowest premium and implied volatility among similar products, allowing it to track the underlying stock performance more directly. Another option, $HSHUAHO@EC2606B.C (21238.HK)$ has a strike price of 98.47 yuan with about 4.5x leverage. Its implied volatility is relatively low, which helps mitigate the impact of time decay.
If you are bearish on the market outlook and think the stock price might continue to decline, put warrants could be considered. $BIHUAHO@EP2607C.P (25020.HK)$ The strike price is 88 yuan, offering around 2.8x leverage. It features the lowest premium, and both its implied volatility and leverage levels are relatively ideal. $CIHUAHO@EP2611A.P (24659.HK)$ The strike price is 90 yuan; although the leverage is relatively lower at approximately 1.9x, it has the lowest implied volatility, and its leverage is already one of the highest within its category, making it suitable for investors who are bearish and focus on cost control.
For investors who are optimistic about the market outlook and can tolerate the risk of forced redemption, bull contracts provide higher leverage. $HS#HUAHORC2608F.C (68212.HK)$ The redemption price is 79 yuan, with actual leverage of about 5x, and it has the lowest premium. $BI#HUAHORC2612A.C (65970.HK)$ The redemption price is 77.2 yuan, with an actual leverage of about 4.5x, the highest among such products. It also has a relatively low premium, making it a good choice for aggressive strategies.
Conversely, if you believe the stock price will struggle to rebound and may fall further, you may consider bear contracts. $HS#HUAHORP2812A.P (63211.HK)$With a recovery price of 107 yuan, the actual leverage is approximately 7.4 times, combining the characteristics of the highest actual leverage and the lowest premium.$UB#HUAHORP2812J.P (65176.HK)$With a recovery price of 106 yuan, the actual leverage is about 8.1 times, also offering the advantages of high leverage and low premium, making it suitable for those who are bearish on the market outlook and seeking higher efficiency in their deployment.

What’s your take on today’s 'rally and pullback' movement for Huahong? Do you see it as short-term profit-taking or a signal of weakening overall momentum? Feel free to share your thoughts in the comment section. For more market analysis, stay tuned to 'HK Stock Warrants Jenny' for daily updates!
Reminder: This article does not constitute any investment advice.
This article is for reference only and does not constitute any investment advice. The market data, opinions, and analysis contained herein may change at any time without prior notice. We are not responsible for any loss or damage caused by reliance on the information in this article. Technical analysis only shows whether certain technical conditions are met; a comprehensive assessment of asset performance should be conducted using additional data. Decisions to trade should not be based solely on this article. Please note that past performance is not indicative of future results.
#HongKongStocks #HangSengIndex #RealTimeAnalysis #WarrantsSelection #WarrantsStrategy #DerivativesHedging #HongKongWarrantsJenny #HuahongSemiconductor #01347 #Semiconductors$Hang Seng Index (800000.HK)$$Hang Seng TECH Index (800700.HK)$
Risk Disclaimer: The above content only represents the author's view. It does not represent any position or investment advice of Futu. Futu makes no representation or warranty.Read more

Comments (2)
to post a comment
1