
US and Iran reach new ceasefire consensus! Will this time bring genuine "peace"?

HARVEST Macro | Global Financial Markets Weekly Report 20260311
Stock market
Review and Outlook of the Past Week
United States:
This week, global major stock indices experienced a rout across the board, with European and American markets weakening simultaneously. Both growth technology and value blue-chip stocks faced collective pressure in a deep correction. The core issue focused on the unexpected drop in US nonfarm payroll data, raising concerns about economic prospects, alongside escalating tensions in the Middle East driving up international oil prices, which exacerbated stagflation risks. Coupled with a significant rise in risk-averse sentiment, the three major US stock indexes plummeted deeply. The S&P 500 fell 2.02% this week; the Nasdaq Composite Index dropped 1.24%; and the Dow Jones Industrial Average declined 3.01%. Large-cap stocks weakened comprehensively, with the Dow particularly dragged down by financial and industrial sectors, compounded by the impact of private credit events, leading to widespread declines in related sector stocks. Small-cap stocks followed market sentiment downward, with funds generally adopting a wait-and-see, risk-averse stance. Wall Street's fear gauge, the VIX index, surged significantly to its highest level since April of last year.
Japan:
This trading week, the Japanese stock market exhibited a three-phase characteristic of 'fading benefits from memory chips - tech sector correction - high-level pressure and volatility.' The core driving factors revolved around the weakening momentum of global memory chip price hikes, reversal of foreign capital flows, and unilateral depreciation of the yen. Combined with profit-taking pressures from previous highs and increasing sector divergence, these factors led to an imbalance in the tug-of-war between bulls and bears, resulting in a volatile downward trend that ended the week with significant losses, halting the prior strong momentum. The key contradictions this week focused on three dimensions: first, the structural contradiction between declining prosperity in the memory chip and AI tech sectors versus traditional industries; second, the conflict between unilateral yen depreciation and the stability of export company profits; and third, the dual constraints of policy support versus high debt and interest rates. The Nikkei 225 index showed weakness throughout the week, experiencing a sharp decline, closing at 55620.84 points (-3229.43 points; up 3.12% year-to-date), ending its previous upward trend due to corrections in the tech sector and foreign capital outflows. Sector performance displayed characteristics of 'overall pressure, increased divergence': the tech sector led the market decline, with significant drops in semiconductor and AI-related stocks, as Kioxia's share price fell over 7% within the week, dragging down the index; traditional industries continued their weak performance, with synchronized declines in traditional manufacturing and utilities sectors. Only defensive sectors such as consumer goods and pharmaceuticals showed relatively controlled declines, unable to provide effective support.
Eurozone:
This trading week, European stock markets exhibited core features of 'volatile declines in pan-European indices, comprehensive weakness in core country indices, and intense pressure from multi-faceted tug-of-war.' The retreat of core inflation in the Eurozone, ECB’s stabilizing policies, and the provisional implementation of the EU-Mercosur Free Trade Agreement provided weak support. Meanwhile, fluctuations in U.S. tariff policies, unresolved internal divisions within the EU, and Germany’s sluggish manufacturing recovery formed the main suppressive forces. Coupled with imbalanced sector rotation (defensive sectors relatively resilient, while energy, mining, and traditional manufacturing led declines), a pattern of 'pan-European downward volatility and national-level comprehensive pressure' emerged. Market confidence in corporate earnings recovery continued to decline, with caution dominating market movements. At the pan-European level, the Stoxx 600 Index experienced volatile declines throughout the week, closing significantly lower at 589.69 points, down 24.94 points from last week, expanding its year-to-date loss to -2.55%, ending its previous upward trend with weakened upward momentum. Weekly movements showed characteristics of 'pressured volatility and continuous bottom probing': initially impacted by sudden changes in U.S. tariff policies and internal governance disagreements within the EU, the index opened sharply lower; midweek saw temporary rebounds due to the provisional implementation of the EU-Mercosur Free Trade Agreement and stabilizing statements from the ECB, but support was limited; later, concerns over the U.S. planning to raise tariffs to 15% and news of Germany's weak industrial recovery dragged the index down continuously, ultimately closing sharply lower. Core national indices all showed 'comprehensive weakness and narrowing divergence,' failing to hold prior support levels: the UK FTSE 100 Index proved relatively resilient, closing sharply lower at 10284.75 points, down 495.36 points from last week, with its year-to-date gain narrowing to +0.48%; France's CAC40 Index moved downward in sync, closing at 7993.49 points, down 400.83 points from last week, with a year-to-date loss of -3.61%, exhibiting 'unilateral volatile downward movement with weak rebounds' due to sluggish domestic economic recovery and pressured export sectors; Germany's DAX Index performed the weakest, closing at 23591.03 points, down 1046.97 points from last week, expanding its year-to-date loss to -6.74%, heavily affected by persistent manufacturing weakness and significant drag from the auto industry, with widespread component stock weakness becoming the largest decliner among core national indices; Italy's MIB Index also faced pressure, closing at 44152.26 points, down 2128.14 points from last week, with a year-to-date loss of -3.60%, suffering from clear market selling pressure due to internal EU divisions and trade policy disturbances.
Past Week Review
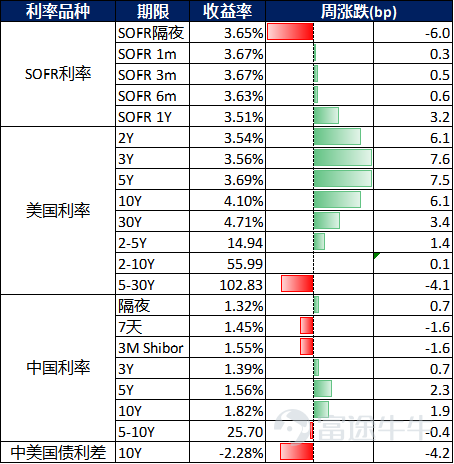
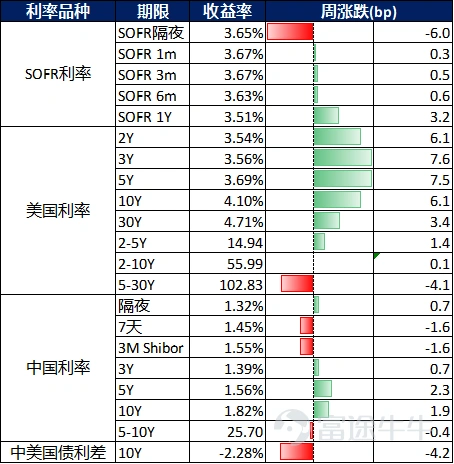
Last week, movements along the one-year SOFR curve were mixed; U.S. Treasury yields for the 2-year rose by 6.1bps, while those for the 10-year also climbed by 6.1bps. On the Chinese interest rate front, the 3-year government bond yield increased by 0.7bps, and the 10-year government bond yield rose by 1.9bps. The inversion of the China-U.S. 10-year yield spread stood at 228bps.
Source: Bloomberg and Harvest Fund Management
Government Bonds:This week, the market primarily followed headline developments regarding the Iran-Israel/US conflict in the Middle East. Since February 28, war has erupted around the Persian Gulf. Reports indicate that Iran’s Supreme Leader Khamenei was assassinated, and Tehran was bombed by U.S.-Israeli coalition forces. In retaliation, several neighboring Gulf countries were attacked by Iran’s drones and missiles. Tensions escalated further as, although the Strait of Hormuz has not been officially closed, ships have been lingering at its entrance awaiting passage permits, effectively blocking a significant portion of global crude oil and natural gas shipping. Subsequently, the world's largest natural gas export facility in Qatar was shut down over fears of an attack; European natural gas benchmark Dutch TTF futures nearly doubled during intraday trading this week. European markets suffered shocks, with substantial sell-offs in government bonds; the European Central Bank has almost entirely ruled out expectations of rate cuts, with year-end interest rate market pricing showing slightly more than one rate hike, while the Bank of England is only priced for less than one full rate cut this year. Similar adjustments occurred in U.S. short-term interest rate markets: expectations of rate cuts within the year dropped from about 60bps before the conflict to 44bps. In terms of data, aside from Friday's release of the February nonfarm payrolls report, this week's economic figures generally supported bond market sell-offs, as both the February ISM manufacturing and services data exceeded expectations, and initial jobless claims for the week ending February 28 came in below market forecasts. This week, the Treasury yield curve overall rose by approximately 14-22bps, with the middle section performing relatively poorly; SOFR OIS also saw a similar increase of 10-20bps. Looking ahead, closely monitor geopolitical developments to seek clues about the Fed's next monetary policy moves.
Credit bonds:This week, credit spreads for investment-grade Chinese dollar bonds widened overall by 2-5bps. As tensions in the Middle East escalated, risk aversion drove credit spreads of benchmark names to quickly widen by 5-9bps at Monday's opening. Subsequently, blockages at the Strait of Hormuz spurred oil price spikes, reigniting inflation concerns which pushed U.S. Treasury yields higher; however, market buying gradually increased, leading to a robust rebound and narrowing of credit spreads. For the full week, in the TMT sector, Meituan's dollar bond curve widened by 4-5bps under selling pressure following a ratings downgrade by S&P, while the 10-year Alibaba and 10-year Kuaishou dollar bond spreads remained flat compared to last week. In the financial sector, Industrial Bank's newly issued 3-year floating-rate bond was well-received by real money funds, with spreads narrowing by 3bps from the issuance level. Regarding Hong Kong dollar bonds, the 10-year Link REIT dollar bond spread narrowed by 10bps amid buying support.
Outlook:The unique risk of the 2026 U.S.-Israel-Iran conflict lies in the impact of the de facto blockade of the Strait of Hormuz. Approximately 21% of global crude oil and 25% of LNG pass through this route; any prolonged actual blockade would constitute the most severe energy supply crisis since 1973. Investors need to closely monitor the following key variables: the actual navigation status of the Strait of Hormuz, the speed and scale of OPEC+ production increases, the Fed's policy response to rising oil prices, and whether the conflict escalates into a ground war. From an asset allocation perspective, historical patterns suggest gradually increasing equity positions during panic sell-offs while using gold and defense sectors as hedging tools. However, given the energy supply disruption risks surpassing most previous conflicts (closer to the 'high impact' scenarios of the 1990 Gulf War and the 2022 Russia-Ukraine War), maintaining ample cash reserves and being vigilant against 'equity-bond double whammy' or even 'equity-bond-currency triple whammy' risks (if the conflict lasts longer than three months, prompting investors to start worrying about the U.S. government's fiscal condition, the U.S. Dollar Index might suddenly reverse downwards) are equally crucial.
We believe that: 1) Considering Iran's predominantly plateau and mountainous terrain, it currently appears unlikely that the U.S. and Israel will ultimately decide to deploy ground troops; 2) As long as the Pentagon does not send ground forces, the U.S. can withdraw at any time; 3) If we take into account the midterm elections on November 3 this year, a prolonged conflict (with excessive costs and casualties) is unlikely to be of interest to President Trump—although Trump's Friday post on his social platform Truth Social stating 'No agreement with Iran except unconditional surrender!' suggests the White House may be preparing for a protracted conflict, Trump's policies could suddenly shift again to disengage from Iran (another TACO), at which point market sentiment would abruptly change. Additionally, the February nonfarm payroll data released Friday evening by the U.S. Bureau of Labor Statistics signals a slowdown in the U.S. labor market, while oil prices continue to rise (approaching $100/barrel) due to the ongoing U.S.-Iran conflict, fueling and intensifying investors' inflation concerns. The U.S. 'stagflation' trading theme may receive greater market attention; currently benefiting from strengthened safe-haven demand, the U.S. dollar will eventually face backlash.
Foreign exchange market
Offshore Renminbi: This week, the market continued to trade around the Iran conflict and its spillover effects. Stock markets experienced significant volatility, with market volatility rising and USD/CNH spot rebounding over 1% to 6.94. The spot jumped to 6.9130 after Monday's opening, then retreated to 6.87 driven by the midpoint price, and during the night session, the spot continued to break upward. Due to earlier concentrated short positions in the dollar, stop-loss orders pushed USD/CNH spot again to 6.9345. Short-term fluctuations are expected to continue due to geopolitical influences, and the market is currently pricing in fewer than two Fed rate cuts this year.
US Dollar:With the Strait of Hormuz largely coming to a standstill due to rising insurance costs and geopolitical uncertainty, this week saw the dollar gap up at the open, immediately pressuring oil and gold. The key issue lies in Iran’s leadership transition – how long it will take for a new government to be established, and whether there will be any disruptions to oil supplies during the transition period. US President Trump stated that America's operations in Iran will continue "for as long as necessary," while more US troops are being deployed to the region. This military action undoubtedly drove up oil and gas prices sharply; for instance, following a drone attack on Qatar’s production facilities, European natural gas prices surged over 50%. Data-wise, strong US ISM Services Index figures for February (56.1 points, expected 53.5) and the ISM Manufacturing Price Index for February (70.5 points) indicate inflationary pressures are reflected in the data. Global sovereign bonds faced sell-offs, with Euro-American bond yields generally rising by 20bps as markets noticed central banks refocusing on stubborn inflation risks. The dollar remained favored, rising 1.2% amid widespread risk aversion. USD/JPY rebounded overnight to near the interest rate check level of 158.00. From the perspective of the US ISM Manufacturing PMI data, the rise in the payment price sub-index further strengthened the dollar against G10 currencies. Market focus now shifts to expectations of rate cuts, energy supply fluctuations impacting the Eurozone, and the upcoming US non-farm payroll report.
Macroeconomics
China:
This week, the National People's Congress convened. Premier Li Qiang of the State Council outlined this year’s main development targets in the government work report: GDP growth is expected to be between 4.5% and 5.0%, urban surveyed unemployment controlled around 5.5%, over 12 million new jobs created, consumer price increases about 2%, resident income growing in line with economic expansion, and maintaining basic balance in international payments. In terms of macro policies, a more proactive fiscal policy and moderately loose monetary policy will continue to be implemented, with a planned deficit ratio of 4%, amounting to 5.89 trillion yuan, alongside flexible use of reserve requirement ratio and interest rate cuts to ensure ample liquidity. People's Bank of China Governor Pan Gongsheng elaborated at a press conference that multiple monetary policy tools will be used comprehensively to maintain reasonable and adequate liquidity, strengthening coordination between fiscal and monetary policies, while emphasizing that China does not intend to gain trade advantages through currency depreciation and plans to improve mechanisms for issuing base money such as treasury bond buying and selling operations and deposit reserve systems. Regarding external environments, according to Bloomberg, US Treasury Secretary Bessent and Chinese Vice Premier He Lifeng are set to meet next weekend in Paris to discuss potential business cooperation opportunities following talks between their leaders.
United States:
Ongoing divisions within the Federal Reserve, coupled with disappointing February nonfarm payroll data, escalating tensions in the Middle East, and fluctuating tariff policies, constituted the core factors driving market dynamics this week. On March 6, Waller reiterated his inclination towards a 25-basis-point rate cut, suggesting that the oil price hike triggered by Middle Eastern tensions would be a one-off disturbance unlikely to cause persistent inflation. Meanwhile, San Francisco Fed President Daly indicated that the weak February jobs report deepened concerns about the labor market, but the inflation pressure from rising oil prices requires vigilance against dual-sided risks, advising against immediate rate cuts; Boston Fed President Collins and others advocated keeping rates unchanged “for some time.” These extreme differences have caused market expectations for rate cuts to remain volatile, with CME’s “FedWatch” showing increased betting on a June rate cut, though overall expectations are still fragmented, significantly raising policy uncertainty. Additionally, Trump has nominated Kevin Warsh to head the Federal Reserve, whose explicit stance on cutting rates could further exacerbate internal divisions at the Fed, adding another variable to subsequent policy directions.
On the core economic and market dynamics front, disappointing February nonfarm payroll data, escalating tensions in the Middle East pushing up oil prices, and Trump's fluctuating tariff policies were the three key variables affecting market movements this week. Economically, the US net loss of 92,000 jobs in February was far below market expectations of a 55,000 increase, marking the second negative monthly growth since 2020, with unemployment rising to 4.4%. The unexpected weakness in the job market raised concerns about a soft landing for the US economy, compounded by surging international oil prices driven by heightened Middle Eastern tensions, with WTI crude futures for April gaining 35.6% this week. JPMorgan pointed out that the Fed faces a tricky combination of sluggish economic performance and soaring oil prices. On trade policy, US tariff measures continued to unsettle markets this week. Following a February 20 ruling by the US Supreme Court deeming Trump's previous tariffs under the International Emergency Economic Powers Act as “overreach,” Trump promptly announced a 10% import tariff on global goods via the Trade Act of 1974, subsequently indicating an increase to 15%. With over 20 US states filing lawsuits to block these tariffs, and importers demanding tax rebates, tariff uncertainties severely disrupted market sentiment, triggering worries about rising US corporate costs and inflation rebounds, notably suppressing export-oriented sectors and intensifying market turbulence.
Japan:
Monetary Level: Unilateral yen weakening dominated market sentiment, with policy expectations diverging. This week, the yen showed unilateral weakness against both the dollar and renminbi, closely aligned with US-Japan interest rate differentials and global dollar liquidity forecasts, directly impacting exporters' profits and stock performance. The Bank of Japan maintained its current policy rate around 0.75%, making no new moves toward monetary normalization consistent with general market expectations, yet views on future policy paths remain starkly divided. The IMF previously issued a report warning the Bank of Japan to maintain independence and continue exiting monetary easing, aiming for a neutral interest rate by 2027. Recently, Japanese Prime Minister Sanae Takagi signaled tax cuts again, causing sharp fluctuations in the bond and forex markets, leading to a rapid yen depreciation and significant rises in long-term interest rates.
Fiscal Level: Policy benefits continued to be released, but high debt and high-interest rates formed dual constraints. Takagi Sanae's administration sustained momentum with a 21.3 trillion yen fiscal stimulus plan, focusing funds on infrastructure, consumption subsidies, and technological R&D to enhance competitiveness in the tech sector and alleviate pressures from sluggish traditional industries. However, Japan's fiscal risks remained elevated. For the fiscal year 2026, the government budget reached 122.3 trillion yen, setting a new record high. The IMF also cautioned the Japanese government to control fiscal expansion and avoid addressing livelihood issues by cutting consumption taxes, highlighting limitations in Japan's fiscal policy.
Industry Level: Tech sector corrections highlighted structural divergence. Momentum from the prolonged rally in memory chip prices waned, despite Kioxia announcing a first-quarter price hike for North American clients. Rising market concerns over the sustainability of price hikes and demand recovery led to significant pullbacks in semiconductor and other tech sectors, exacerbated by foreign capital outflows, substantially weakening support for tech investment tracks compared to previous robust performances. Implicit government support for the tech sector failed to offset declining economic conditions, with AI-related segments also under pressure. Traditional industries continued to struggle with slow transformation upgrades, compounded by structural challenges like aging populations and labor shortages, resulting in weak performances in traditional manufacturing and utility sectors, failing to provide market support and further increasing downward pressure on the stock market.
Europe:
The intertwining of policy stabilization and divergent disturbances continues to make uncertainty the main constraint in the market. On the monetary front, the European Central Bank (ECB) maintained the three key interest rates for the Eurozone unchanged this week, consistent with widespread market expectations. The deposit facility rate, the main refinancing rate, and the marginal lending rate were kept at 2.00%, 2.15%, and 2.40% respectively. ECB President Lagarde stated that the current monetary policy stance is 'in a good position' to address potential future shocks, but she also emphasized that the Eurozone still faces a turbulent global policy environment, and rising uncertainty could suppress demand, weighing on consumption and investment. Market institutions remain divided on the future policy path of the ECB. Some believe that core inflation might fall below 2% in the second half, making interest rate cuts more likely in the future. Others argue that escalating trade frictions and oil price volatility may bring inflationary rebound pressures, leading the ECB to maintain its current policy in the short term. On the fiscal and trade fronts, policy implementation and divergence coexist: The EU Carbon Border Adjustment Mechanism will gradually take effect starting January 1, 2026, covering 180 steel and aluminum-intensive downstream products, which creates cost pressure for economies reliant on traditional manufacturing while injecting long-term momentum into green and high-end manufacturing sectors. On February 27 local time, the European Commission announced the provisional application of the EU-Mercosur Free Trade Agreement, with Argentina and Uruguay having completed the approval procedures. This move is expected to further expand Europe’s trade space, bringing benefits to related export enterprises and providing a slight boost to market sentiment in the short term. However, due to internal divisions within the EU over the agreement, the European Parliament has submitted it to the EU Court for review, leaving long-term implementation uncertain. Additionally, divisions within the EU remain unresolved, as evidenced by secret meetings among countries like Italy, Germany, and Belgium discussing 'European competitiveness' without inviting certain member states, sparking accusations of forming 'cliques,' highlighting governance contradictions within the EU. Meanwhile, following the US Supreme Court ruling that Trump's previous tariff policies were unconstitutional, Trump swiftly announced a 10% import tariff on global goods effective from February 24, later stating he would raise the rate to 15%. The EU has urgently convened meetings to reassess the US-EU trade agreement; the European Parliament has even suspended voting related to the US-EU trade deal. France opposes the US 'green subsidies' clause, while Germany worries about damage to the automotive industry. Escalating US-EU trade tensions further unsettle market sentiment. On March 3, German Chancellor Mertz clearly stated during his meeting with Trump that the EU would not accept a worse US-EU trade agreement. The burden caused by tariffs has reached the limit of what the EU can tolerate. Coupled with ongoing conflicts in the Middle East and the deadlock between Russia and Ukraine, additional uncertainties are being added to the European market.
Global cyclical phase synchronization indicators:
China remains on the edge of recession; the probability of a US recession is low; Europe emerges from recession.
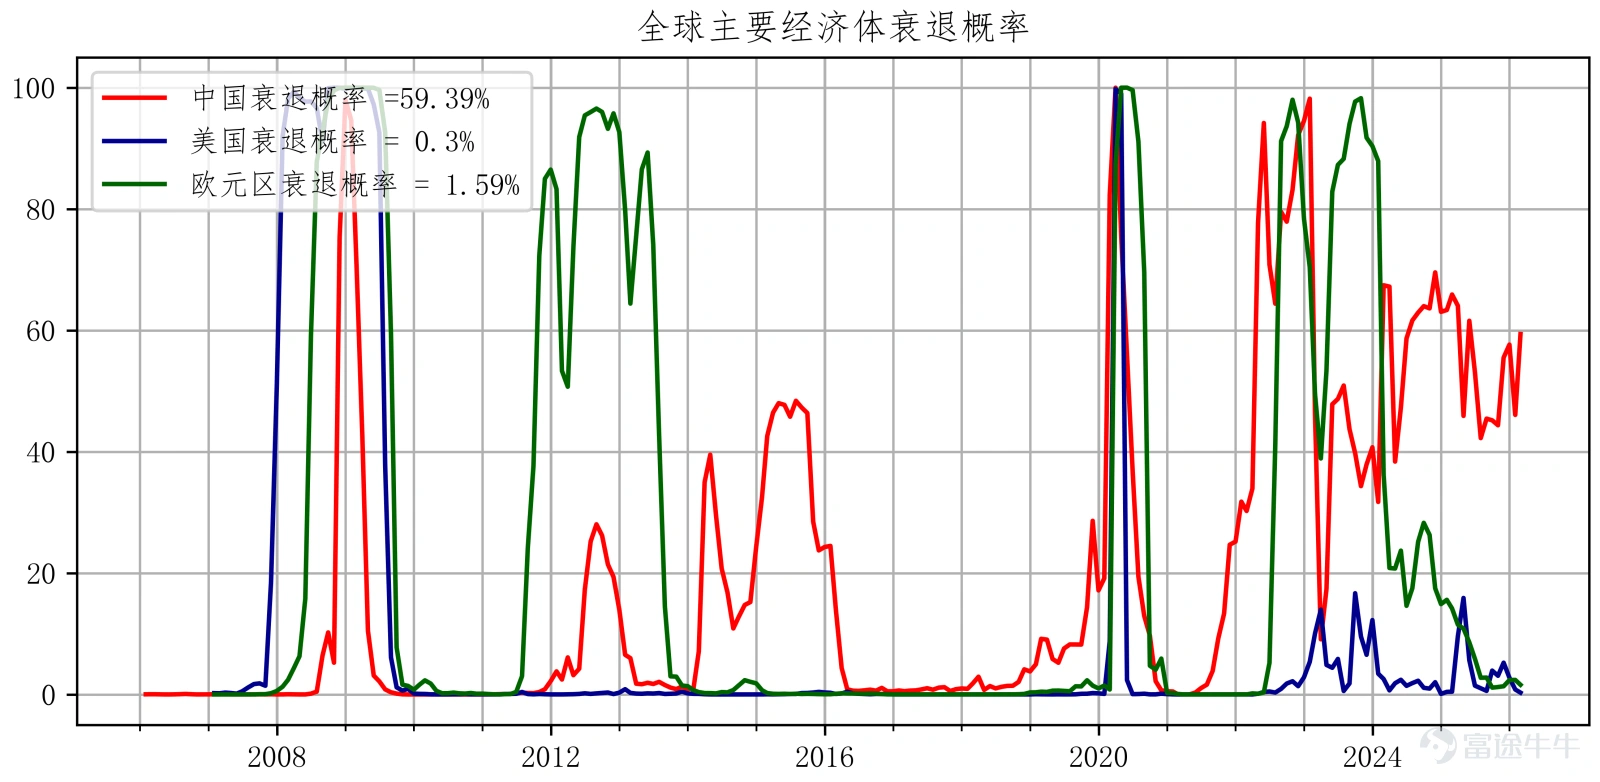
· China:Year-over-year real estate sales, year-over-year new real estate starts, year-over-year M1, year-over-year electricity generation, PMI new orders, auto sales
· United States:Unemployment-related indicators, real estate pre-sale permits, auto sales, consumer expectations, investor sentiment, new orders, stock drawdowns
· Eurozone:Economic activity indicators, real estate pre-sale permits, consumer confidence, manufacturing PMI, services PMI, credit spreads, stock drawdowns
Leading indicators of the global corporate earnings cycle
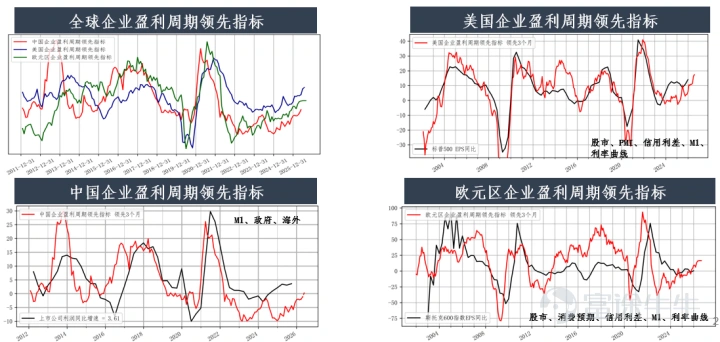
Growth LEI: Q1 China's economy may recover; European corporate earnings growth has stabilized; US corporate earnings growth is upward.
Source: Bloomberg and Harvest
Key economic data from last week (Source: Bloomberg and Harvest Fund:
• [The Federal Reserve released the latest issue of the Beige Book]:On March 5, the Federal Reserve released the latest issue of the Beige Book. It showed that economic activity in most regions of the United States grew at a slight to moderate pace in recent weeks, but an increasing number of regions reported that economic activity was flat or declining. Although employment levels remained generally stable, companies are seeking to leverage artificial intelligence to improve efficiency.
• [Bureau of Labor Statistics (BLS)]: Released: The non-farm payroll employment for February 2026 decreased by 92,000 people, compared with an increase of 130,000 in the previous value; the unemployment rate was recorded at 4.4%, up from the previous value of 4.3%. The February US non-farm data slowed more than expected due to multiple factors such as strikes, extreme weather, and AI technology industry changes. Meanwhile, this data exposed structural vulnerabilities in the US labor market under short-term shocks.
• [United States releases February ISM Manufacturing and Services PMI Index]: The Institute for Supply Management (ISM) announced that the US manufacturing index for February fell to 52.4, remaining in expansion territory for the second consecutive month, higher than the market expectation of 51.5 but lower than January's previous value of 52.6. According to ISM, the Manufacturing Purchasing Managers' Index® being above 47.5 over a period usually indicates overall economic expansion, hence the overall US economy has expanded for 16 consecutive months. On March 4, the Institute for Supply Management (ISM) announced that the US services index for February rose to 56.1, marking the 20th consecutive month of expansion, surpassing market expectations of 53.5 and January’s previous value of 53.8.
• [US February Non-Farm Data]: February non-farm payrolls decreased by 92,000, with unemployment slightly rising to 4.4%: On March 6, the Bureau of Labor Statistics (BLS) released non-farm payroll data showing that US non-farm employment (NFP) for February decreased by 92,000 people, against market expectations of an increase of 55,000 people and a rise of 126,000 people in January (initially reported as an increase of 130,000). Additionally, December’s new non-farm employment figures were revised down by 65,000 to -17,000 people. The US unemployment rate for February was 4.4% (precisely 4.441%), higher than market expectations of 4.3% and January’s previous value of 4.3% (precisely 4.322%). Average hourly earnings in February increased by 0.4% month-on-month and 3.8% year-on-year, versus expectations of 0.3% and 3.7%, and January’s previous values of 0.4% and 3.7%. The average weekly working hours in February were 34.3 hours, in line with expectations of 34.3 hours and January’s previous value of 34.3 hours.
• [China February PMI Data]: The manufacturing PMI stood at 49.0%, down by 0.3 percentage points from the previous month, with a notable seasonal decline due to factors such as the Spring Festival holiday; the non-manufacturing PMI was 49.5%, up by 0.1 percentage points; the composite PMI output index was 49.5%, down by 0.3 percentage points.
• [China's Government Work Report]: The Government Work Report proposed that the main expected targets for development this year are: economic growth of 4.5% to 5%, striving for better results in actual work; an urban surveyed unemployment rate of around 5.5%; over 12 million new urban jobs; consumer price inflation of about 2%; synchronization of income growth with economic growth; a basically balanced international payments; grain production of approximately 1.4 trillion jin; and a reduction of carbon dioxide emissions per unit of GDP by around 3.8%.
Disclaimer:
Investment involves risks, including possible loss of principal. Past performance or any forecasts or expectations do not indicate future performance. Before making investment decisions, investors should review relevant sales documents, including risk disclosures. Investment returns not denominated in Hong Kong dollars or US dollars are subject to exchange rate fluctuations.
The interests of this company are not offered or sold in Hong Kong through advertisements, invitations, or any other documents, except in cases where it does not constitute a public offering. This document has not been approved under the Securities and Futures Ordinance or the Companies Ordinance and is intended solely for authorized persons. It must not be distributed to unauthorized persons in Hong Kong or to unauthorized persons in any other jurisdiction. This material has not been reviewed by the Securities and Futures Commission of Hong Kong. For the purposes of this statement, 'authorized persons' shall mean professional investors as defined under the Securities and Futures Ordinance whose ordinary business involves purchasing, selling, or holding securities (whether as principals or agents). Distribution of this material may be restricted in certain jurisdictions.
In cases where it would be illegal to make an offer to any person within a jurisdiction, this document shall not be deemed as an offer or invitation to such persons. This document is for reference only and does not constitute any investment advice or recommendation, nor does it constitute an offer or invitation. It is not a basis for contracts involving the purchase or sale of any securities or instruments, nor is it a basis for Harvest Fund Management Co., Ltd., Harvest Global Investments Limited, or their affiliates to enter into or arrange any type of transaction based on the information contained herein.
Although the third-party information provided above is sourced from what should be reliable sources, neither Harvest Fund Management Co., Ltd., Harvest Global Investments Limited, their authorized issuers, affiliates, nor any of their directors or employees shall bear any responsibility for any errors or omissions therein. The information and opinions expressed herein are for reference only and may be adjusted without notice, and therefore should not be relied upon for making investment decisions. You should consult your investment advisor before making any investment decision.
The issuer of this document is Harvest Global Investments Limited. This document belongs to Harvest Global Investments Limited, which holds the copyright. Further circulation of this document is prohibited without the written consent of Harvest Global Investments Limited. All rights reserved.
All rights reserved ©2026 Harvest Global Investments Limited
Risk Disclaimer: The above content only represents the author's view. It does not represent any position or investment advice of Futu. Futu makes no representation or warranty.Read more
Comments
to post a comment