

After CATL's strong breakout, is the next step consolidation or a pullback?
Today (August 11), the strong upward momentum continued, with intraday prices surging over 10% at one point, reaching a high of 608 yuan.
Following the release of its earnings report, eight institutions unanimously gave positive ratings such as 'Buy,' 'Outperform,' or 'Overweight.' Four of them raised their target prices: BNP Paribas significantly increased its target price from 678 yuan to 728 yuan, an increase of 7.4%, which is currently the highest in the market; Haitong International, UOB Kay Hian, and CMBI also raised their targets by 38 yuan, 55 yuan, and 54 yuan respectively. The remaining four institutions, including UBS Group, J.P. Morgan, Jefferies, and Macquarie, kept their original target prices unchanged. The average target price among the eight institutions is currently 654.5 yuan, with the highest being BNP Paribas’ 728 yuan and the lowest being Macquarie’s 560 yuan.
This sharp rise has caused the stock price to consecutively break through several key moving averages, including the 10-day (504.38 yuan), 30-day (501.98 yuan), and 60-day (500.75 yuan) lines, forming an early technical 'bullish alignment' pattern. The short-term trend has shifted from volatility to a clear upward attack posture. However, behind this strong price performance, various technical indicators are issuing mixed signals, adding uncertainties to the short-term trend.
From the perspective of key oscillation indicators, market momentum coexists with potential overbought pressure. Stochastic Oscillator and CCI simultaneously issued 'buy signals,' indicating strong short-term upward momentum. However, the RSI has risen to the 60 level, nearing the traditional overbought zone, and gives a 'neutral' evaluation, suggesting that the momentum for chasing highs may face adjustments after rapid release. The Williams %R indicator is also in a 'neutral' state, reflecting that prices are operating at the edge of a strong range. Such combinations often occur mid-way through a breakout rally, signaling that while the uptrend remains intact, volatility may intensify.
The trend and momentum indicators are showing contradictory signals. The MACD indicator gives a 'sell signal,' diverging from the current strong upward momentum, which may stem from residual negative momentum that has not been fully absorbed. This divergence serves as a potential lagging warning that should be heeded. On the other hand, the Momentum Oscillator and Rate of Change (ROC) indicators both issue 'buy signals,' supporting the continuation of the uptrend. The ADX (Average Directional Index) remains in a 'neutral' state, indicating that the absolute strength of the trend has not yet entered an extremely strong zone. Both the Ichimoku Cloud and Bollinger Bands show 'buy' signals, with the stock price strongly challenging the upper band of the Bollinger Bands. If it holds above this level, it could indicate that the strong trend is likely to continue.
In terms of key price levels, the intraday price has broken through the second resistance level at 601 yuan, reaching as high as 608 yuan, breaking the original resistance range. New upside resistance needs to observe the previous high of 614 yuan or round-number levels; downside support has shifted higher to 511 yuan, with the second support level at 499 yuan (aligned with multiple long-term moving averages and previous consolidation zones).
In summary, for professional investors, the current technical pattern indicates that the short-term trend has clearly strengthened, and the strong breakout above the key resistance zone is an important positive signal. However, the RSI nearing overbought levels and the MACD sell-side divergence signal suggest that after the rapid rise, the market may not move straight upward but consolidate through volatility to digest pressure and build further momentum. Whether the stock can stabilize above the 600-yuan mark and challenge higher resistance areas will be a critical observation point for the short-term trend.


According to the latest statistical data, the two exercise price ranges with the highest street volume for CATL call warrants are 880-920 yuan (street volume accounting for 67.4%) and 620-640 yuan (street volume accounting for 20.3%). For put warrants, the two most concentrated exercise price ranges are 380-410 yuan (street volume accounting for 44.2%) and 350-360 yuan (street volume accounting for 23.1%). The most actively traded range is out-of-the-money call warrants between 600-660 yuan, with an average out-of-the-money degree of about 6% to 13%, and actual leverage levels ranging from 5x to 10x. The concentration of funds in this range mainly reflects optimism about CATL's short-term breakout potential, allowing investors to amplify returns through leverage while avoiding excessive time decay risks associated with deeper out-of-the-money options.
Bull and bear certificates exhibit clear regional clustering characteristics. The strike price intervals with the highest concentration of street volume are the 480-485 yuan bull certificate range (accounting for 5.65% of street volume) and the 600 yuan bear certificate range (accounting for 4.57% of street volume). The most actively traded interval is the 600 yuan bear certificate range, with a single-day trading volume reaching 1.488 million yuan, accounting for 38.2% of the total bull and bear certificate trading volume. Currently, this bear certificate has been called back.
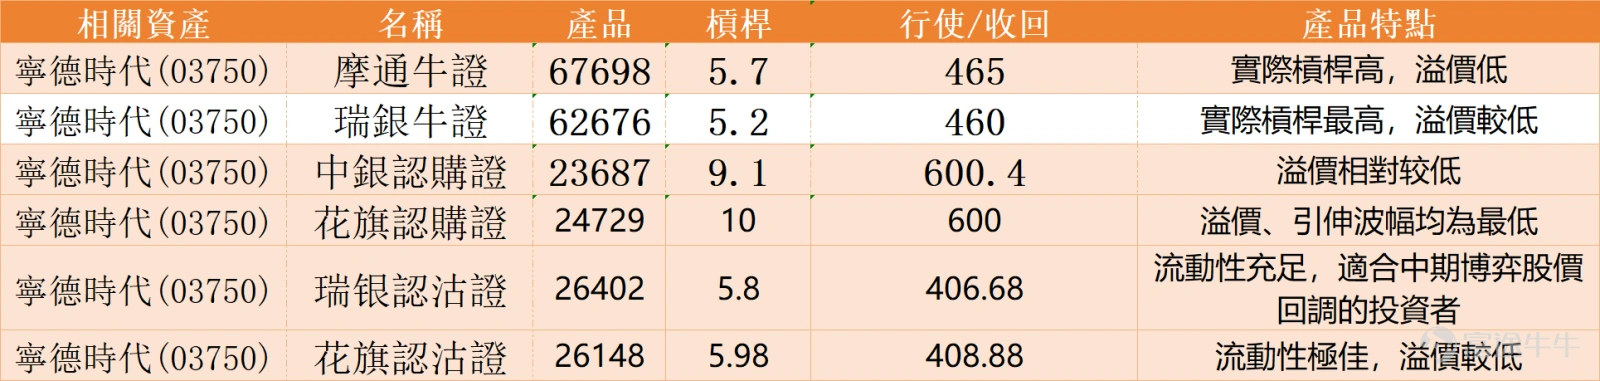
If the uptrend is expected to continue, investors may consider bull certificates or call warrants with higher leverage effects. $JP#CATL RC2609A.C (67698.HK)$ Offering approximately 5.7x actual leverage with a recall price set at 465 yuan, its advantage lies in relatively high actual leverage and low premium. Another option is $UB#CATL RC2609A.C (62676.HK)$ with approximately 5.2x actual leverage and a recall price of 460 yuan. The advantage of this product lies in offering relatively high actual leverage among similar products while maintaining a low premium, making it suitable for capturing short-term upward movements.
For investors who wish to avoid recall risk and have longer deployment time horizons, call warrants can be considered. $BI-CATL@EC2606B.C (23687.HK)$ With an exercise price of 600.4 yuan and approximately 9.1x actual leverage, its premium is relatively low, making it a balanced choice between cost and leverage. For those who prioritize holding costs, $CT-CATL@EC2606A.C (24729.HK)$Worthy of attention, with a strike price of 600 yuan and an actual leverage of about 10 times. This product has the lowest premium and implied volatility in comparison, effectively reducing the impact of time decay and volatility changes, making it suitable for medium-term bullish deployment.
Bearish direction products
Despite the upward market conditions, to hedge against potential pullback risks or implement bearish strategies, put warrants can be considered.$UB-CATL@EP2609A.P (26402.HK)$With a strike price of 406.68 yuan and actual leverage of approximately 5.8 times, its features include moderate street volume and sufficient liquidity, making it suitable for investors betting on medium-term technical pullbacks. Another excellent choice with high liquidity is$CT-CATL@EP2609A.P (26148.HK)$with a strike price of 408.88 yuan and actual leverage of about 5.98 times. This product not only offers good liquidity but also maintains a relatively low premium, providing investors who are bearish on the future market with a cost-effective option.
Several institutions have raised their target prices, with an average target price of 654.5 yuan, but the current stock price is already close to 600 yuan. What do you think is the remaining upside potential for the stock? Would you consider entering at the current level? Feel free to share your insights in the comment section. For more market analysis, stay tuned to 'HK Warrants Jenny' for daily updates!
Reminder: This article does not constitute any investment advice.
This article is for reference only and does not constitute any investment advice. The market data, opinions, and analysis contained herein may change at any time without prior notice. We are not responsible for any loss or damage caused by reliance on the information in this article. Technical analysis only shows whether certain technical conditions are met; a comprehensive assessment of asset performance should be conducted using additional data. Decisions to trade should not be based solely on this article. Please note that past performance is not indicative of future results.
#HongKongStocks #HangSengIndex #RealTimeAnalysis #WarrantsSelection #WarrantsStrategy #DerivativesHedging #HongKongWarrantsJenny #NingdeTimes #03750 #BlueChipStocks$Hang Seng Index (800000.HK)$$Hang Seng China Enterprises Index (800100.HK)$
Risk Disclaimer: The above content only represents the author's view. It does not represent any position or investment advice of Futu. Futu makes no representation or warranty.Read more

Comments
to post a comment
1
12