
Raising 'lobsters' drives up computing power demand! Where are the investment opportunities?

The level of rebound at 581 yuan will determine: The divergence between bulls and bears and the logic behind Tencent's rising volume and price
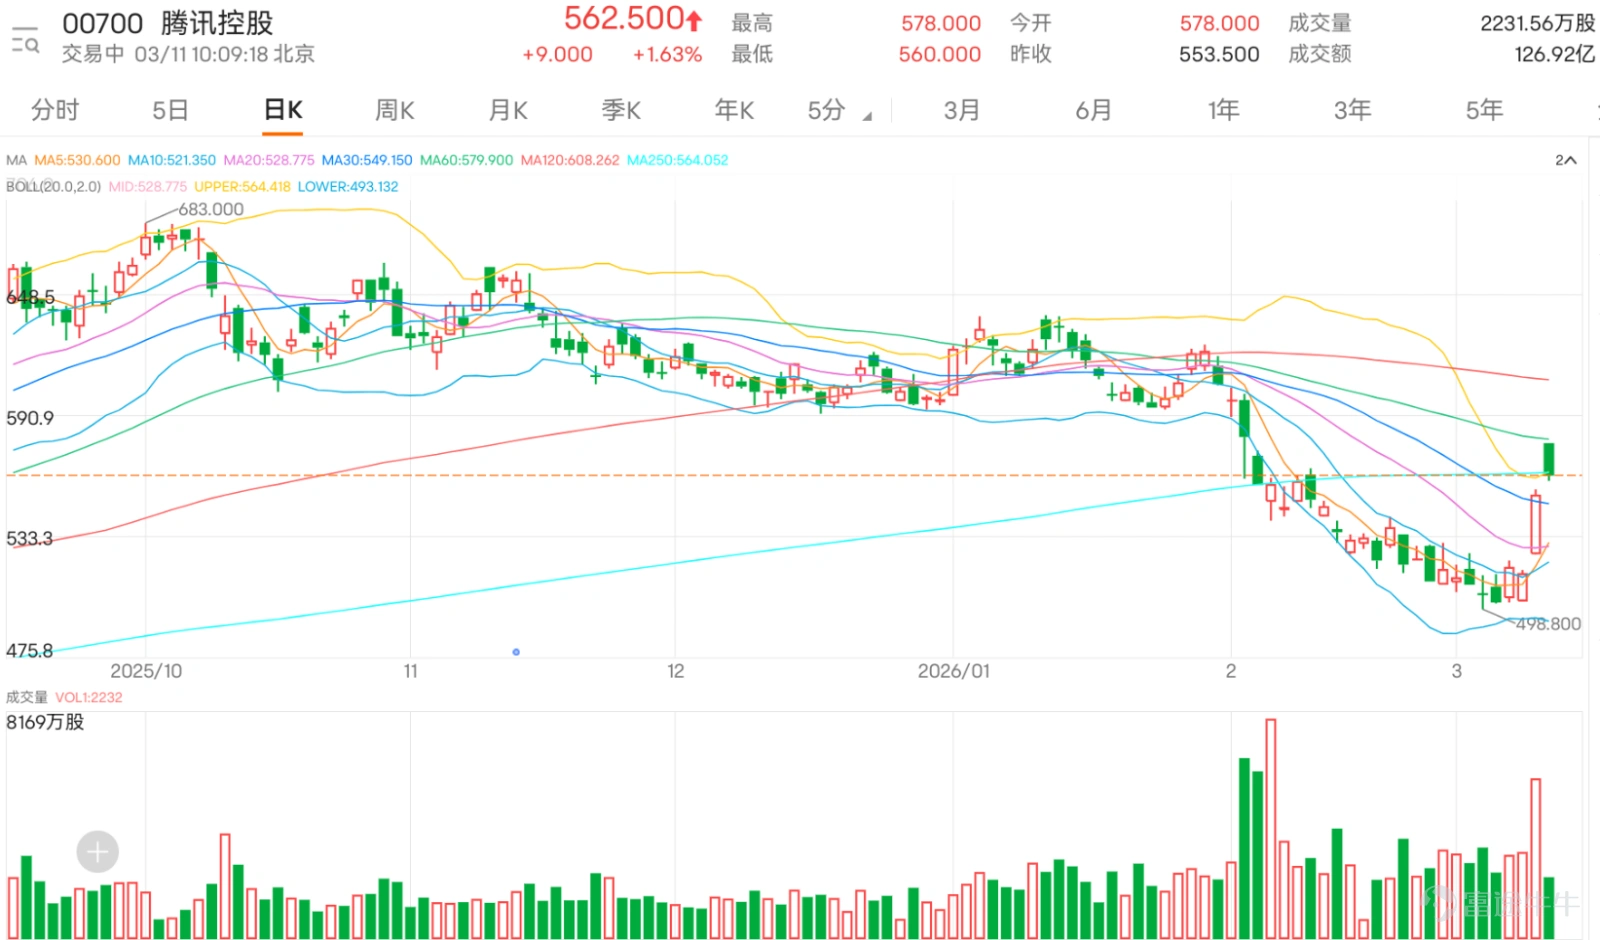
Following a strong surge on the previous day (August 10), today's opening (August 11) jumped another 4.43%, starting at 578 yuan, approaching the much-anticipated 60-day moving average (around 581 yuan) mark.
The stock price has already broken through the 10-day and 30-day moving averages with significant volume expansion, indicating active capital inflows and laying a solid foundation for the rebound. Currently, bulls and bears are contesting below 581 yuan, and whether it can break through successfully will be a key battle in determining the short-term rebound level.
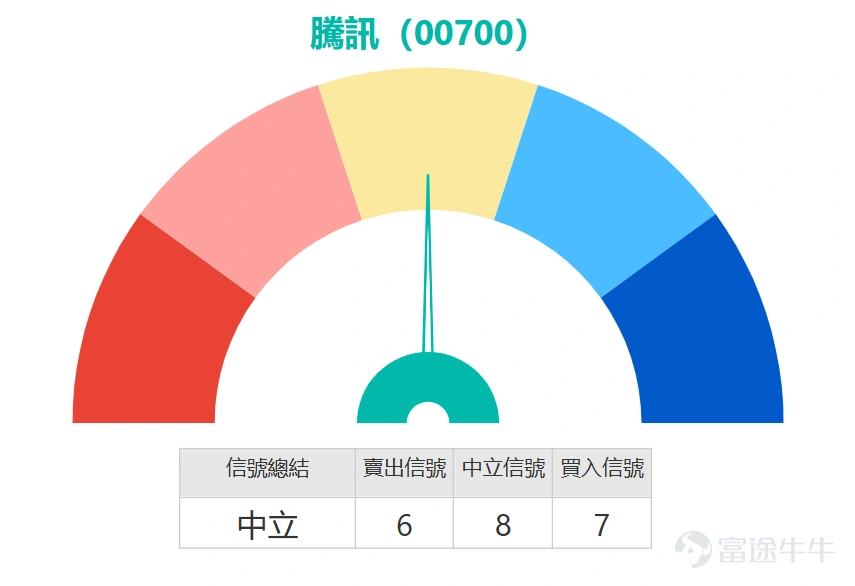
The support structure below is relatively clear, with the area around 518 yuan serving as the recent rebound starting point, almost overlapping with the 10-day moving average, forming an important short-term defense line. However, upward momentum is facing overbought pressure constraints. Both the Stochastic Oscillator and CCI indicators have issued overbought signals, suggesting a need for technical adjustment after consecutive gains; meanwhile, the Momentum Oscillator, Rate of Change indicator, and the more critical MACD signal have all turned to 'buy,' showing that medium-term trend momentum is strengthening. This divergence often appears in the early stages of a breakout, while the Bull-Bear Power indicator, Psychological Line, and Ichimoku Cloud’s 'severely oversold, possible bottoming' signals further reinforce the judgment that market sentiment has recovered from extreme pessimism. However, the ADX indicator shows that overall trend strength remains 'neutral,' meaning a one-way upward trend has not been fully confirmed yet—everything depends on the effectiveness of breaking through key resistance.
In summary, Tencent's short-term technical structure has significantly improved under capital support, showing a bullish pattern of bottoming out and rebounding. The core contradiction now lies in the confrontation between the strengthening medium-term momentum and short-term overbought pressures, with the 581 yuan to 589 yuan range becoming the battleground for bulls and bears. In terms of operational strategy, it is advisable to remain cautiously optimistic, treating 518 yuan as an important defensive line for short-term bulls.
If the stock price can digest overbought pressure through strong fluctuations and eventually break through and stabilize above the key resistance level of 581 yuan with substantial trading volume, the rebound potential could expand significantly towards higher targets. Conversely, if multiple attempts to rally fail and the price falls below 550 yuan (the 30-day moving average), the market may revert to a range-bound fluctuation pattern. Therefore, before confirming a decisive breakout at the critical resistance, chasing highs should be approached with extra caution, but near support levels, the technical structure presents more valuable short-term trading opportunities.
Following Tencent's significant rebound yesterday, the flow of funds in the derivatives market indicates that investor sentiment is becoming more cautious. The position in call warrants dropped by over 3%, reflecting that short-term capital generally opted to cash in profits, weakening subsequent upward momentum. Meanwhile, hedging demand surged sharply, with positions in put warrants and bearish certificates rising by 13% and 19%, respectively, showing that most investors anticipate a possible pullback after the short-term rebound and are pre-emptively positioning themselves in bearish products to hedge their stockholding risks. However, bullish certificate positions also rose by 6%, indicating that some funds remain optimistic about the medium-term outlook. The current divergence between bulls and bears is notable, and short-term volatility in the stock price is expected to intensify.
The current distribution of funds in Tencent's derivative products shows clear regional clustering characteristics:
Bullish products: The highest concentration of call warrants is in the out-of-the-money range of 620-630 yuan (street holdings account for 99.29%), with an average leverage of 9.2 times, 4.5 months until expiration, and an average implied volatility of 30.88%; the highest concentration of bullish certificates is in the 460-480 yuan range (street holdings account for 58.26%), with an average leverage of 6.5 times, 4-5 months until expiration, corresponding to short-term rebound speculation and medium-term bottom-fishing demand.
Bearish products: The highest concentration of put warrants is in the out-of-the-money range of 480-490 yuan (street holdings account for 29.61%), with an average leverage of 5.2 times, 9 months until expiration, and an average implied volatility of 31.85%; the highest concentration of bearish certificates is in the 740-780 yuan range (street holdings account for 27.78%), with an average leverage of 3.2 times, 2 years until expiration, corresponding to short-term speculative bets on declines and long-term hedging needs for holding shares.
Product Review
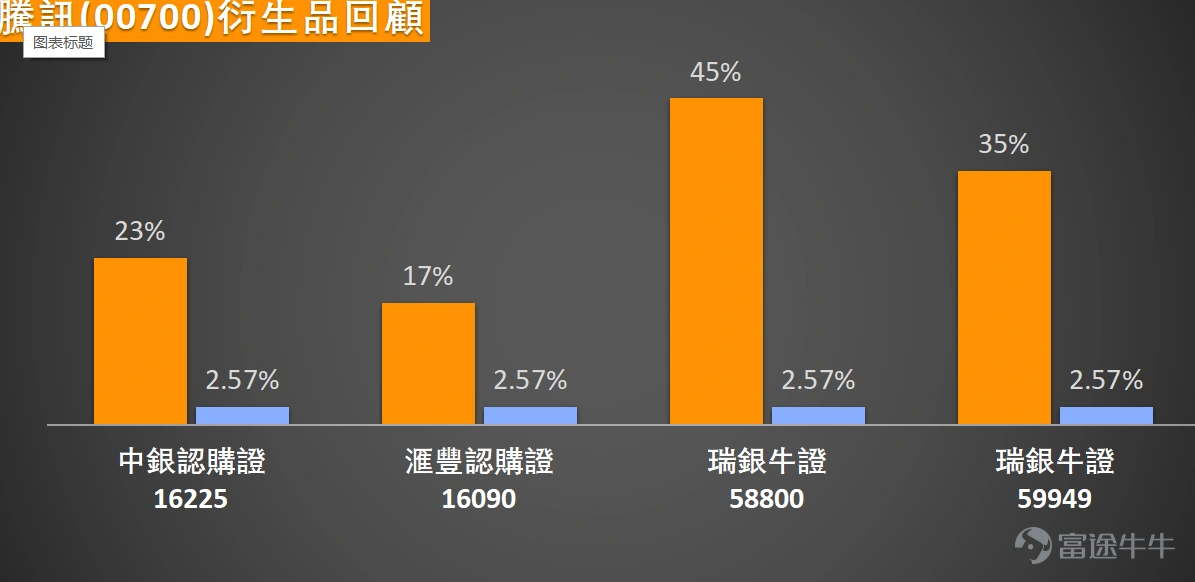
Tencent’s underlying stock rose cumulatively by 2.57% over two days after March 4, during the same period $BITENCT@EC2606A.C (16225.HK)$ Call warrants surged cumulatively by 23% over two days, $HSTENCT@EC2606A.C (16090.HK)$ Up 17%, $UB#TENCTRC2607T.C (58800.HK)$ up 45%, $UB#TENCTRC26076.C (59949.HK)$ up 35%
Product Highlights
For call warrants, $GJTENCT@EC2607A.C (23121.HK)$ with an exercise price of 622.72 yuan, leverage reaching 9.7 times, and both its premium and implied volatility being the lowest, making it suitable for investors optimistic about the future market. $BITENCT@EC2608E.C (26418.HK)$ Strike price 629.38, leverage 7.9 times, relatively low implied volatility, offering a stable bullish option.
For put warrants, $BITENCT@EP2606A.P (23122.HK)$ Strike price 499.8, leverage 9.1 times, lowest premium with ideal implied volatility and leverage, making it a high-quality tool for bearish markets. $UBTENCT@EP2606A.P (21984.HK)$ Strike price also 499.8, leverage 8.5 times, relatively low implied volatility, providing better risk control.
In the bull certificate section, $BI#TENCTRC2612K.C (62650.HK)$ Recovery price 489, leverage 7.3 times, relatively low premium, suitable for tracking upward trends. $UB#TENCTRC26076.C (59949.HK)$ Recovery price 480, leverage 7.1 times, also relatively low premium, offering similar bullish exposure.
As for bear certificates, $BI#TENCTRP2812D.P (57847.HK)$ Recovery price 585, leverage 16.5 times, relatively low premium, suitable for bearish markets. $UB#TENCTRP2812K.P (57563.HK)$ Recovery price 590, leverage 16 times, lowest premium with higher actual leverage, an efficient bearish tool.

Do you think Tencent's current rebound will successfully break through the 60-day moving average at HKD 581? What is your target for the first upside level? The significant rise in put warrants and bearish contracts indicates heightened demand for hedging among investors. What tools would you choose to hedge the short-term pullback risk of Tencent? Feel free to share your insights in the comments section. For more market analysis, stay tuned to 'HK Stock Warrants Jenny' for daily updates!
Reminder: This article does not constitute any investment advice.
This article is for reference only and does not constitute any investment advice. The market data, opinions, and analysis contained herein may change at any time without prior notice. We are not responsible for any loss or damage caused by reliance on the information in this article. Technical analysis only shows whether certain technical conditions are met; a comprehensive assessment of asset performance should be conducted using additional data. Decisions to trade should not be based solely on this article. Please note that past performance is not indicative of future results.
#Hong Kong stocks #Hang Seng Index #Real-time analysis #Warrants selection #Warrants strategy #Derivatives hedging #HK stocks warrants Jenny #Tencent #00700 $Hang Seng Index (800000.HK)$$Hang Seng TECH Index (800700.HK)$$Hang Seng China Enterprises Index (800100.HK)$
Risk Disclaimer: The above content only represents the author's view. It does not represent any position or investment advice of Futu. Futu makes no representation or warranty.Read more

Comments
to post a comment
1
12