
Xiaomi's key platform fluctuates, where will the future trend go?
$XIAOMI-W (01810.HK)$ Despite a 0.65% decline against the market trend, Xiaomi’s latest price stands at HKD 33.46. Recently, it has been oscillating between HKD 31.2 and HKD 35.8. Notably, the current share price is below MA10 (33.51) and MA30 (34.99), continuing to trade under MA60 (37.04). The mid-term and short-term moving averages are in a bearish arrangement, indicating that the technical aspect remains in a weak consolidation phase. However, recent institutional movements have shown subtle changes: CLSA upgraded its investment rating from 'Buy' to 'Overweight', lowering the target price from HKD 60 to HKD 45; Goldman Sachs also maintained a 'Buy' rating, adjusting the target price from HKD 47.5 to HKD 41.
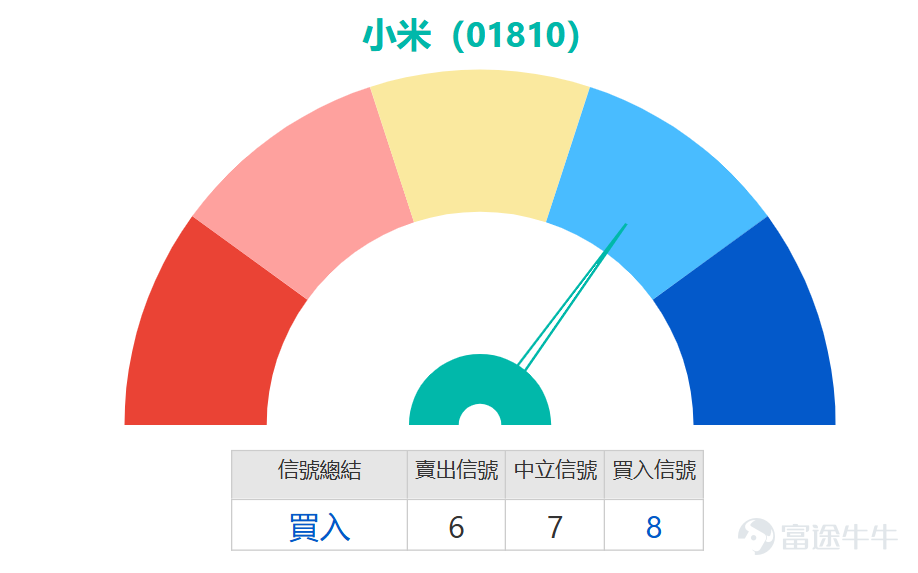
The summary signal of Xiaomi’s technical indicators gives a 'Buy' rating with an intensity of 8, implying that some momentum indicators have entered oversold or rebound酝酿 zones. However, multiple oscillation indicators like the Stochastic Oscillator and Williams %R remain neutral, showing unclear short-term direction, while CCI and MACD indicators issue sell signals, reflecting weaker mid-term trend momentum. This divergence often suggests that the stock price is at a critical decision-making window — if buying momentum can accumulate, it might trigger a technical rebound; conversely, if selling pressure persists, it may further test for support.
In terms of support and resistance, the primary support level 1 is located at HKD 32.1. If this position fails, it may further test support level 2 at HKD 29.9, which is expected to attract strong buying interest. On the upside, resistance level 1 is set at HKD 35.7, near the recent high point. A break above this could challenge resistance level 2 at HKD 37.1, coinciding with MA60, marking a key observation point for whether the mid-term trend will strengthen.
In summary, Xiaomi’s current share price is still constrained by the moving average system, with some trend indicators skewed bearish. However, the overall technical signal strength indicates that oversold rebound momentum is accumulating. Operationally, if the share price can hold above HKD 32.1 support accompanied by increased trading volume, the probability of a short-term rebound testing resistance at HKD 35.7 will rise. Conversely, if there is heavy selling breaking below HKD 32.1, caution is needed for further downside risk. For professional investors, the current situation can be viewed as an observation range with coexisting risks and opportunities, warranting a range-bound trading approach while closely monitoring trading volumes and potential synchronizations of technical indicator improvements.


Product review: Xiaomi Group (01810) mentioned on March 4, 2026 saw a positive return of 4.44% in the following two trading days after being mentioned. $SG#XIAMIRC2609I.C (59415.HK)$ , rising by 76% in two days, another one $SG#XIAMIRC2611B.C (55965.HK)$ surged as much as 90%, while the other two call warrant products also recorded considerable gains, $HSXIAMI@EC2612C.C (22791.HK)$ with a rise of 20% in two days, $BIXIAMI@EC2612A.C (13186.HK)$ showing a gain of 27%,

If you are bullish on Xiaomi's future performance, you may consider $BIXIAMI@EC2612A.C (13186.HK)$ , with an exercise price of 37.15 yuan, offering about 4.5x leverage, characterized by implied volatility at the lowest level among similar products, and higher leverage to effectively track the underlying stock’s performance. Another option is $HSXIAMI@EC2612C.C (22791.HK)$ , with an exercise price of 37.12 yuan, also providing around 4.5x leverage. Its biggest advantage is the lowest premium, while its implied volatility and leverage levels are relatively ideal, offering an efficient bullish tool.
If you are bearish on Xiaomi’s outlook, you can consider $BIXIAMI@EP2607B.P (23123.HK)$ , with an exercise price of 29.86 yuan, offering about 6x leverage, and both its premium and implied volatility are among the lowest in the market, providing better downside protection. Another bearish option is $HSXIAMI@EP2607A.P (23111.HK)$ , with the same exercise price of 29.86 yuan, providing about 5.8x leverage, with ideal leverage and implied volatility, allowing it to capture potential downward movements in the stock price.
For investors who prefer bull and bear certificates, there are two bull contracts available for bullish deployment.$UB#XIAMIRC2608A.C (60038.HK)$and$JP#XIAMIRC2609E.C (67453.HK)$The recovery price is HK$31, offering approximately 9.4 times actual leverage with the lowest premium and relatively higher actual leverage. For bearish deployment,$BP#XIAMIRP2806M.P (68068.HK)$the recovery price is HK$39.8, providing approximately 5.9 times actual leverage.$UB#XIAMIRP2812D.P (68847.HK)$the recovery price is HK$39, with actual leverage of about 7 times. Its premium is the lowest among similar products, and its actual leverage is also relatively high.

Regarding CLSA’s seemingly contradictory move of 'upgrading the rating while lowering the target price,' what signal do you think this is more likely to convey? Feel free to share your insights in the comment section. For more market analysis, please stay tuned to Jenny's daily updates on 'HK Stock Warrants'!
Reminder: This article does not constitute any investment advice.
This article is for reference only and does not constitute any investment advice. The market data, opinions, and analysis contained herein may change at any time without prior notice. We are not responsible for any loss or damage caused by reliance on the information in this article. Technical analysis only shows whether certain technical conditions are met; a comprehensive assessment of asset performance should be conducted using additional data. Decisions to trade should not be based solely on this article. Please note that past performance is not indicative of future results.
#HongKongStocks #HangSengIndex #RealTimeAnalysis #WarrantsSelection #WarrantsStrategy #DerivativesHedging #HongKongWarrantsJenny #BlueChipStocks #Xiaomi #01810$Hang Seng Index (800000.HK)$$Hang Seng TECH Index (800700.HK)$
Risk Disclaimer: The above content only represents the author's view. It does not represent any position or investment advice of Futu. Futu makes no representation or warranty.Read more


Comments
to post a comment
2