
English
Back
Open Account
米股研究
wrote a post · Mar 10 11:45

Technical Analysis of Popular US Sector ETFs (March 10): Semiconductors/Software/AI/Real Estate/Finance/Technology/Communications/Consumer Discretionary/Industrials/Materials/Energy/Consumer Staples/Healthcare/Utilities

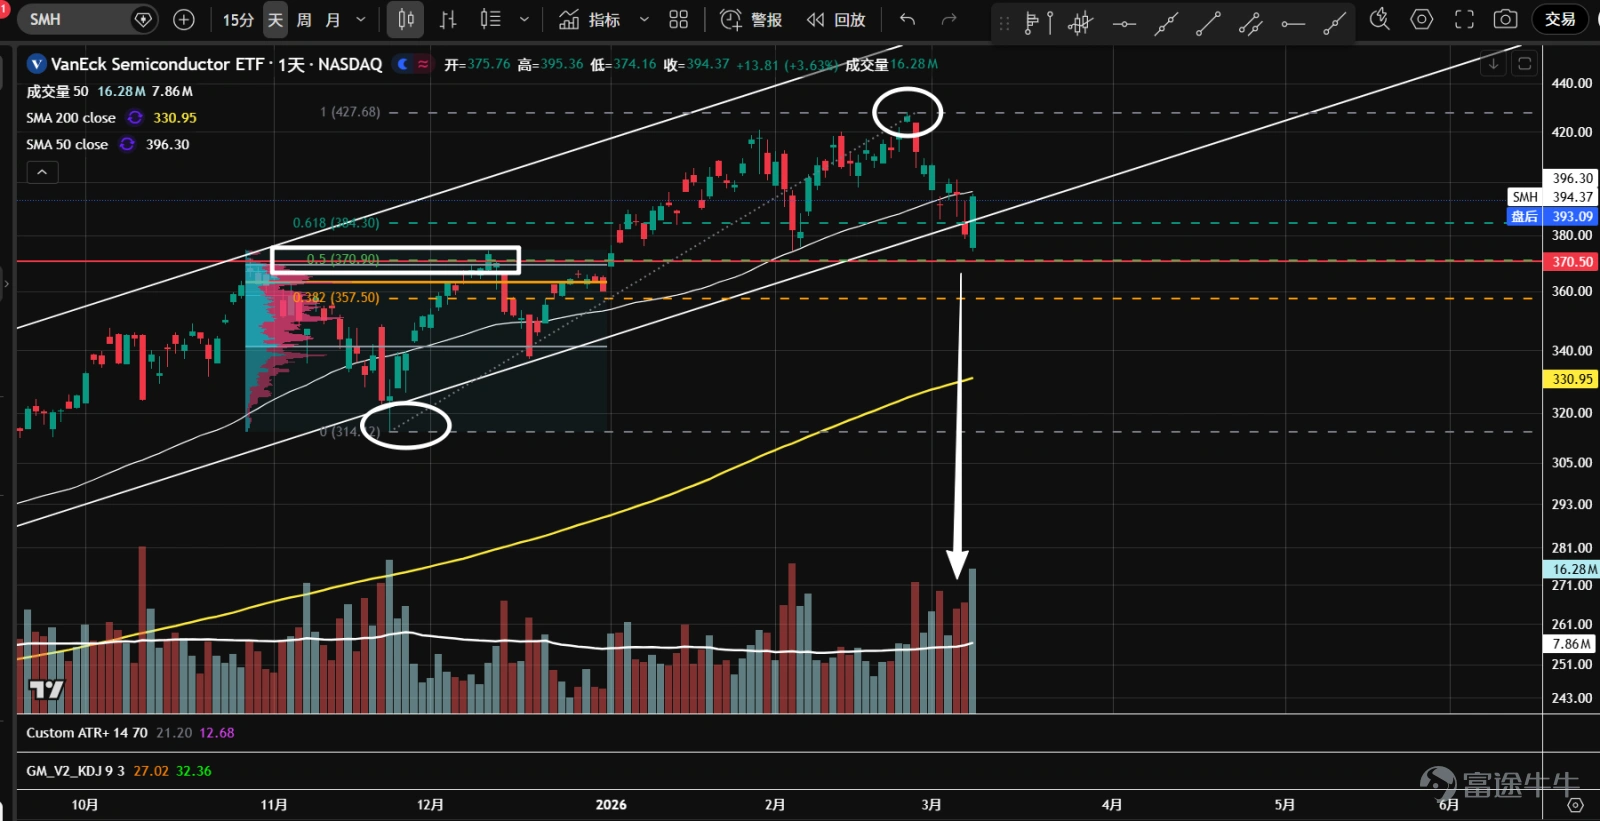
1、 $VanEck Semiconductor ETF (SMH.US)$ Since the end of January, it has faced resistance three times at the 420 level. Starting from the end of February, there was a significant increase in trading volume accompanied by a decline, indicating supply pressure. The 370 level represents the 50% retracement of the previous upward wave and is also a pivotal point. In this area, the increase in trading volume with limited downside indicates potential institutional accumulation; overnight, an outsized bullish candle appeared, suggesting bulls are in control.
1、 $VanEck Semiconductor ETF (SMH.US)$ Since the end of January, it has faced resistance three times at the 420 level. Starting from the end of February, there was a significant increase in trading volume accompanied by a decline, indicating supply pressure. The 370 level represents the 50% retracement of the previous upward wave and is also a pivotal point. In this area, the increase in trading volume with limited downside indicates potential institutional accumulation; overnight, an outsized bullish candle appeared, suggesting bulls are in control.   2、 $iShares Expanded Tech-Software Sector ETF (IGV.US)$ At the beginning of February, support emerged around the 78 level, accompanied by panic selling and a rebound on reduced volume, followed by further declines. After breaking below the 78 support level, heavier volume occurred, followed by a rebound to recover losses, forming a shakeout pattern. Amidst a falling broader market, prices continued to rise, closing near highs with overall trading volume expanding. Traders are now waiting for a pullback on lower volume to establish long positions.  3、 $Global X Artificial Intelligence & Technology ETF (AIQ.US)$ Since October of last year, the asset has been consolidating in a sideways range. After a false breakout above in late January, it declined continuously, with overall trading volume increasing, showing bearish price-volume dynamics and clear distribution characteristics. Currently, consecutive record volumes have appeared near the support level, with significant price fluctuations and fierce battles between bulls and bears; judging by the closing position, bulls have temporarily gained the upper hand.  4、 $Real Estate Select Sector Spdr Fund (The) (XLRE.US)$ Since mid-February, it broke through...
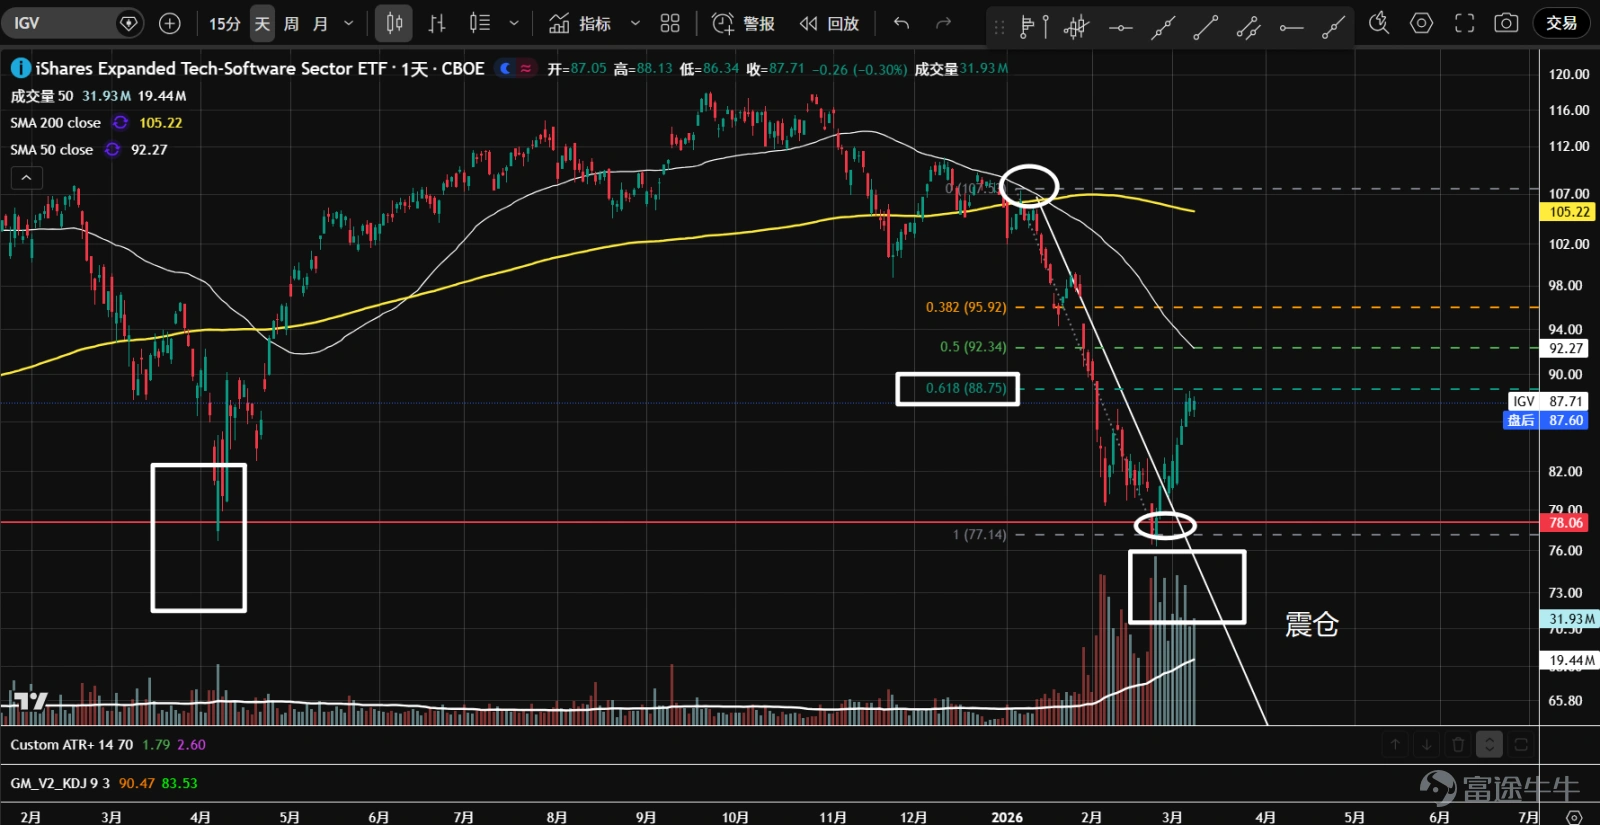
2、 $iShares Expanded Tech-Software Sector ETF (IGV.US)$ At the beginning of February, support emerged around the 78 level, accompanied by panic selling and a rebound on reduced volume, followed by further declines. After breaking below the 78 support level, heavier volume occurred, followed by a rebound to recover losses, forming a shakeout pattern. Amidst a falling broader market, prices continued to rise, closing near highs with overall trading volume expanding. Traders are now waiting for a pullback on lower volume to establish long positions.
1、 $VanEck Semiconductor ETF (SMH.US)$ Since the end of January, it has faced resistance three times at the 420 level. Starting from the end of February, there was a significant increase in trading volume accompanied by a decline, indicating supply pressure. The 370 level represents the 50% retracement of the previous upward wave and is also a pivotal point. In this area, the increase in trading volume with limited downside indicates potential institutional accumulation; overnight, an outsized bullish candle appeared, suggesting bulls are in control.   2、 $iShares Expanded Tech-Software Sector ETF (IGV.US)$ At the beginning of February, support emerged around the 78 level, accompanied by panic selling and a rebound on reduced volume, followed by further declines. After breaking below the 78 support level, heavier volume occurred, followed by a rebound to recover losses, forming a shakeout pattern. Amidst a falling broader market, prices continued to rise, closing near highs with overall trading volume expanding. Traders are now waiting for a pullback on lower volume to establish long positions.  3、 $Global X Artificial Intelligence & Technology ETF (AIQ.US)$ Since October of last year, the asset has been consolidating in a sideways range. After a false breakout above in late January, it declined continuously, with overall trading volume increasing, showing bearish price-volume dynamics and clear distribution characteristics. Currently, consecutive record volumes have appeared near the support level, with significant price fluctuations and fierce battles between bulls and bears; judging by the closing position, bulls have temporarily gained the upper hand.  4、 $Real Estate Select Sector Spdr Fund (The) (XLRE.US)$ Since mid-February, it broke through...
3、 $Global X Artificial Intelligence & Technology ETF (AIQ.US)$ Since October of last year, the asset has been consolidating in a sideways range. After a false breakout above in late January, it declined continuously, with overall trading volume increasing, showing bearish price-volume dynamics and clear distribution characteristics. Currently, consecutive record volumes have appeared near the support level, with significant price fluctuations and fierce battles between bulls and bears; judging by the closing position, bulls have temporarily gained the upper hand.
1、 $VanEck Semiconductor ETF (SMH.US)$ Since the end of January, it has faced resistance three times at the 420 level. Starting from the end of February, there was a significant increase in trading volume accompanied by a decline, indicating supply pressure. The 370 level represents the 50% retracement of the previous upward wave and is also a pivotal point. In this area, the increase in trading volume with limited downside indicates potential institutional accumulation; overnight, an outsized bullish candle appeared, suggesting bulls are in control.   2、 $iShares Expanded Tech-Software Sector ETF (IGV.US)$ At the beginning of February, support emerged around the 78 level, accompanied by panic selling and a rebound on reduced volume, followed by further declines. After breaking below the 78 support level, heavier volume occurred, followed by a rebound to recover losses, forming a shakeout pattern. Amidst a falling broader market, prices continued to rise, closing near highs with overall trading volume expanding. Traders are now waiting for a pullback on lower volume to establish long positions.  3、 $Global X Artificial Intelligence & Technology ETF (AIQ.US)$ Since October of last year, the asset has been consolidating in a sideways range. After a false breakout above in late January, it declined continuously, with overall trading volume increasing, showing bearish price-volume dynamics and clear distribution characteristics. Currently, consecutive record volumes have appeared near the support level, with significant price fluctuations and fierce battles between bulls and bears; judging by the closing position, bulls have temporarily gained the upper hand.  4、 $Real Estate Select Sector Spdr Fund (The) (XLRE.US)$ Since mid-February, it broke through...
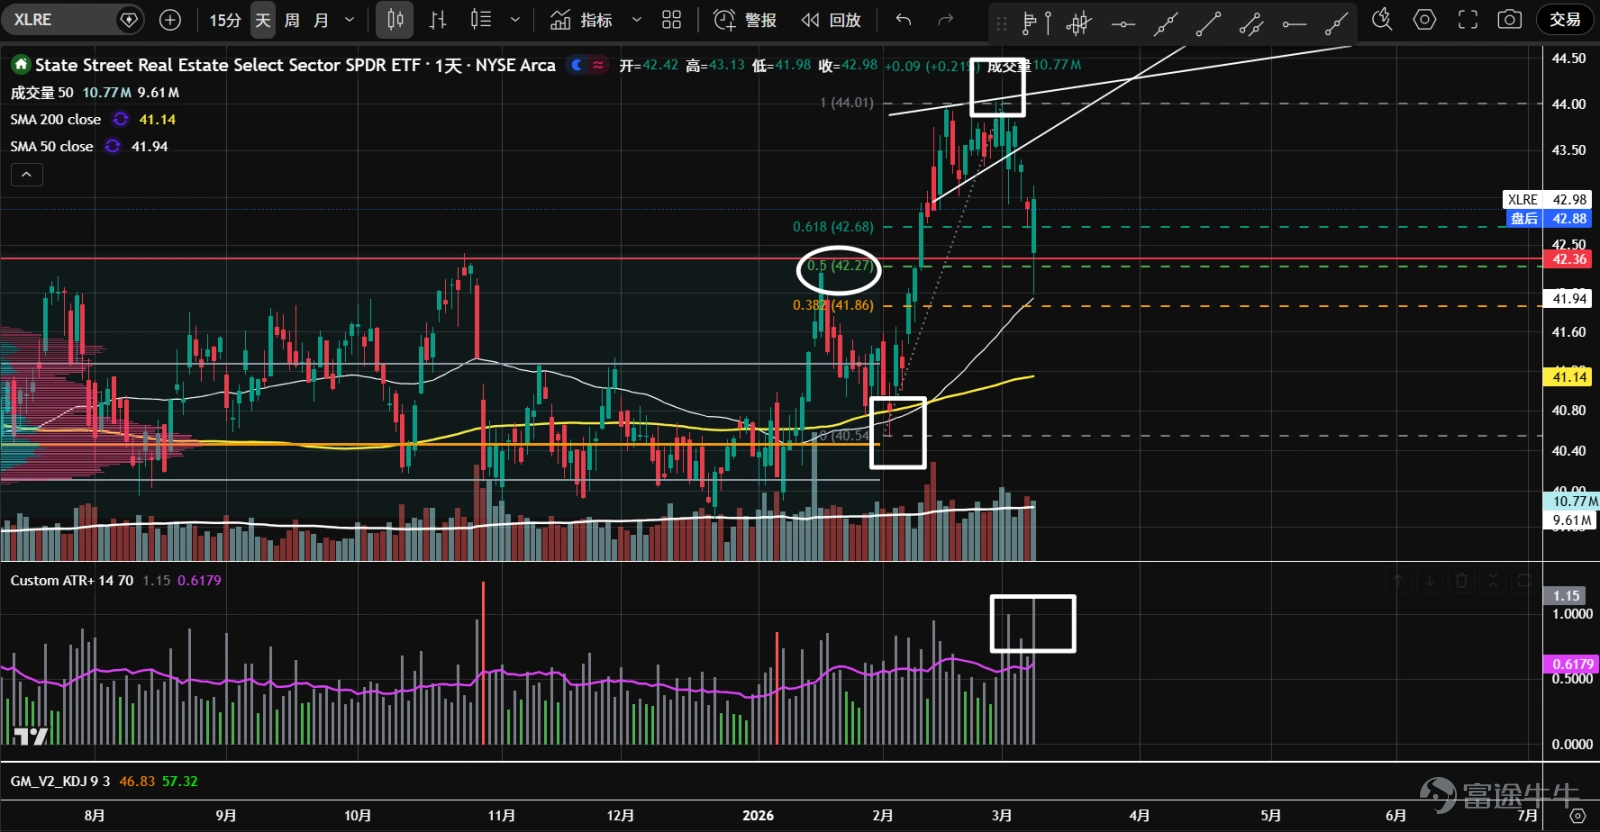
4、 $Real Estate Select Sector Spdr Fund (The) (XLRE.US)$ Since mid-February, it broke through a more than one-year consolidation zone with high trading volume, forming an ascending wedge. After breaking below the pattern, a large bullish candlestick appeared near the 42.3 pivot level and the 50% retracement of the prior upward wave. Both trading volume and price volatility remain very high. It’s best to wait for a secondary test on lower volume before seeking buying opportunities.
1、 $VanEck Semiconductor ETF (SMH.US)$ Since the end of January, it has faced resistance three times at the 420 level. Starting from the end of February, there was a significant increase in trading volume accompanied by a decline, indicating supply pressure. The 370 level represents the 50% retracement of the previous upward wave and is also a pivotal point. In this area, the increase in trading volume with limited downside indicates potential institutional accumulation; overnight, an outsized bullish candle appeared, suggesting bulls are in control.   2、 $iShares Expanded Tech-Software Sector ETF (IGV.US)$ At the beginning of February, support emerged around the 78 level, accompanied by panic selling and a rebound on reduced volume, followed by further declines. After breaking below the 78 support level, heavier volume occurred, followed by a rebound to recover losses, forming a shakeout pattern. Amidst a falling broader market, prices continued to rise, closing near highs with overall trading volume expanding. Traders are now waiting for a pullback on lower volume to establish long positions.  3、 $Global X Artificial Intelligence & Technology ETF (AIQ.US)$ Since October of last year, the asset has been consolidating in a sideways range. After a false breakout above in late January, it declined continuously, with overall trading volume increasing, showing bearish price-volume dynamics and clear distribution characteristics. Currently, consecutive record volumes have appeared near the support level, with significant price fluctuations and fierce battles between bulls and bears; judging by the closing position, bulls have temporarily gained the upper hand.  4、 $Real Estate Select Sector Spdr Fund (The) (XLRE.US)$ Since mid-February, it broke through...
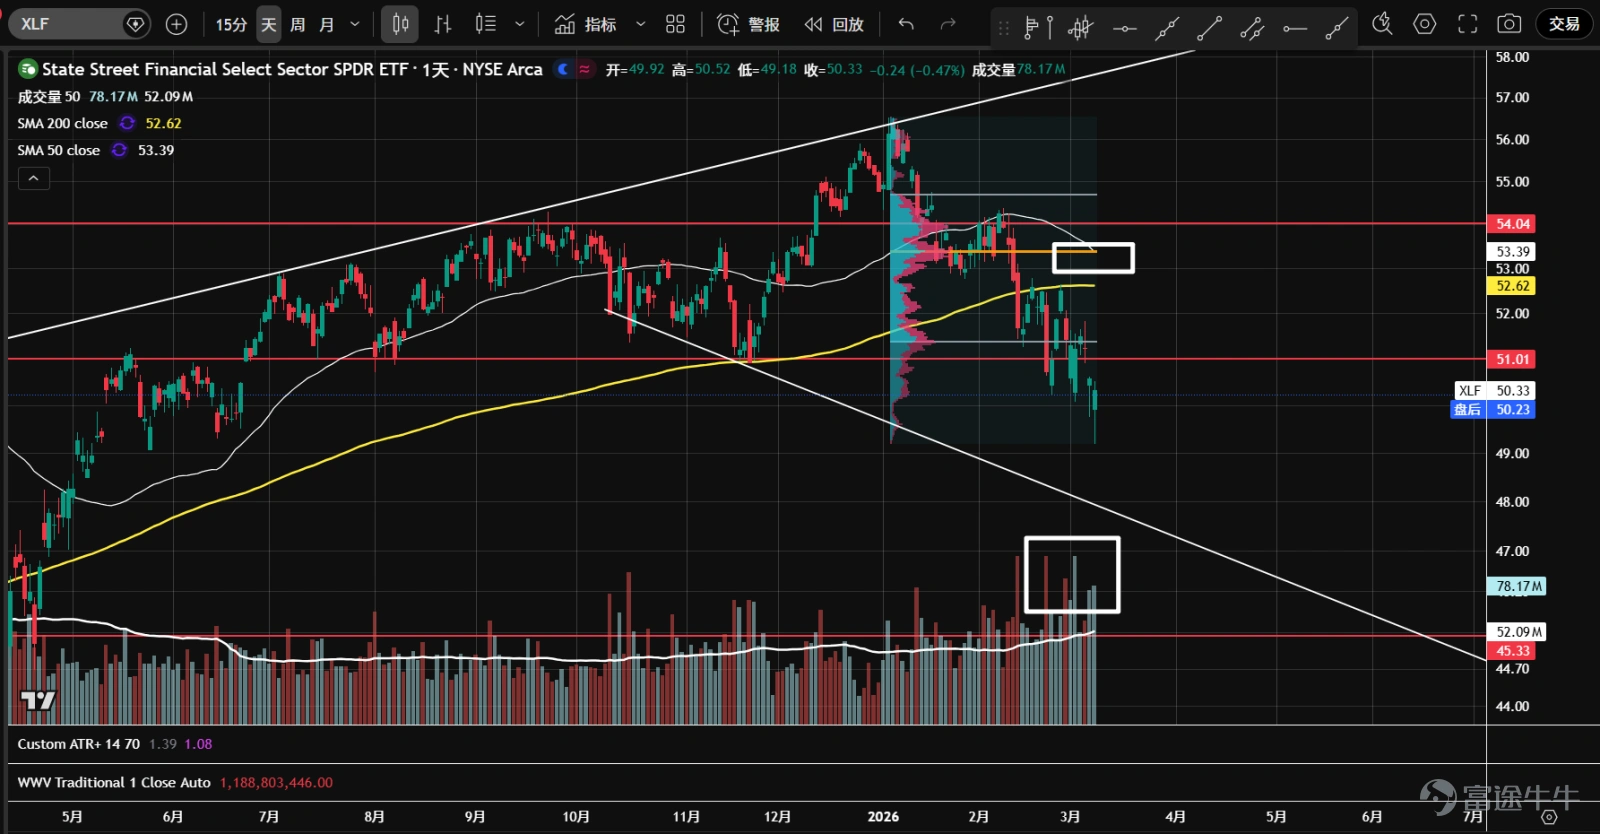
5、 $Financial Select Sector SPDR Fund (XLF.US)$ The breakout from the expanding triangle is inherently bearish. Since January, the drop from the high has breached the support at 51. Although bulls have been attempting to counterattack in recent days with higher volume and closing at highs, the price continues to decline. Additionally, the volume control point (orange line) since the start of the decline hasn't shifted lower, indicating bears remain dominant.
1、 $VanEck Semiconductor ETF (SMH.US)$ Since the end of January, it has faced resistance three times at the 420 level. Starting from the end of February, there was a significant increase in trading volume accompanied by a decline, indicating supply pressure. The 370 level represents the 50% retracement of the previous upward wave and is also a pivotal point. In this area, the increase in trading volume with limited downside indicates potential institutional accumulation; overnight, an outsized bullish candle appeared, suggesting bulls are in control.   2、 $iShares Expanded Tech-Software Sector ETF (IGV.US)$ At the beginning of February, support emerged around the 78 level, accompanied by panic selling and a rebound on reduced volume, followed by further declines. After breaking below the 78 support level, heavier volume occurred, followed by a rebound to recover losses, forming a shakeout pattern. Amidst a falling broader market, prices continued to rise, closing near highs with overall trading volume expanding. Traders are now waiting for a pullback on lower volume to establish long positions.  3、 $Global X Artificial Intelligence & Technology ETF (AIQ.US)$ Since October of last year, the asset has been consolidating in a sideways range. After a false breakout above in late January, it declined continuously, with overall trading volume increasing, showing bearish price-volume dynamics and clear distribution characteristics. Currently, consecutive record volumes have appeared near the support level, with significant price fluctuations and fierce battles between bulls and bears; judging by the closing position, bulls have temporarily gained the upper hand.  4、 $Real Estate Select Sector Spdr Fund (The) (XLRE.US)$ Since mid-February, it broke through...
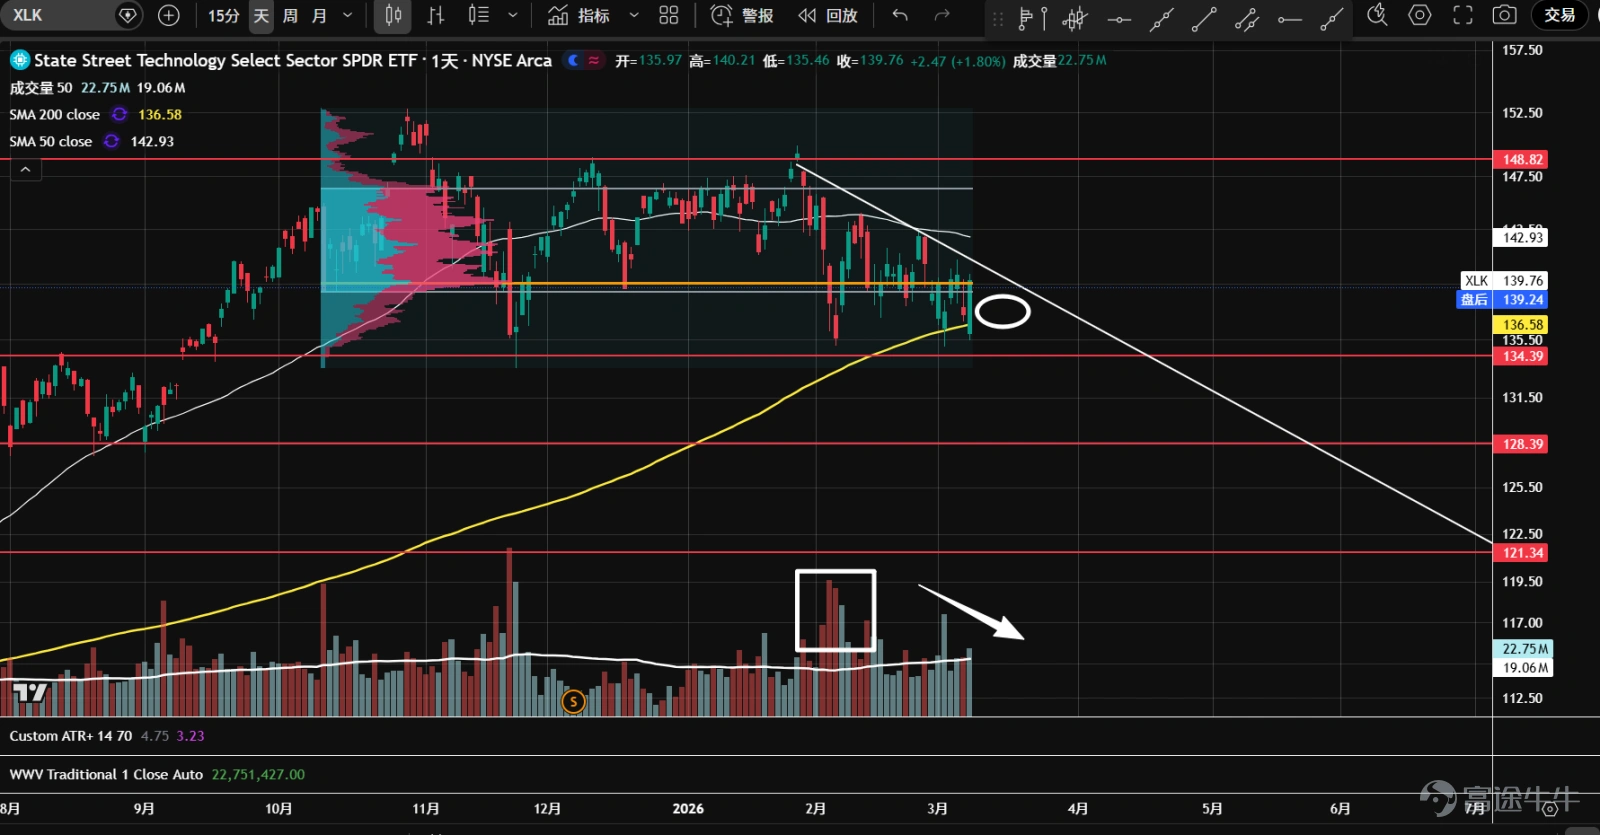
6、 $The Technology Select Sector SPDR® Fund (XLK.US)$ Since October last year, the stock has been range-bound, and after a false breakout at the end of January, it declined continuously. A rebound occurred after panic selling appeared at the support near 134.5 at the bottom, followed by a second test where it stabilized with low volume at a high annual support level, closing near the high, entering a narrowing position, offering good risk-reward for going long.
1、 $VanEck Semiconductor ETF (SMH.US)$ Since the end of January, it has faced resistance three times at the 420 level. Starting from the end of February, there was a significant increase in trading volume accompanied by a decline, indicating supply pressure. The 370 level represents the 50% retracement of the previous upward wave and is also a pivotal point. In this area, the increase in trading volume with limited downside indicates potential institutional accumulation; overnight, an outsized bullish candle appeared, suggesting bulls are in control.   2、 $iShares Expanded Tech-Software Sector ETF (IGV.US)$ At the beginning of February, support emerged around the 78 level, accompanied by panic selling and a rebound on reduced volume, followed by further declines. After breaking below the 78 support level, heavier volume occurred, followed by a rebound to recover losses, forming a shakeout pattern. Amidst a falling broader market, prices continued to rise, closing near highs with overall trading volume expanding. Traders are now waiting for a pullback on lower volume to establish long positions.  3、 $Global X Artificial Intelligence & Technology ETF (AIQ.US)$ Since October of last year, the asset has been consolidating in a sideways range. After a false breakout above in late January, it declined continuously, with overall trading volume increasing, showing bearish price-volume dynamics and clear distribution characteristics. Currently, consecutive record volumes have appeared near the support level, with significant price fluctuations and fierce battles between bulls and bears; judging by the closing position, bulls have temporarily gained the upper hand.  4、 $Real Estate Select Sector Spdr Fund (The) (XLRE.US)$ Since mid-February, it broke through...
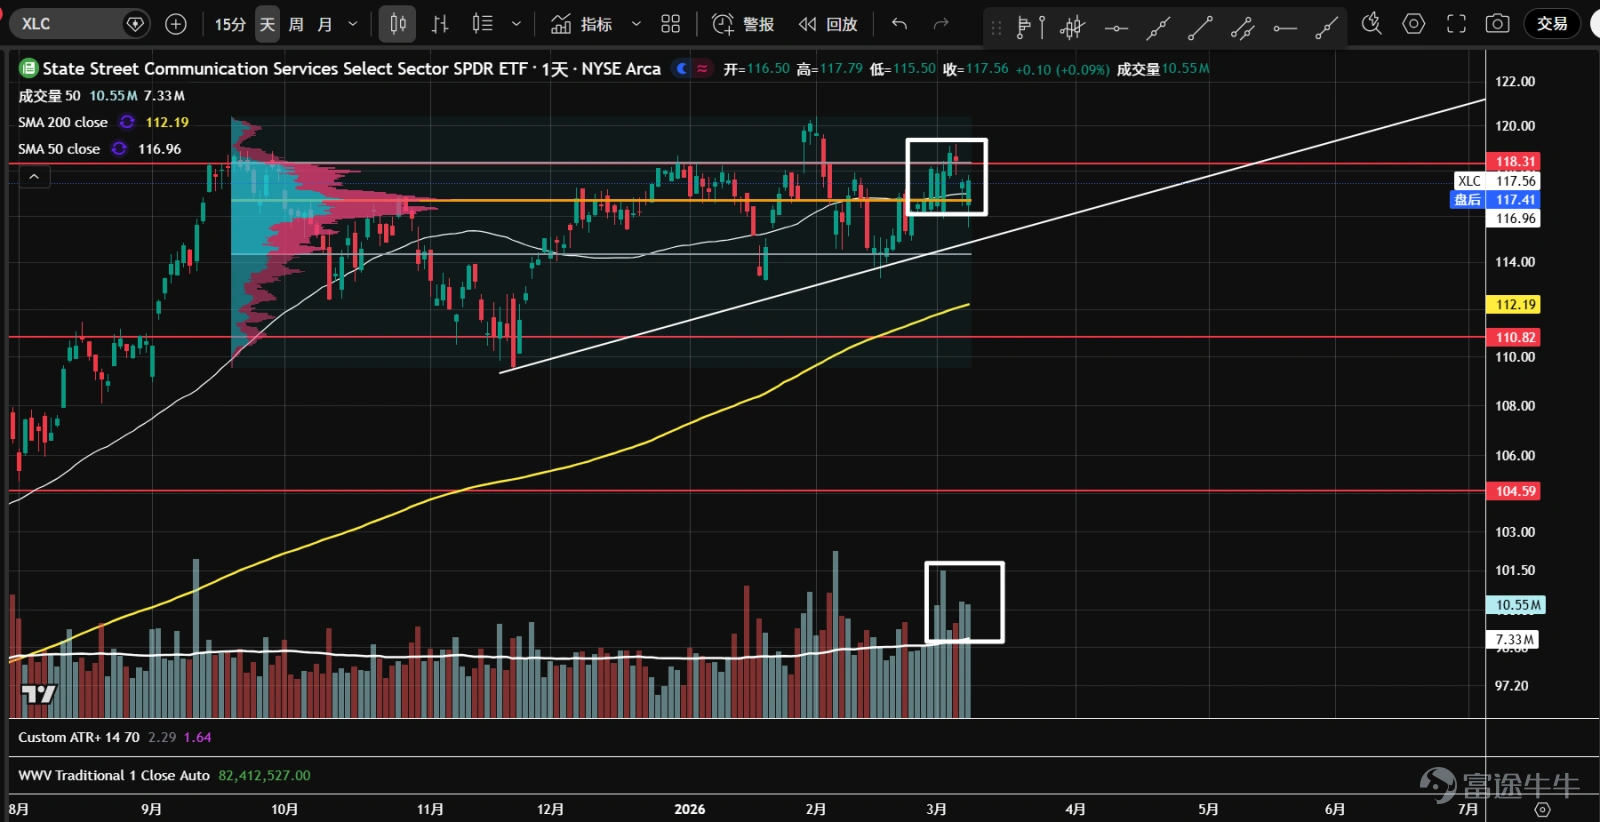
7、 $The Communication Services Select Sector SPDR® Fund (XLC.US)$ Since September last year, the stock has been consolidating sideways, forming an ascending triangle pattern. Currently, there is massive volume near the resistance at 118, with fierce battles between bulls and bears. Though not yet broken out, pullbacks are shallow, and most candlesticks close near the high, indicating that bulls are absorbing floating supply.
1、 $VanEck Semiconductor ETF (SMH.US)$ Since the end of January, it has faced resistance three times at the 420 level. Starting from the end of February, there was a significant increase in trading volume accompanied by a decline, indicating supply pressure. The 370 level represents the 50% retracement of the previous upward wave and is also a pivotal point. In this area, the increase in trading volume with limited downside indicates potential institutional accumulation; overnight, an outsized bullish candle appeared, suggesting bulls are in control.   2、 $iShares Expanded Tech-Software Sector ETF (IGV.US)$ At the beginning of February, support emerged around the 78 level, accompanied by panic selling and a rebound on reduced volume, followed by further declines. After breaking below the 78 support level, heavier volume occurred, followed by a rebound to recover losses, forming a shakeout pattern. Amidst a falling broader market, prices continued to rise, closing near highs with overall trading volume expanding. Traders are now waiting for a pullback on lower volume to establish long positions.  3、 $Global X Artificial Intelligence & Technology ETF (AIQ.US)$ Since October of last year, the asset has been consolidating in a sideways range. After a false breakout above in late January, it declined continuously, with overall trading volume increasing, showing bearish price-volume dynamics and clear distribution characteristics. Currently, consecutive record volumes have appeared near the support level, with significant price fluctuations and fierce battles between bulls and bears; judging by the closing position, bulls have temporarily gained the upper hand.  4、 $Real Estate Select Sector Spdr Fund (The) (XLRE.US)$ Since mid-February, it broke through...
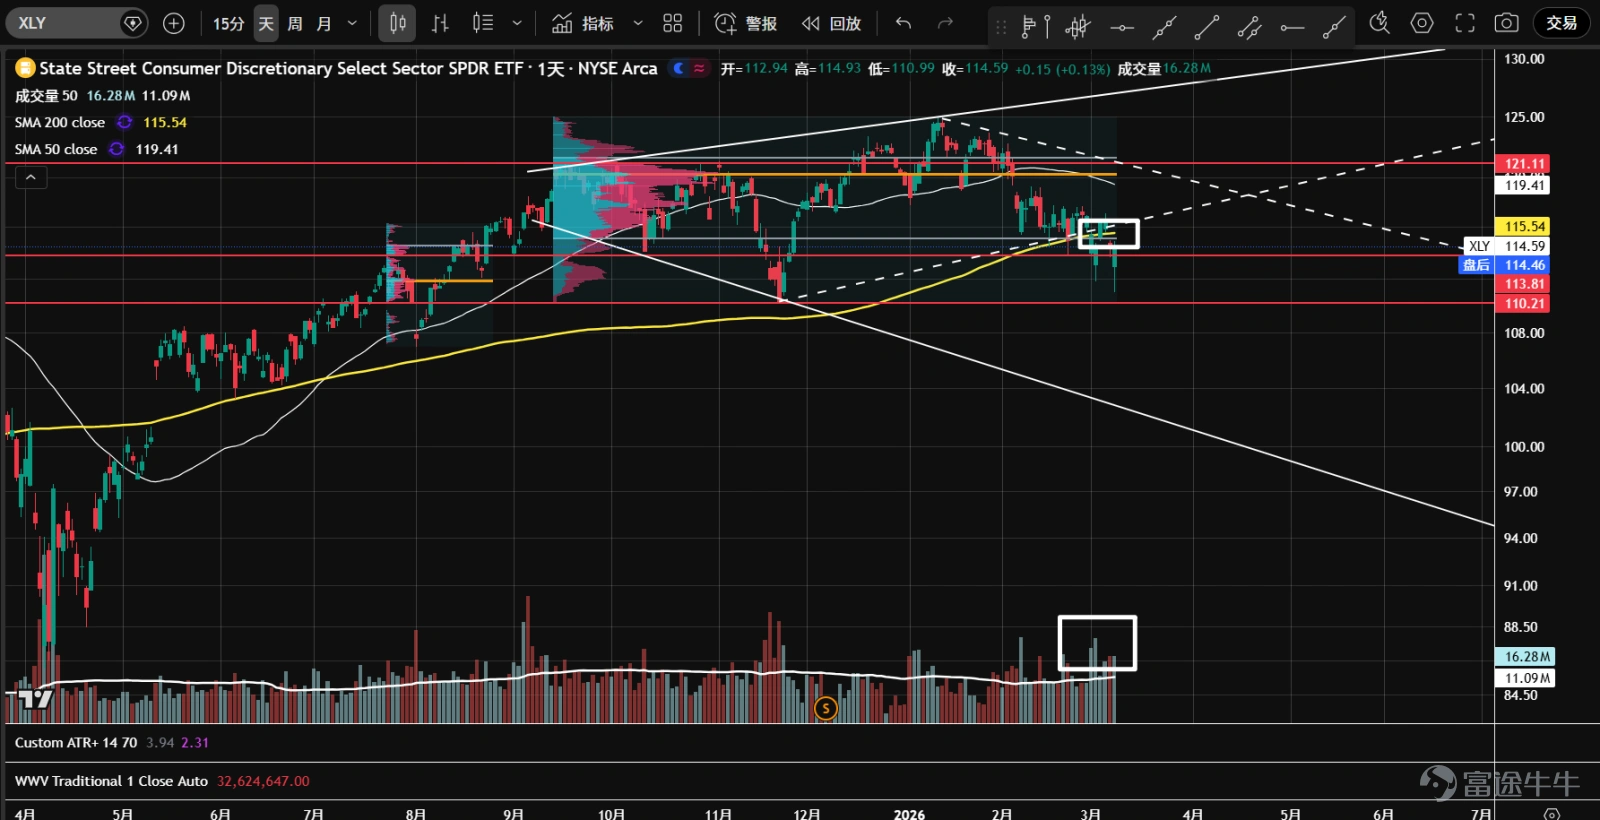
8、 $Consumer Discretionary Select Sector SPDR Fund (XLY.US)$ Since September last year, the stock formed an expanding triangle pattern. After a surge and retreat at the end of January, it has now fallen below the lower boundary of the value area (VAL) and the annual support line. Overall trading volume remains significant, suggesting the possibility of developing into a topping diamond pattern. For now, it's best to stay on the sidelines.
1、 $VanEck Semiconductor ETF (SMH.US)$ Since the end of January, it has faced resistance three times at the 420 level. Starting from the end of February, there was a significant increase in trading volume accompanied by a decline, indicating supply pressure. The 370 level represents the 50% retracement of the previous upward wave and is also a pivotal point. In this area, the increase in trading volume with limited downside indicates potential institutional accumulation; overnight, an outsized bullish candle appeared, suggesting bulls are in control.   2、 $iShares Expanded Tech-Software Sector ETF (IGV.US)$ At the beginning of February, support emerged around the 78 level, accompanied by panic selling and a rebound on reduced volume, followed by further declines. After breaking below the 78 support level, heavier volume occurred, followed by a rebound to recover losses, forming a shakeout pattern. Amidst a falling broader market, prices continued to rise, closing near highs with overall trading volume expanding. Traders are now waiting for a pullback on lower volume to establish long positions.  3、 $Global X Artificial Intelligence & Technology ETF (AIQ.US)$ Since October of last year, the asset has been consolidating in a sideways range. After a false breakout above in late January, it declined continuously, with overall trading volume increasing, showing bearish price-volume dynamics and clear distribution characteristics. Currently, consecutive record volumes have appeared near the support level, with significant price fluctuations and fierce battles between bulls and bears; judging by the closing position, bulls have temporarily gained the upper hand.  4、 $Real Estate Select Sector Spdr Fund (The) (XLRE.US)$ Since mid-February, it broke through...
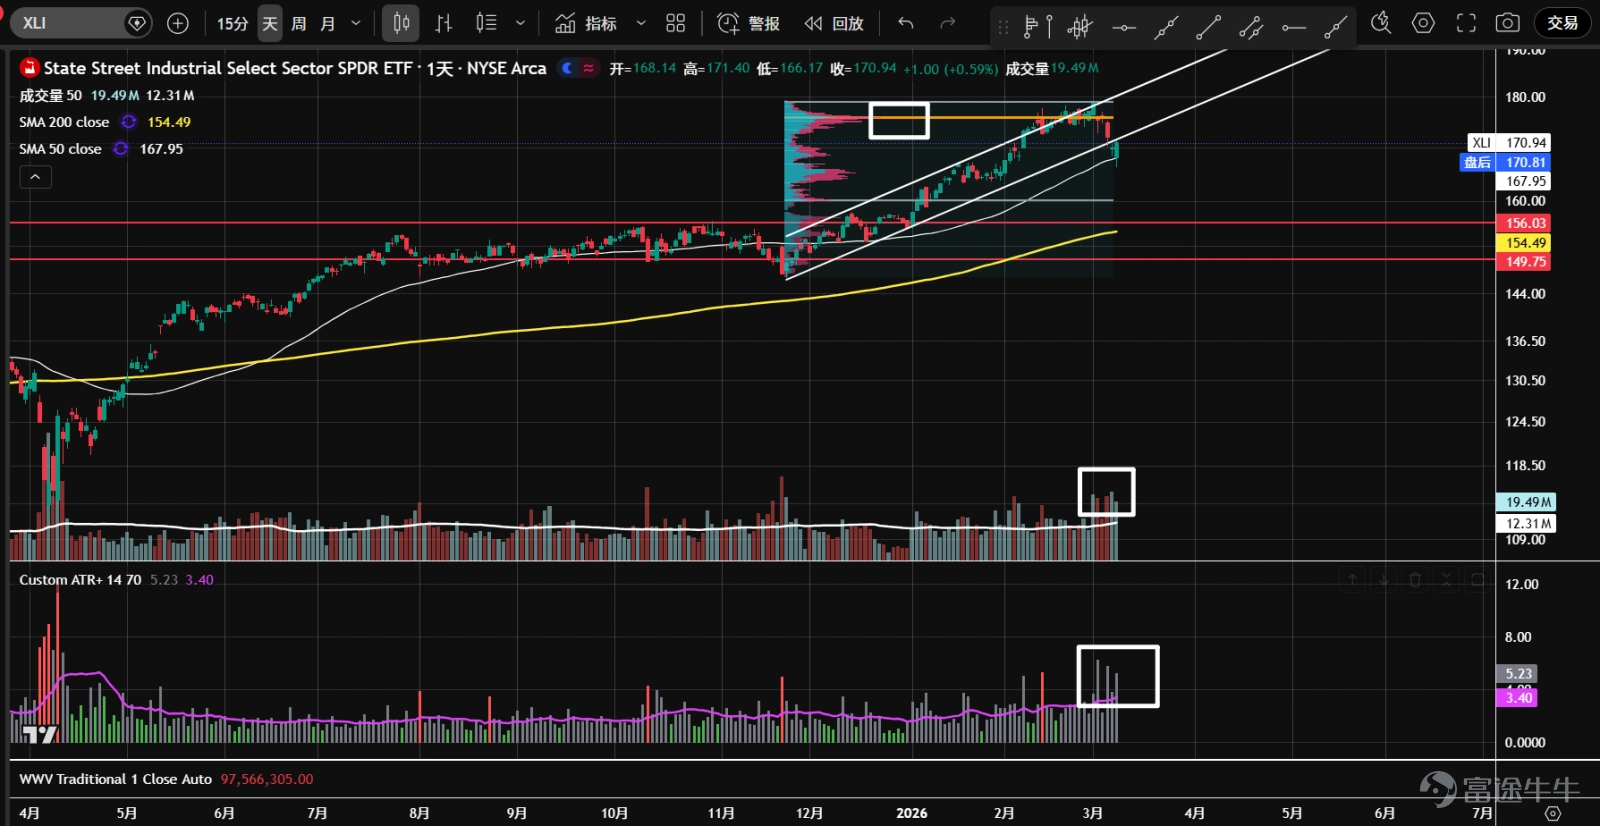
9、 $Industrial Select Sector SPDR Fund (XLI.US)$ Since the beginning of the year, the stock broke through the consolidation range, entering an upward trend. Recently, it began a high-volume pullback, breaking below the uptrend line. Both trading volume and price volatility during this decline have been the highest since the uptrend began, possibly signaling a natural pullback after a peak. The distribution of trading volume since the rise has formed a P-shaped pattern, potentially leading to a sideways consolidation phase.
1、 $VanEck Semiconductor ETF (SMH.US)$ Since the end of January, it has faced resistance three times at the 420 level. Starting from the end of February, there was a significant increase in trading volume accompanied by a decline, indicating supply pressure. The 370 level represents the 50% retracement of the previous upward wave and is also a pivotal point. In this area, the increase in trading volume with limited downside indicates potential institutional accumulation; overnight, an outsized bullish candle appeared, suggesting bulls are in control.   2、 $iShares Expanded Tech-Software Sector ETF (IGV.US)$ At the beginning of February, support emerged around the 78 level, accompanied by panic selling and a rebound on reduced volume, followed by further declines. After breaking below the 78 support level, heavier volume occurred, followed by a rebound to recover losses, forming a shakeout pattern. Amidst a falling broader market, prices continued to rise, closing near highs with overall trading volume expanding. Traders are now waiting for a pullback on lower volume to establish long positions.  3、 $Global X Artificial Intelligence & Technology ETF (AIQ.US)$ Since October of last year, the asset has been consolidating in a sideways range. After a false breakout above in late January, it declined continuously, with overall trading volume increasing, showing bearish price-volume dynamics and clear distribution characteristics. Currently, consecutive record volumes have appeared near the support level, with significant price fluctuations and fierce battles between bulls and bears; judging by the closing position, bulls have temporarily gained the upper hand.  4、 $Real Estate Select Sector Spdr Fund (The) (XLRE.US)$ Since mid-February, it broke through...
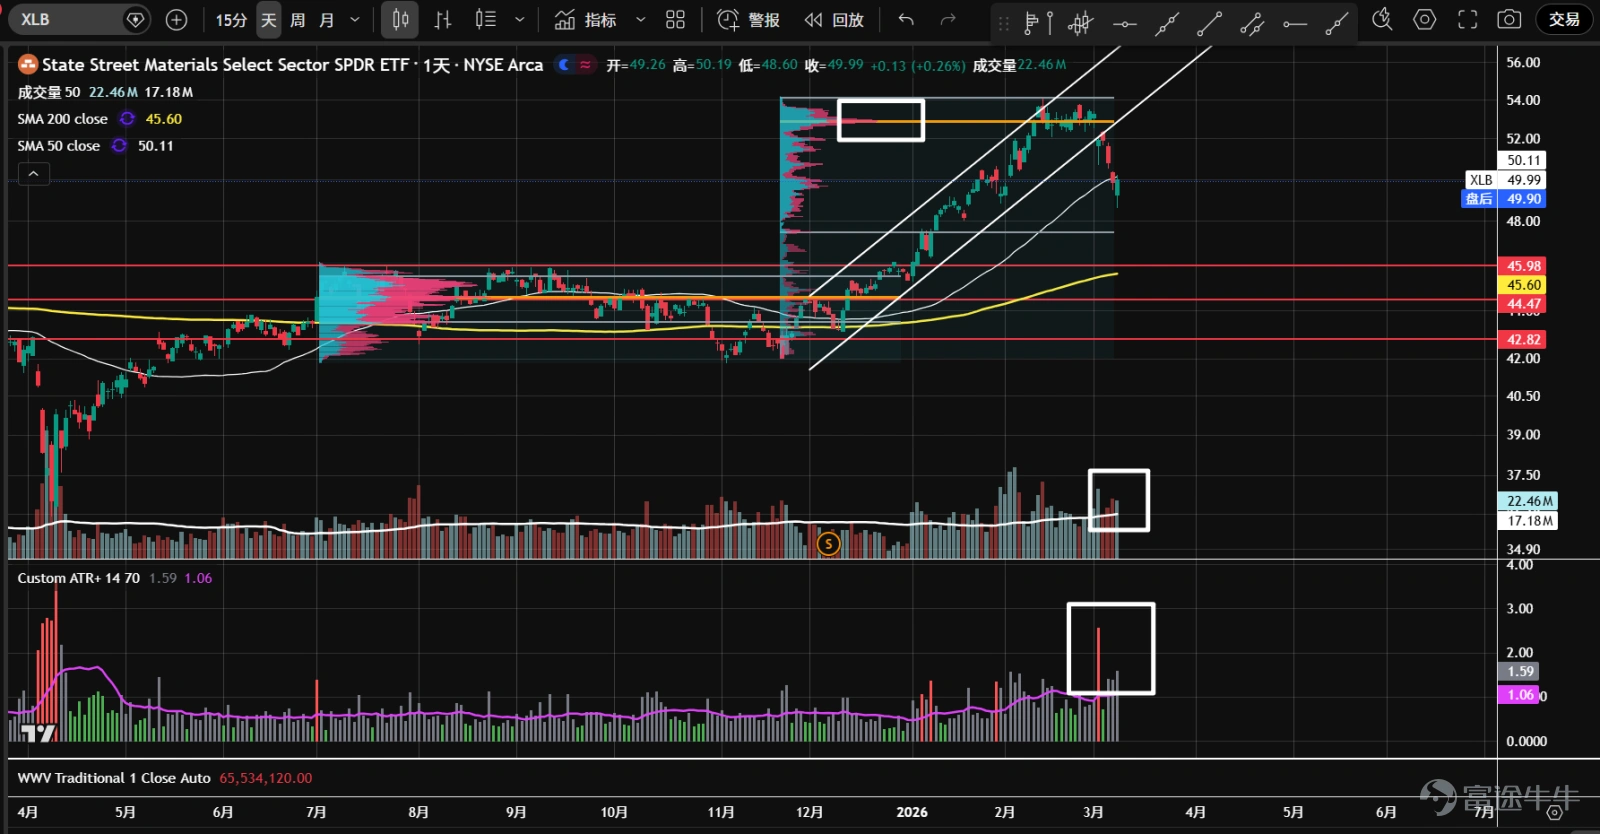
10、 $Materials Select Sector SPDR ETF (XLB.US)$ After breaking below the uptrend line, both the magnitude of the pullback and the volume during the decline have been the highest since the uptrend began. The distribution of trading volume since the rise has also formed a P-shaped pattern. Currently, the stock has stabilized at the 50-day moving average, but it may enter a sideways consolidation phase going forward.
1、 $VanEck Semiconductor ETF (SMH.US)$ Since the end of January, it has faced resistance three times at the 420 level. Starting from the end of February, there was a significant increase in trading volume accompanied by a decline, indicating supply pressure. The 370 level represents the 50% retracement of the previous upward wave and is also a pivotal point. In this area, the increase in trading volume with limited downside indicates potential institutional accumulation; overnight, an outsized bullish candle appeared, suggesting bulls are in control.   2、 $iShares Expanded Tech-Software Sector ETF (IGV.US)$ At the beginning of February, support emerged around the 78 level, accompanied by panic selling and a rebound on reduced volume, followed by further declines. After breaking below the 78 support level, heavier volume occurred, followed by a rebound to recover losses, forming a shakeout pattern. Amidst a falling broader market, prices continued to rise, closing near highs with overall trading volume expanding. Traders are now waiting for a pullback on lower volume to establish long positions.  3、 $Global X Artificial Intelligence & Technology ETF (AIQ.US)$ Since October of last year, the asset has been consolidating in a sideways range. After a false breakout above in late January, it declined continuously, with overall trading volume increasing, showing bearish price-volume dynamics and clear distribution characteristics. Currently, consecutive record volumes have appeared near the support level, with significant price fluctuations and fierce battles between bulls and bears; judging by the closing position, bulls have temporarily gained the upper hand.  4、 $Real Estate Select Sector Spdr Fund (The) (XLRE.US)$ Since mid-February, it broke through...
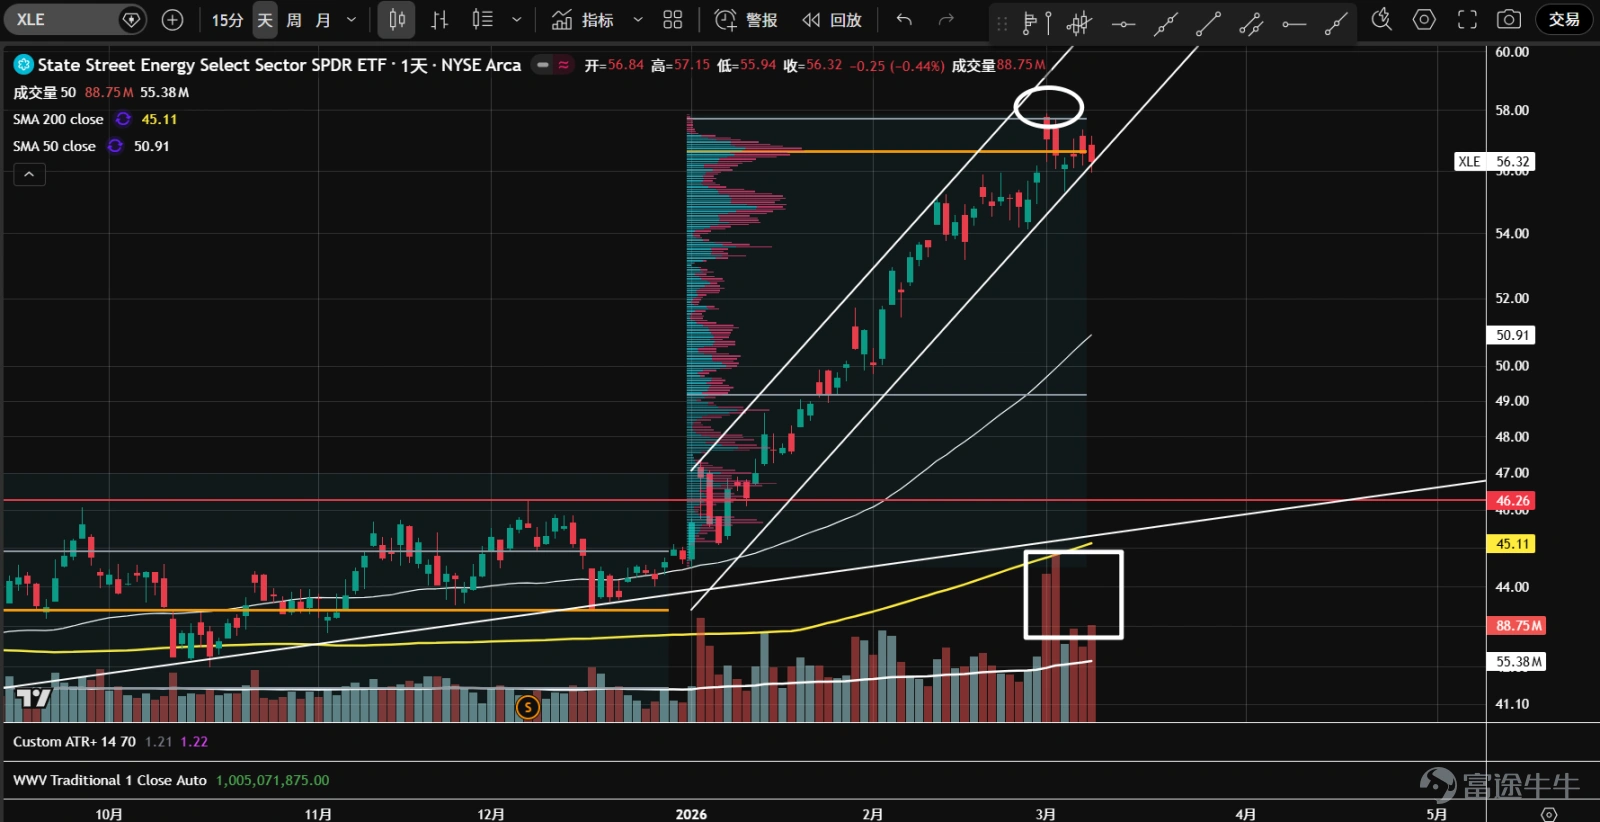
11、 $Energy Select Sector SPDR Fund (XLE.US)$ Trading within the uptrend channel, the latest rally failed to reach the upper boundary of the channel, with substantial volume appearing at highs, signaling increased supply. This caused the volume control point (orange line) to shift upward, forming a P-shaped distribution, with recent candles mostly closing near lows. Given the signs of oil prices peaking, the ETF might first break below the channel line.
1、 $VanEck Semiconductor ETF (SMH.US)$ Since the end of January, it has faced resistance three times at the 420 level. Starting from the end of February, there was a significant increase in trading volume accompanied by a decline, indicating supply pressure. The 370 level represents the 50% retracement of the previous upward wave and is also a pivotal point. In this area, the increase in trading volume with limited downside indicates potential institutional accumulation; overnight, an outsized bullish candle appeared, suggesting bulls are in control.   2、 $iShares Expanded Tech-Software Sector ETF (IGV.US)$ At the beginning of February, support emerged around the 78 level, accompanied by panic selling and a rebound on reduced volume, followed by further declines. After breaking below the 78 support level, heavier volume occurred, followed by a rebound to recover losses, forming a shakeout pattern. Amidst a falling broader market, prices continued to rise, closing near highs with overall trading volume expanding. Traders are now waiting for a pullback on lower volume to establish long positions.  3、 $Global X Artificial Intelligence & Technology ETF (AIQ.US)$ Since October of last year, the asset has been consolidating in a sideways range. After a false breakout above in late January, it declined continuously, with overall trading volume increasing, showing bearish price-volume dynamics and clear distribution characteristics. Currently, consecutive record volumes have appeared near the support level, with significant price fluctuations and fierce battles between bulls and bears; judging by the closing position, bulls have temporarily gained the upper hand.  4、 $Real Estate Select Sector Spdr Fund (The) (XLRE.US)$ Since mid-February, it broke through...
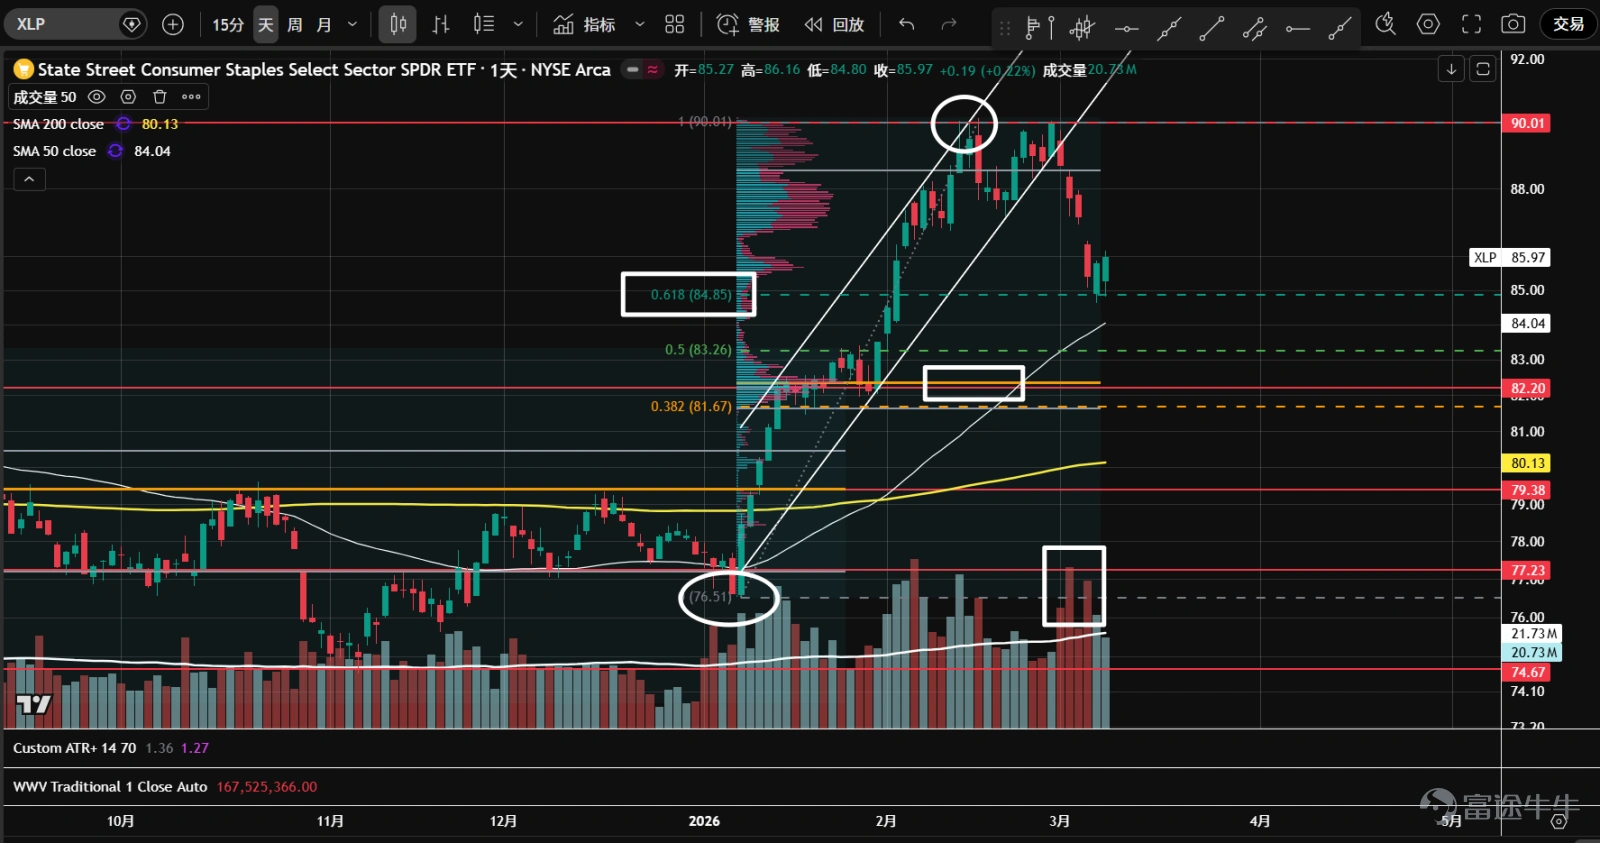
12、 $Consumer Staples Select Sector SPDR Fund (XLP.US)$ After being rejected twice at the 90 resistance level, the stock fell below the uptrend line. Although the volume control point (orange line) hasn’t moved up, the pullback was significant with heavy volume. It has currently stabilized at the 61.8% Fibonacci retracement of the previous uptrend, showing some signs of a rebound. However, there is significant overhead resistance, making it difficult to break above the previous high.
1、 $VanEck Semiconductor ETF (SMH.US)$ Since the end of January, it has faced resistance three times at the 420 level. Starting from the end of February, there was a significant increase in trading volume accompanied by a decline, indicating supply pressure. The 370 level represents the 50% retracement of the previous upward wave and is also a pivotal point. In this area, the increase in trading volume with limited downside indicates potential institutional accumulation; overnight, an outsized bullish candle appeared, suggesting bulls are in control.   2、 $iShares Expanded Tech-Software Sector ETF (IGV.US)$ At the beginning of February, support emerged around the 78 level, accompanied by panic selling and a rebound on reduced volume, followed by further declines. After breaking below the 78 support level, heavier volume occurred, followed by a rebound to recover losses, forming a shakeout pattern. Amidst a falling broader market, prices continued to rise, closing near highs with overall trading volume expanding. Traders are now waiting for a pullback on lower volume to establish long positions.  3、 $Global X Artificial Intelligence & Technology ETF (AIQ.US)$ Since October of last year, the asset has been consolidating in a sideways range. After a false breakout above in late January, it declined continuously, with overall trading volume increasing, showing bearish price-volume dynamics and clear distribution characteristics. Currently, consecutive record volumes have appeared near the support level, with significant price fluctuations and fierce battles between bulls and bears; judging by the closing position, bulls have temporarily gained the upper hand.  4、 $Real Estate Select Sector Spdr Fund (The) (XLRE.US)$ Since mid-February, it broke through...
13、 $The Health Care Select Sector SPDR® Fund (XLV.US)$ Since December, the stock has been stuck in a sideways consolidation. In late February, it faced resistance again at 160 and plummeted with high volume, breaching the 153 support level at the bottom of the top range but quickly recovered, forming a false breakout. However, trading volume remains very high; if there’s a low-volume retest, it could present a good buying opportunity.
1、 $VanEck Semiconductor ETF (SMH.US)$ Since the end of January, it has faced resistance three times at the 420 level. Starting from the end of February, there was a significant increase in trading volume accompanied by a decline, indicating supply pressure. The 370 level represents the 50% retracement of the previous upward wave and is also a pivotal point. In this area, the increase in trading volume with limited downside indicates potential institutional accumulation; overnight, an outsized bullish candle appeared, suggesting bulls are in control.   2、 $iShares Expanded Tech-Software Sector ETF (IGV.US)$ At the beginning of February, support emerged around the 78 level, accompanied by panic selling and a rebound on reduced volume, followed by further declines. After breaking below the 78 support level, heavier volume occurred, followed by a rebound to recover losses, forming a shakeout pattern. Amidst a falling broader market, prices continued to rise, closing near highs with overall trading volume expanding. Traders are now waiting for a pullback on lower volume to establish long positions.  3、 $Global X Artificial Intelligence & Technology ETF (AIQ.US)$ Since October of last year, the asset has been consolidating in a sideways range. After a false breakout above in late January, it declined continuously, with overall trading volume increasing, showing bearish price-volume dynamics and clear distribution characteristics. Currently, consecutive record volumes have appeared near the support level, with significant price fluctuations and fierce battles between bulls and bears; judging by the closing position, bulls have temporarily gained the upper hand.  4、 $Real Estate Select Sector Spdr Fund (The) (XLRE.US)$ Since mid-February, it broke through...
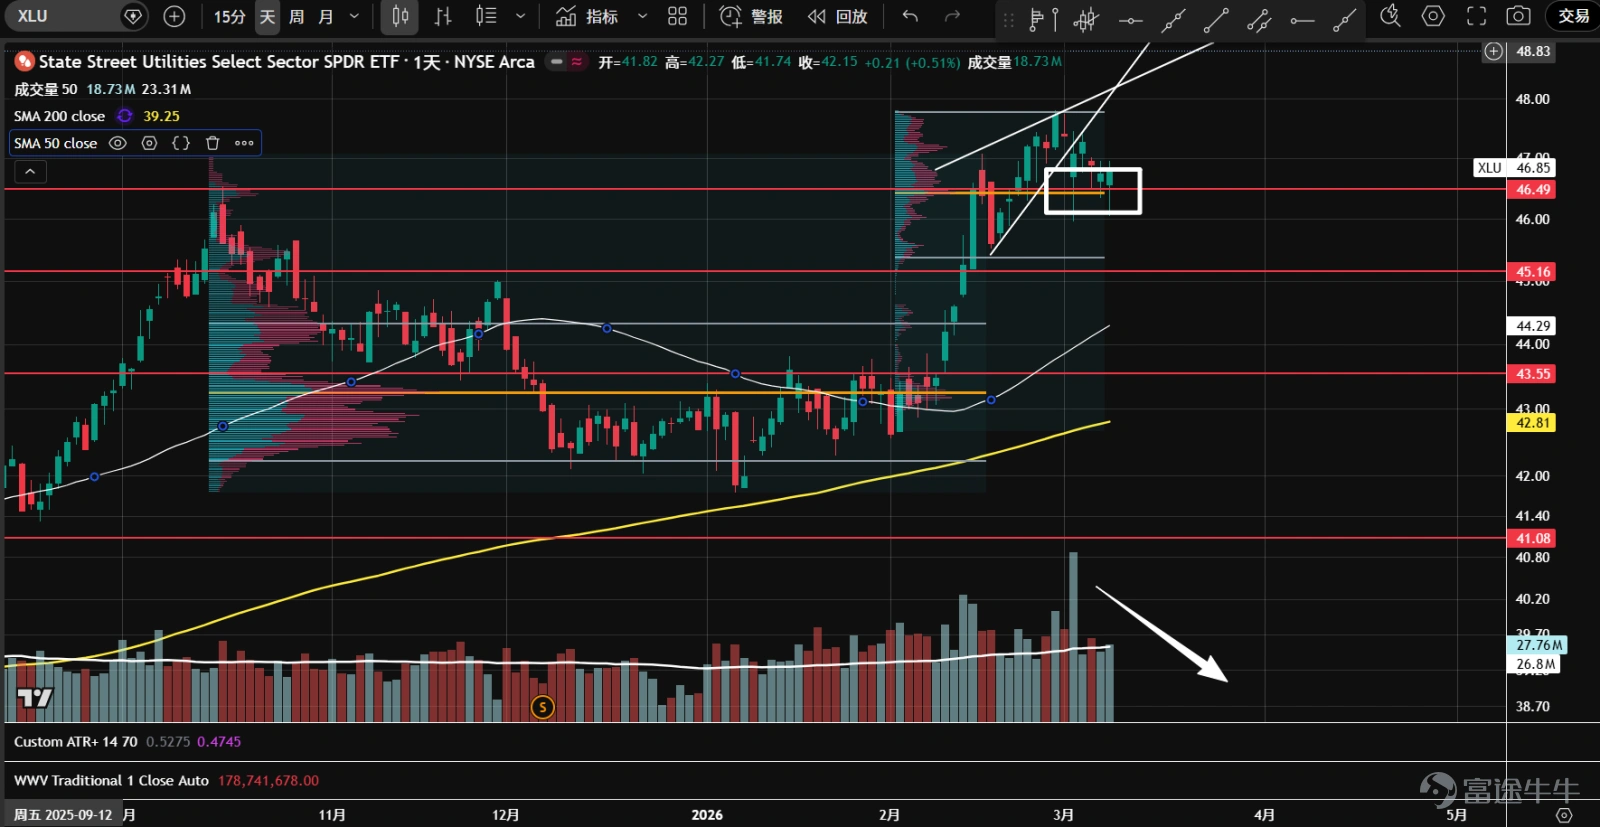
14、 $Utilities Select Sector SPDR Fund (XLU.US)$ Recently, the stock formed an ascending wedge pattern, retreating downward after failing to push higher. The correction was shallow, with shrinking volume. Since the uptrend began, the trading volume has formed a P-shaped distribution. Currently, it is near the volume control point (orange line), looking for potential long opportunities near the lower boundary of the value area.
1、 $VanEck Semiconductor ETF (SMH.US)$ Since the end of January, it has faced resistance three times at the 420 level. Starting from the end of February, there was a significant increase in trading volume accompanied by a decline, indicating supply pressure. The 370 level represents the 50% retracement of the previous upward wave and is also a pivotal point. In this area, the increase in trading volume with limited downside indicates potential institutional accumulation; overnight, an outsized bullish candle appeared, suggesting bulls are in control.   2、 $iShares Expanded Tech-Software Sector ETF (IGV.US)$ At the beginning of February, support emerged around the 78 level, accompanied by panic selling and a rebound on reduced volume, followed by further declines. After breaking below the 78 support level, heavier volume occurred, followed by a rebound to recover losses, forming a shakeout pattern. Amidst a falling broader market, prices continued to rise, closing near highs with overall trading volume expanding. Traders are now waiting for a pullback on lower volume to establish long positions.  3、 $Global X Artificial Intelligence & Technology ETF (AIQ.US)$ Since October of last year, the asset has been consolidating in a sideways range. After a false breakout above in late January, it declined continuously, with overall trading volume increasing, showing bearish price-volume dynamics and clear distribution characteristics. Currently, consecutive record volumes have appeared near the support level, with significant price fluctuations and fierce battles between bulls and bears; judging by the closing position, bulls have temporarily gained the upper hand.  4、 $Real Estate Select Sector Spdr Fund (The) (XLRE.US)$ Since mid-February, it broke through...
Risk Disclaimer: The above content only represents the author's view. It does not represent any position or investment advice of Futu. Futu makes no representation or warranty.Read more
Thumbs Up
6
Heart
2
Sob
1
588K Views
Report
Comment (1)
Write a Comment...
1
9
1