

HSBC (00005) Short-term Technical Analysis: Oversold Rebound, Can It Break Through the Moving Average Resistance?
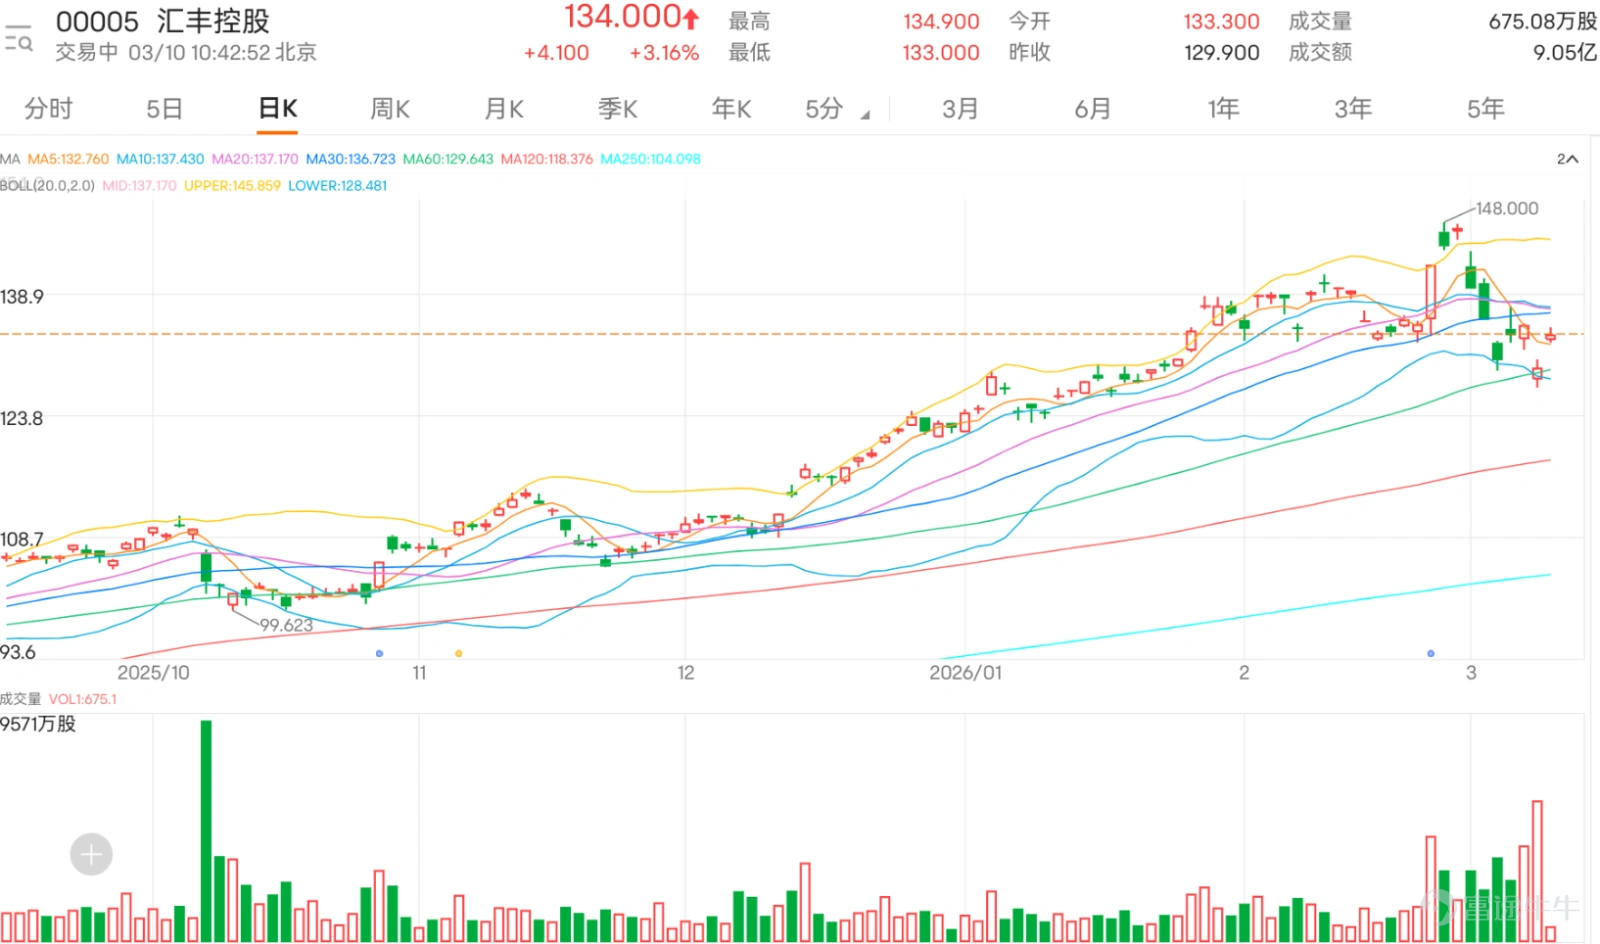
Today (the 10th), the price rebounded over 3%, now trading at $134. From a technical perspective, the stock price is currently below both the 10-day moving average ($137.56) and the 30-day moving average ($136.58), indicating a weaker short-to-medium term trend. However, the 60-day moving average ($129.23) still provides key support.
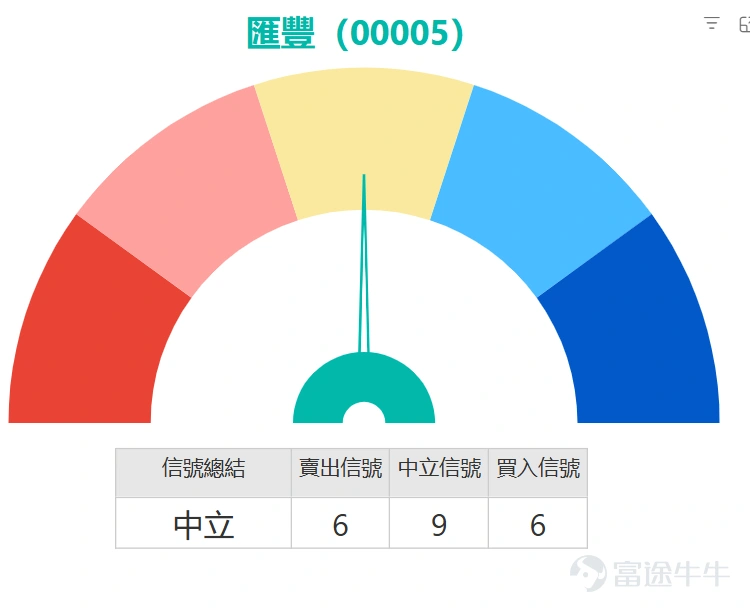
Multiple technical indicators are sending conflicting signals, highlighting market divergence. The most notable observation is that several oscillators have entered oversold territory. Both the Stochastic Oscillator and the CCI indicator suggest an oversold condition, which is typically a precursor to a short-term technical rebound. However, simultaneously, trend momentum tools such as MACD, Momentum Oscillator, and Bull/Bear Power indicators continue to issue sell signals, reflecting that downward pressure has not been fully released. This coexistence of 'oversold' and 'bearish trend' patterns illustrates the current market's hesitation—bearish momentum has temporarily eased, but bullish forces have yet to mount a strong counterattack. The RSI indicator stands at 42, within a neutral-to-weak range, further confirming the lack of sustained momentum.
In terms of key price levels, the first major support (Support 1) lies at HKD 125.7. If this level is decisively breached, it may open up downside space, testing deeper support at HKD 117.2 (Support 2). On the resistance side, the first target (Resistance 1) is HKD 137.2, which coincides with the area of convergence for short-term moving averages; stronger resistance (Resistance 2) is near HKD 142.6.
In conclusion, HSBC’s overall technical signals can be summarized as 'neutral,' with no improvement observed in several core trend indicators. For professional investors, a more prudent strategy might involve waiting for one of two key signals: first, a clear sign of bottoming and stabilization within the range of HKD 125.7 to HKD 129.2 (the 60-day line), accompanied by volume confirmation, which could serve as a short-term speculative rebound opportunity; second, the stock price must forcefully reclaim and stabilize above HKD 137.2 to improve the technical structure. At the current juncture, the recommendation leans towards 'wait-and-see' or 'only suitable for aggressive traders to make small bets on a rebound near key support,' with a strict stop-loss reference set at HKD 125.7 for short-term trading.
Core data from the derivatives market of HSBC Holdings (0005)
Warrants: The two exercise price ranges with the highest concentration of street inventory are: call warrants at HK$160-168 (accounting for 41.3%, out-of-the-money by 23-29%), put warrants at HK$90-103 (accounting for 49.5%, out-of-the-money by 20-30%); the most actively traded range is: call warrants at HK$148-160 (accounting for 38.7%, average effective leverage of 7-14 times, hedge value of 17-26%, implied volatility of 29-32%, expiry concentrated between May and December 2026); the most active trading range for put warrants is HK$103-126 (accounting for 45.2%, average effective leverage of 5-8 times, hedge value of -12% to -41%, implied volatility of 35-43%, expiry concentrated between June and September 2026).
Bull/Bear contracts: The two收回price ranges with the highest concentration of street inventory are: bull contracts at HK$100-105 (accounting for 51.04%, out-of-the-money by 19-23%), bear contracts at HK$150-160 (accounting for 37.57%, out-of-the-money by 12-20%); the most actively traded range is: bull contracts at HK$120-126 (accounting for 46.3%, average effective leverage of 15-28 times,收回distance of 2-10%), bear contracts at HK$150-160 (accounting for 58.7%, average effective leverage of 3-6 times,收回distance of 12-20%).
Product review: On March 3rd, within two trading days after the mentioned date, the cumulative decline in the underlying stock price of HSBC Holdings (00005) was 1.40%. Among the mentioned products, $MS#HSBC RP2701C.P (66931.HK)$ the cumulative increase over two days reached 9%, $JP#HSBC RP2812A.P (59768.HK)$ the cumulative increase reached 6%, with put warrant products showing stronger performance, $UB-HSBC@EP2609B.P (23923.HK)$ the cumulative increase reached 13%, $BI-HSBC@EP2609A.P (24062.HK)$ the cumulative increase reached 8%.

Product Highlights
For call warrants, $BI-HSBC@EC2609B.C (22630.HK)$ offering approximately 8 times leverage, with an exercise price of HK$145.1. Its characteristics include the highest leverage level with lower premium, suitable for investors optimistic about HSBC's future outlook while seeking higher capital efficiency; another product $BI-HSBC@EC2605A.C (23691.HK)$ offers approximately 14.5 times leverage, with an exercise price of HK$148.1, featuring relatively lower implied volatility, which helps reduce the impact of time value decay.
For put warrants, $BI-HSBC@EP2607B.P (25733.HK)$The strike price is 126.56 yuan, with a leverage of approximately 5.2 times; the implied volatility is relatively low, offering a lower-cost hedging opportunity for investors who are bearish on the future market.$BI-HSBC@EP2609B.P (26486.HK)$The strike price is 125.98 yuan, with a leverage of about 4.8 times; it not only has the lowest implied volatility but also offers higher leverage, which can amplify potential returns.
For bull contracts, $UB#HSBC RC2809F.C (59997.HK)$The recovery price is 120 yuan, with an actual leverage of approximately 16.4 times; it has the lowest premium and relatively high actual leverage, making it suitable for investors optimistic about a short-term rebound.$JP#HSBC RC2809E.C (59772.HK)$The recovery price is 123 yuan, with an actual leverage of about 22.8 times; its premium is relatively low, providing more attractive entry conditions.
Regarding bearish certificates, $UB#HSBC RP2702A.P (59897.HK)$The recovery price is 150 yuan, with an actual leverage of approximately 5.7 times; it has the lowest premium and relatively high actual leverage, making it suitable for investors expecting a stock price adjustment.$JP#HSBC RP2702C.P (67354.HK)$The recovery price is 153 yuan, with an actual leverage of about 4.7 times; it has the highest actual leverage and lower premium, effectively capturing downward trends.
HSBC rebounded over 3% today but is still below the short-term moving average. Do you think this rebound is more of a technical correction or a signal of trend reversal? What follow-up indicators should be observed? Feel free to share your insights in the comment section. For more market analysis, stay tuned to 'HK Stock Warrants Jenny' daily updates!
Reminder: This article does not constitute any investment advice.
This article is for reference only and does not constitute any investment advice. The market data, opinions, and analysis contained herein may change at any time without prior notice. We are not responsible for any loss or damage caused by reliance on the information in this article. Technical analysis only shows whether certain technical conditions are met; a comprehensive assessment of asset performance should be conducted using additional data. Decisions to trade should not be based solely on this article. Please note that past performance is not indicative of future results.
#HongKongStocks #HangSengIndex #RealTimeAnalysis #WarrantsSelection #WarrantsStrategy #DerivativesHedging #HongKongWarrantsJenny #BlueChipStocks #HSBCHoldings #00005$Hang Seng Index (800000.HK)$$Hang Seng China Enterprises Index (800100.HK)$$Hang Seng TECH Index (800700.HK)$
Risk Disclaimer: The above content only represents the author's view. It does not represent any position or investment advice of Futu. Futu makes no representation or warranty.Read more


Comments
to post a comment
4
12