

Raising 'lobsters' drives up computing power demand! Where are the investment opportunities?
Has Tencent (0700) completed its technical bottoming? Key resistance becomes short-term focus
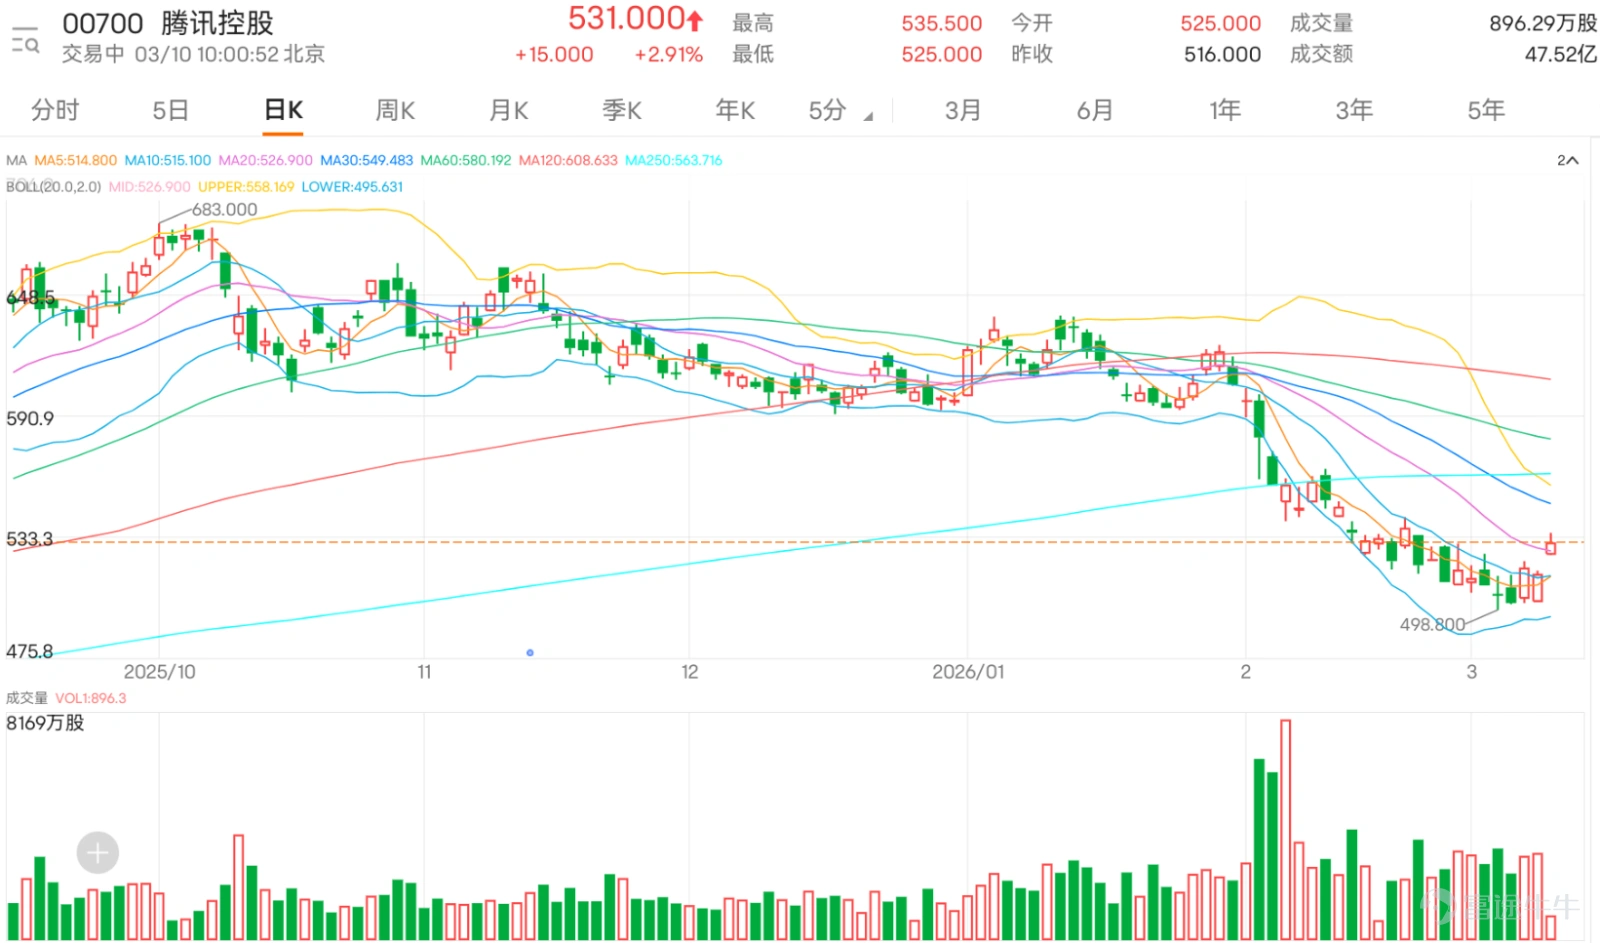
The recent trend has drawn significant market attention. The latest price of 531 yuan has moved above the 10-day moving average (approximately 515 yuan) and the 20-day moving average (526.85 yuan), suggesting that recent selling pressure may have temporarily eased, with signs of attempting to form a bottom. However, the current share price remains clearly constrained below key medium-term moving averages such as the 30-day (approximately 549.48 yuan) and the 60-day (approximately 580.19 yuan), indicating that a complete reversal of the medium- to long-term trend will still require time and volume confirmation.
A deeper analysis of key technical indicators reveals multiple signals pointing to a potential short-term rebound opportunity. First, regarding momentum and overbought/oversold indicators, the 14-day Relative Strength Index (RSI) value is 29, which has entered the traditionally recognized oversold region (below 30), increasing the probability of a technical rebound. The Stochastic Oscillator (KD) and CCI signals are currently marked as 'neutral,' indicating that reversal momentum is building but not yet fully confirmed. Notably, the Moving Average Convergence Divergence (MACD) has issued a 'buy' signal, often seen as a forward-looking indicator of a possible trend change. Additionally, Bollinger Bands analysis indicates that the stock price is in a 'severely oversold, potentially bottoming' state, further reinforcing the technical assessment of limited downside space.
Synthesizing these technical signals, although some tools like the Williams %R and Momentum Oscillator still indicate selling pressure or neutrality, the combination of core oversold indicators (RSI) and trend momentum indicators (MACD), along with the stock price stabilizing above short-term moving averages, results in an overall technical signal strength of 9 for a 'buy' rating. This suggests that, from a purely technical perspective, the short-term risk-reward ratio is becoming favorable.
Regarding key price levels, the primary support to watch is at HKD 499 (Support 1). A break below this could lead to a deeper support zone at HKD 480 (Support 2). On the upside, the initial and critical resistance is located at HKD 538 (Resistance 1). Breaking through this level would open up room for a rebound towards HKD 581 (Resistance 2, close to the 60-day moving average).
Tencent Holdings (0700) Derivatives Sector Core Data
In the warrant sector, there is a clear clustering effect in the street inventory: call warrants are most concentrated in the 620-700 yuan range, accounting for 53.1% of the total; put warrants are highly concentrated in the 460-490 yuan range, with an overall share of 56.9%. Trading activity also tilts towards core ranges: the most active trading range for call warrants is 680-700 yuan, contributing 32.1% of total turnover. Products in this range have an average leverage of 9.8 times, hedge values between 11-14%, implied volatility around 35-37%, and expiration dates concentrated in late July 2026, with a remaining term of about 4.5 months.
The most active trading range for put warrants coincides with the concentration of street inventory, also within the 460-490 yuan range, contributing 41.8% of total turnover. Products have an average leverage of 7.2 times, hedge values between -28% to -34%, implied volatility around 32-34%, with expiration dates spanning from May to December 2026. Short-term products are concentrated in May-August, while long-term products are concentrated in December.
The street inventory and trading volume in the bull/bear warrant sector also exhibit significant marginal clustering characteristics: the most concentrated range for bull warrants is 470-490 yuan, accounting for 38.2% of the total, with the most active trading range at 480-490 yuan, contributing 42.6% of total turnover and an average leverage of 16.5 times. For bear warrants, the most concentrated range is 540-570 yuan, accounting for 31.7% of the total, with the most active trading range at 530-550 yuan, contributing 37.2% of total turnover and an average leverage as high as 28.5 times.

Product review: On March 3rd, Tencent's stock price fell by a cumulative 1.67% over the next two trading days. $JP#TENCTRP2811E.P (55278.HK)$ The cumulative increase over two days reached 8%. $UB#TENCTRP2812I.P (55635.HK)$ The cumulative increase reached 9%, with put warrant products showing particularly strong performance. $UBTENCT@EP2606A.P (21984.HK)$ The cumulative increase reached 14%. $BITENCT@EP2606A.P (23122.HK)$ The cumulative increase reached 17%.

Product Picks:
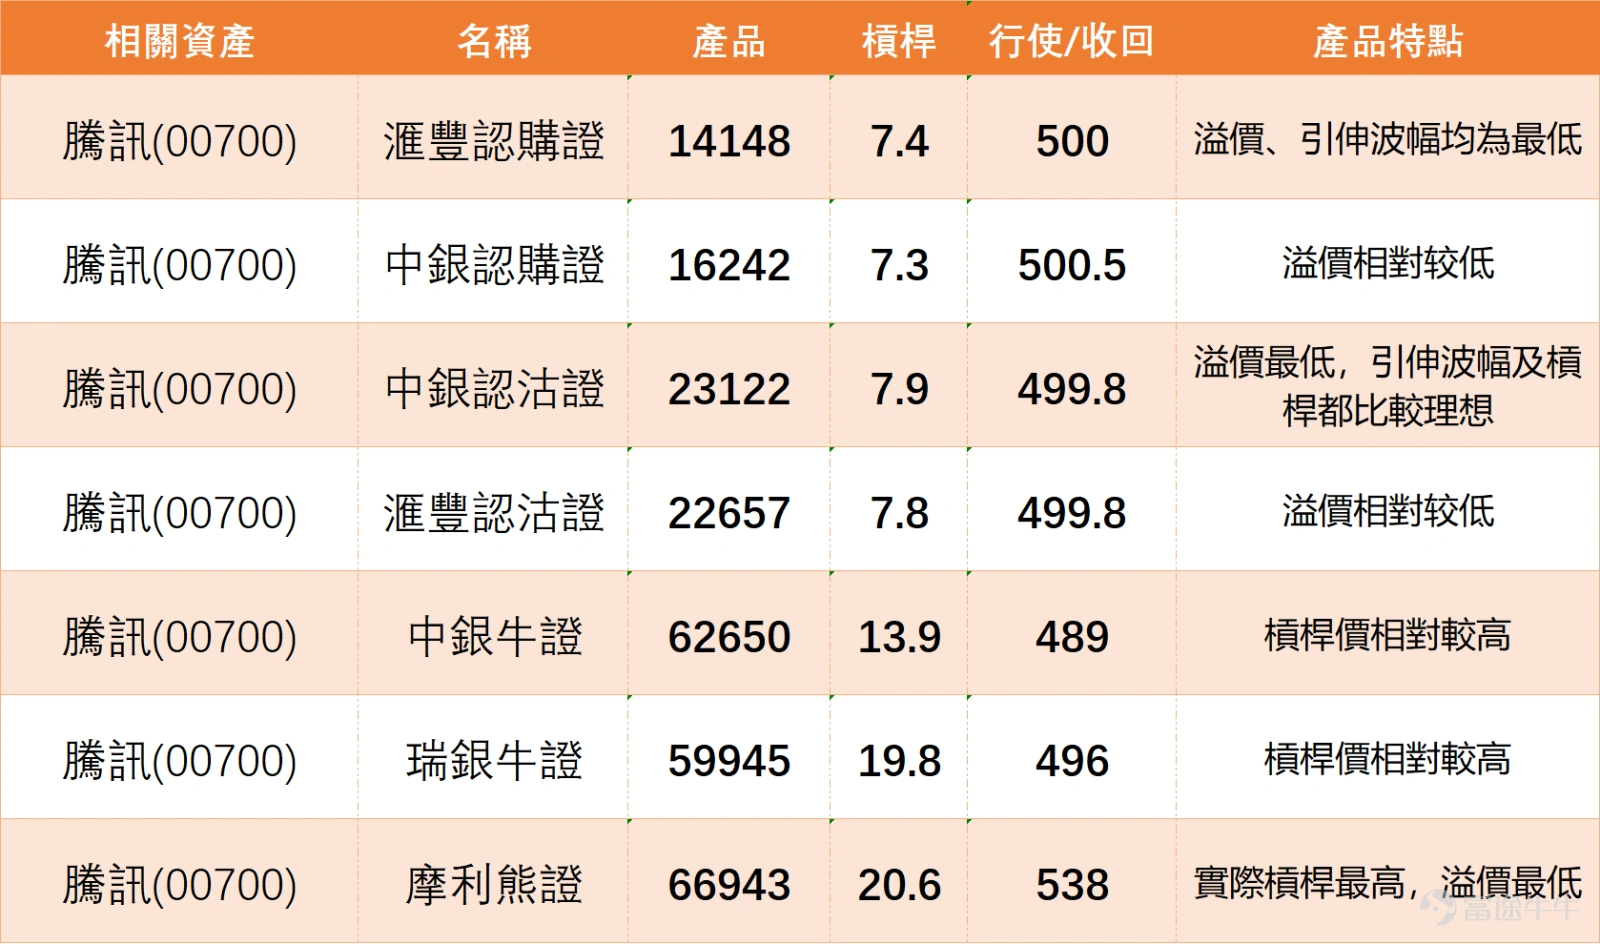
For Tencent call warrants, investors may consider the following. $HSTENCT@EC2607A.C (14148.HK)$ This warrant has an exercise price of 500 yuan, and its distinguishing feature is that both its premium and implied volatility are among the lowest in comparable products. This means the cost of holding the warrant is relatively low, and the risk of price being affected by volatility changes is also smaller. It is suitable for investors who are optimistic about Tencent's future and wish to deploy at a lower cost.
As for put warrants, $BITENCT@EP2606A.P (23122.HK)$ is one of the choices with a strike price of 499.8 HKD. The reason for recommendation is that its premium is the lowest among similar products, while implied volatility and leverage levels are relatively ideal, offering an efficient hedging or bearish tool for investors who are pessimistic about Tencent's short-term performance.
Among bull contracts, $UB#TENCTRC2608F.C (59945.HK)$ is worth noting, with a call price of 496 HKD. The leverage ratio of this bull contract is close to 20x, which is a relatively high level, providing potentially higher returns if Tencent’s share price rises, making it suitable for risk-tolerant aggressive investors who strongly believe in Tencent's upcoming rebound.
Finally, regarding bear contracts, $MS#TENCTRP2812I.P (66943.HK)$ has a call price of 538 HKD. This bear contract offers the highest actual leverage among all products at approximately 20.6x, while also having the lowest premium, providing an attractive choice for investors who are bearish on the market outlook and seek high leverage effects to amplify potential gains.
Tencent's stock price has broken through both the 10-day and 20-day moving averages. Do you think this is more of a short-term technical rebound or a signal of a mid-term trend reversal? Feel free to share your insights in the comments section. For more market analysis, please stay tuned to 'HK Stock Warrants Jenny' for daily updates!
Disclaimer: This article does not constitute any investment advice.。
This article is for reference only and does not constitute any investment advice. The market data, opinions, and analysis contained herein may change at any time without prior notice. We are not responsible for any loss or damage caused by reliance on the information in this article. Technical analysis only shows whether certain technical conditions are met; a comprehensive assessment of asset performance should be conducted using additional data. Decisions to trade should not be based solely on this article. Please note that past performance is not indicative of future results.
#HongKongStocks #HangSengIndex #RealTimeAnalysis #WarrantsSelection #WarrantsStrategy #DerivativesHedging #HongKongWarrantsJenny #BlueChipStocks #TencentHoldings #00700$Hang Seng Index (800000.HK)$$Hang Seng TECH Index (800700.HK)$
Risk Disclaimer: The above content only represents the author's view. It does not represent any position or investment advice of Futu. Futu makes no representation or warranty.Read more
Comments
to post a comment
1