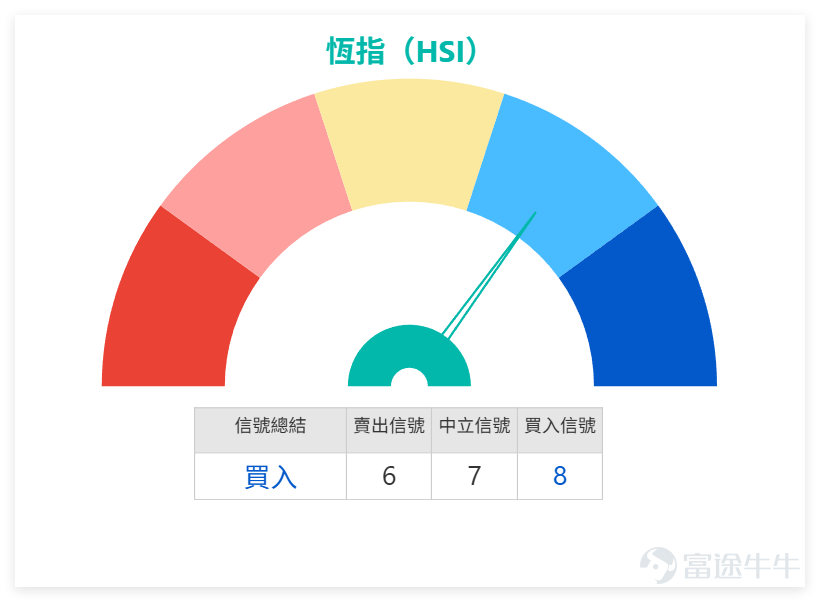

The technical divergence of the Hang Seng Index intensifies, and the market's downward trend remains unchanged.
On the previous day (March 9), $Hang Seng Index (800000.HK)$
The index closed at 25,408.46 points, falling 1.35% in a single day, with a five-day volatility of 5.2%. The overall market exhibited a weak oscillation and pullback pattern, as the technical rebound from the previous trading day (March 6) failed to continue.

From a market logic perspective, the upper moving average system (especially MA10 and MA30) exerted effective pressure, with investors showing strong willingness to reduce holdings on rallies. The trading volume was 392.33 billion yuan, failing to expand during the rebound, which also reflects insufficient market confidence, and no clear signs of stabilization have emerged yet.
The most prominent feature of the market yesterday was the exacerbation of the 'price decline versus indicator buy' technical divergence phenomenon. We will analyze this further using individual stock data:
1. Moving Averages: The closing prices of most blue-chip stocks are below short- and medium-term moving averages such as MA10 and MA30. Only a few individual stocks, such as HSBC (00005) and ICBC (01398), closed above MA60. The overall moving average system shows a weak arrangement, with significant pressure for a short-term rebound. Meanwhile, China Construction Bank (00939): closed at HKD 7.92, also above MA60, with RSI44 nearing neutrality. It was one of the few blue chips that closed higher on the previous day. Technically, it lacks clear direction, indicating a narrow-range oscillation pattern.
2. RSI Indicator: Alibaba's (09988) RSI is only 25, and Tencent's (00700) RSI is 29, both entering the oversold zone. Most stocks have RSI values in the range of 30-45, indicating weakness but approaching the oversold edge, suggesting that short-term downward momentum may slow.
3. Comprehensive Signals: Several stocks, including Alibaba, Ping An (02318), and AIA (01299), show a "buy" signal from comprehensive technical indicators, with strength levels between 7-11. This is mainly due to rapid stock price declines causing oscillating indicators to become oversold, triggering systematic buy signals. However, this does not mean a trend reversal, but rather the possibility of short-term technical recovery.
4. Support and Resistance: The support levels for the Hang Seng Index are 24,780 and 24,018, while the resistance levels are 26,242 and 26,975. On the previous day, the Hang Seng Index traded around 25,408, which is in the middle range. Going forward, attention should be paid to the defensive strength of the lower support level.
Review and Selection of Warrants and Bull/Bear Products:
Combining market trends, we review previously recommended warrant and bull/bear products, and select two suitable products for your reference:
(1) Review of previous products:
The four Hang Seng Index-related products recommended on March 3 all saw good gains, aligning with the downward movement of the index:
1. J.P. Morgan Put Warrant (22976): Increased by 19% over two days, corresponding to a 1.73% drop in the Hang Seng Index.
2. BOC Put Warrant (24183): Increased by 17% over two days, corresponding to a 1.73% drop in the Hang Seng Index.
3. BOC Bear Certificate (66631), BOC Bear Certificate (66206): Increased by 38% and 37%, respectively, over two days, perfectly aligning with market trends. This also reminds everyone that leveraged products like CBBCs and warrants have high leverage, so close attention must be paid to market volatility.
(II) Selected Products:
In light of the market's bearish bias and the Hang Seng Index’s volatile pullback, two standout products have been selected, balancing risk and flexibility:
1. BOC Put Warrant (24183): Leverage 9.9, exercise price 23,482. Its key feature is the lowest implied volatility, with relatively high leverage, matching the current bearish market trend, offering strong operational flexibility.
J.P. Morgan put warrants (22976): Leverage 11.3, strike price 23,400. Key features include the lowest premium, relatively high leverage, and controllable cost, making it suitable for short-term trading in line with market movements.
Risk Warning: Leveraged products such as CBBCs and bull/bear contracts are derivatives with significant leverage effects and high volatility. Investors should trade responsibly according to their risk tolerance.
The market is still in the process of bottom-fishing and consolidating. Before effectively reclaiming and stabilizing above the MA10, caution is advised, and excessive trading should be avoided. Focus on two key points: whether individual stocks can stabilize at current levels, and changes in trading volume. For stocks showing technical divergence, some attention can be given, but blindly bottom-fishing should be avoided until clear reversal signals appear.
Your current sentiment on Hong Kong stocks is: A. Pessimistic, preparing to reduce positions. B. Optimistic, currently adding positions. C. Numb, already taking a passive approach. Feel free to share your insights in the comment section.
Reminder: This article does not constitute any investment advice.
This article is for reference only and does not constitute any investment advice. The market data, opinions, and analysis contained herein may change at any time without prior notice. We are not responsible for any loss or damage caused by reliance on the information in this article. Technical analysis only shows whether certain technical conditions are met; a comprehensive assessment of asset performance should be conducted using additional data. Decisions to trade should not be based solely on this article. Please note that past performance is not indicative of future results.
#HongKongStocks #HangSengIndex #RealTimeAnalysis #WarrantsSelection #WarrantsStrategy #DerivativesHedging #BlueChipStocks #FinancialSector #TechnicalAnalysis
Risk Disclaimer: The above content only represents the author's view. It does not represent any position or investment advice of Futu. Futu makes no representation or warranty.Read more
Comments
to post a comment