
XPeng Motors tests key resistance level; can the rebound continue?
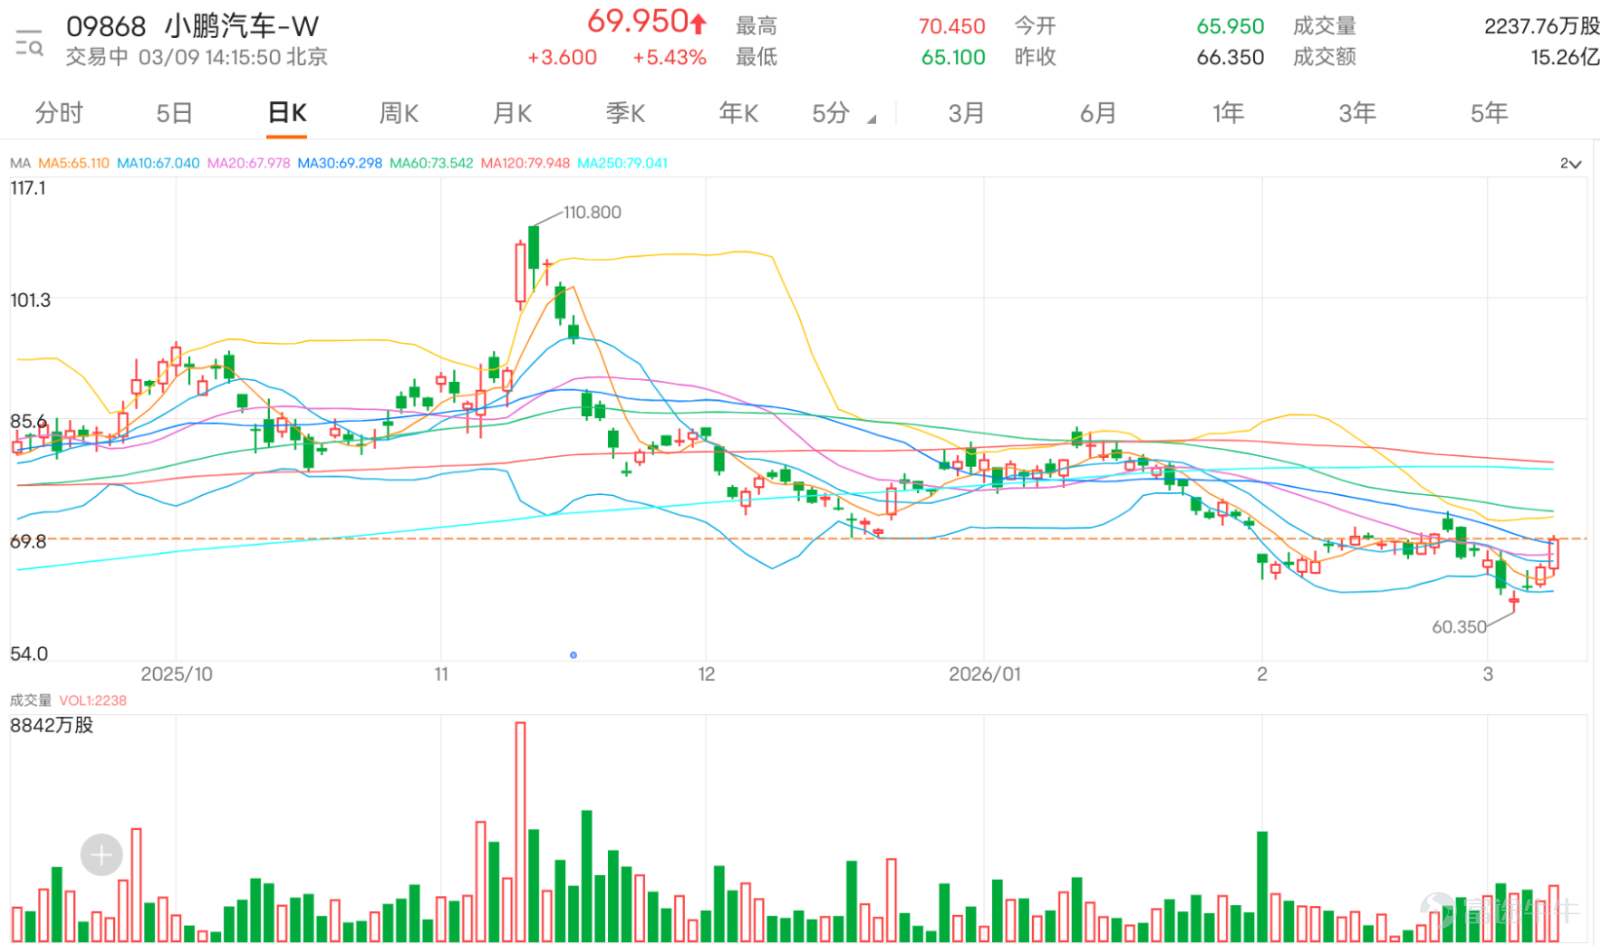
$XPENG-W (09868.HK)$ Today’s performance was strong, with the share price rising more than 5% against the market trend, hitting a high of 70.45 yuan during trading. This increase not only recovered the earlier losses but also allowed the stock price to successfully surpass the 10-day (66.81 yuan) and 30-day (69.22 yuan) moving averages, showing significant improvement in short-term technical patterns. The trading volume increased to 1.526 billion yuan, indicating stronger capital inflows and providing volume support for this breakout.
Based on an analysis of key technical indicator signals, multiple oscillation indicators show strengthening or buy signals, providing positive guidance for short-term trends. Although some oscillators, such as the Stochastic Oscillator and CCI, remain neutral, suggesting momentum has not fully erupted, core trend indicators have already issued positive signals. Specifically, the MACD indicator has turned into a 'buy' signal, indicating that downward momentum is weakening while upward momentum may be building up. Additionally, the Bollinger Bands also issued a 'buy' signal, combined with the price rebounding from the middle-lower part of the band, implying that the short-term volatility range may shift upwards. Moreover, the Bull-Bear Power indicator shows 'oversold, possible bottom formation, buy,' further reinforcing the view that the stock is finding support at recent lows and attempting to form a rebound base. However, the Momentum Oscillator and VR Volume Ratio still display 'neutral' or 'sell' signals, reminding investors to monitor whether the upward movement can sustain and if volume steadily follows.
In terms of key price levels, according to technical analysis, the stock price is currently facing the first important resistance level at 70.8 yuan, and today's intraday high has come very close to this position. If it can effectively break through and stabilize above this level, the next target will be the resistance level at 75.8 yuan. Below, initial support is at 63.9 yuan (Support 1), with stronger support located at 59.5 yuan (Support 2). The current stock price has moved away from recent lows and crossed above the short-term moving average, making the 63.9 to 66.8 yuan (MA10) range the preliminary support zone.
To summarize the above analysis, XPeng Motors' short-term technical outlook shows signs of transitioning from weak to strong. The stock price has broken through two short-term moving averages on increased volume, and several indicators such as MACD, Bollinger Bands, and Bull-Bear Power are signaling 'buy,' indicating that buying pressure in the market is increasing and the rebound momentum may continue. However, since the stock price is approaching the key resistance level at 70.8 yuan and some momentum indicators have yet to fully confirm, short-term fluctuations may occur around this level. Overall, technical indicators suggest a moderately positive short-term trading signal. It is recommended to closely watch whether the stock price can break through the resistance level at 70.8 yuan. If a successful breakthrough occurs with sustained trading volume, the probability of an upward move increases. Conversely, if it encounters resistance and falls back, attention should be paid to the support level near the MA10 line. For operations, under the condition of setting a stop-loss (for example, below the support level at 63.9 yuan), consider opportunistically participating in short-term trades.


XPeng Motors (09868) Derivatives Market Layout
Call warrants: Street holdings concentrated in the $108-110 range (72.8%) and $88-90 range (17.9%), with trading volume in the $88-90 range accounting for 69.2%. Out-of-the-money by 27.9%-29.7%, actual leverage 5.7-5.9 times, expiring in about 180 days. Suitable for medium-term investors optimistic about the implementation of autonomous driving and growth in deliveries.
Put warrants: Street holdings concentrated in the $58-60 range (47.8%) and $60-65 range (32.5%), with trading volume in the $58-60 range accounting for 87.3%. Out-of-the-money by 13.6%-15.2%, actual leverage 1.9-2.4 times, expiring in about 120 days. Primarily used as a medium-term hedging tool for holding stocks.
Bull contracts: Street holdings concentrated in the $57-60 range (22.66%) and $51-57 range (5.52%), with trading volume in the $57-59 range accounting for 91.3%. Out-of-the-money by 15%-17.5%, actual leverage 4.7-6.1 times, expiring in about 150 days. Moderate forced call distance and direct tracking of price movements make it suitable for short-term rebound speculation.
Bear contracts: Street holdings concentrated in the $70-75 range (3.45%) and $85-90 range (2.55%), with trading volume in the $70-75 range accounting for 70.3%. Out-of-the-money by 0.8%-7.3%, actual leverage 10.2-23.1 times. Extremely high leverage makes it suitable for short-term speculative bets on stock price pullbacks.
Product Picks:
For investors bullish on the future stock price, there are two bull contracts available in the market. One is $HS#XPENGRC2610A.C (56220.HK)$ , with a forced call price set at $58, offering actual leverage of 5.5 times, combined with the advantage of the lowest premium. The lower forced call price provides some buffer space, while the combination of high leverage and low premium makes it an efficient bullish tool. Another option is $BP#XPENGRC2803B.C (56514.HK)$ , with a forced call price of $59 and slightly higher actual leverage of 5.8 times, with the premium also at a relatively low level. This product suits aggressive investors who can tolerate slightly higher forced call risk in exchange for potentially higher returns.
If you hold a bearish view, you may consider products from $CIXPENG@EP2608A.P (23729.HK)$ . This product has an exercise price of $58.88, and its key feature is the lowest premium among similar products, meaning that the cost of being wrong on direction is relatively low, and the pressure of time value decay is smaller. It suits investors with a clear view of short-term pullbacks and who want to control costs. Meanwhile, $UB#XPENGRP2812A.P (55598.HK)$ offers highly leveraged tools for shorting. Its forced call price is set at $75, with actual leverage as high as 8.5 times.

XPeng Motors surged 5% against the market trend today. Do you think this rebound is a short-term pullback or the start of a trend reversal? XPeng reached an intraday high of 70.45 yuan, just a step away from the resistance level at 70.8 yuan. Do you think it will break through successfully tomorrow? Feel free to share your thoughts in the comments section.
Disclaimer: This article does not constitute any investment advice. It is for reference only and does not constitute any investment advice. Market data, opinions, and analysis presented may change at any time without prior notice. We are not responsible for any loss or damage caused by reliance on the information in this article. Technical analysis only indicates whether certain technical conditions are met; asset performance should be comprehensively evaluated using additional sources, and trading decisions should not be made solely based on this article. Please note that past performance is not indicative of future results. For more market analysis, stay tuned to Jenny's daily updates on 'HK Stock Warrants'!
#HongKongStocks #HangSengIndex #RealTimeAnalysis #WarrantsSelection #WarrantsStrategy #DerivativesHedging #HongKongWarrantsJenny #XiaopengMotors #09868 #TechnicalAnalysis$Electric Vehicles (LIST2568.US)$$Hang Seng Index (800000.HK)$$Hang Seng TECH Index (800700.HK)$
Risk Disclaimer: The above content only represents the author's view. It does not represent any position or investment advice of Futu. Futu makes no representation or warranty.Read more

Comments
to post a comment
2