Hong Kong stocks are rebounding—what sectors deserve attention?

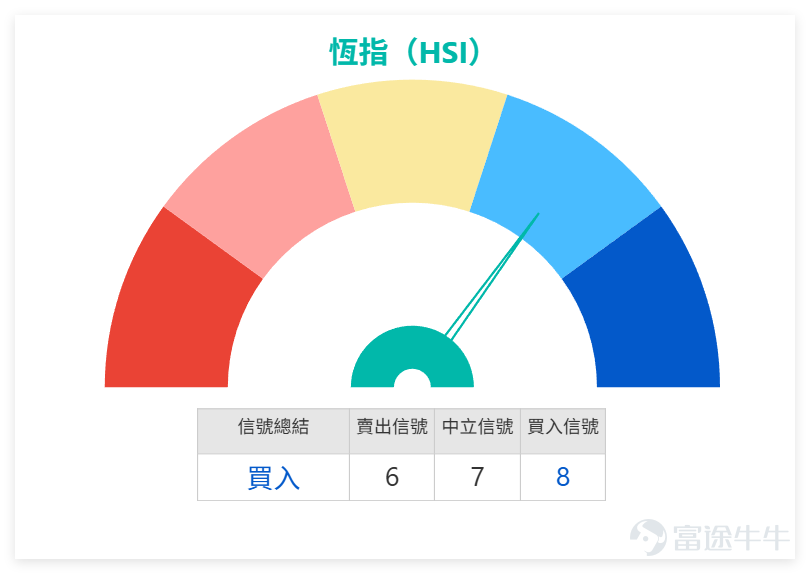
The technical aspect of Hang Seng Index shows 'neutral-bullish', with significant structural divergence
Last Friday (March 6th), $Hang Seng Index (800000.HK)$
The market closing situation was clear, opening at 25,358.56 points and closing the day at 25,757.29 points, a single-day increase of 1.72%, rising by 435.95 points. The lowest point of the day was 25,267.63, and the highest was 25,806.72. The turnover was 292.766 billion yuan, with a trading volume of 187 million hands. Overall, the market showed an upward trend after the opening, driving the overall recovery of the Hong Kong stock market.
Combining blue-chip and Hang Seng Index technical data, last Friday (the 6th) presented three major technical characteristics, which we will break down for you as follows:
1. Clear oversold rebound signals for tech stocks: Tencent (00700) and Alibaba (09988) have RSI values of 29 and 25 respectively, both entering the oversold zone. Comprehensive technical indicators suggest 'Buy' and 'Strong Buy' signals respectively. Notably, Alibaba's buy signal strength is as high as 16, making it the strongest individual stock signal of the day, representing a typical technical rebound after excessive decline. However, both stock prices remain below medium-term moving averages such as MA30 and MA60, indicating they have not yet broken away from a weak trend.
2. Mixed technical picture for financial stocks: Banking stocks like HSBC Holdings (00005) and China Construction Bank (00939) have RSI levels in the neutral range of 47-48, with comprehensive signals showing 'Neutral'. Their share prices are consolidating narrowly around medium-term moving averages without clear direction, mostly following broader market trends. AIA (01299) experienced a slight rise but showed a minor divergence with a 'Sell' technical signal, requiring attention to subsequent movements.
3. HSI technicals lean slightly bullish: Support is at 25,042 points, resistance at 26,628 points, with an RSI of 36. The composite signal is 'buy,' but trend indicators like MACD and Bollinger Bands still favor 'sell.' This aligns with individual stock movements, all pointing to the current rebound being a short-term correction following an oversold period.

In the short term, focus on rebound opportunities in oversold individual stocks, but avoid blindly chasing highs. Pay close attention to whether stock prices can break through key moving averages like MA10 and MA30 with increased volume. Short-term trading should be the main strategy, with careful risk management.
Warrants and Bull/Bear Contracts: Review and Selection
1. Review of previous products:
Reviewing the Hang Seng Index-related CBBCs recommended on March 2, their performance was impressive: J.P. Morgan Put Warrant (23955) rose by 39% within two days, while BOC Bear Certificates (65611) and (60265) surged by 70% and 63%, respectively, accurately capturing the earlier adjustment trend of the Hang Seng Index. This provides valuable reference for investors focusing on derivatives.
2. Today's selected products:
In line with the market rebound rhythm, two products suitable for short-term following of market trends are selected, with a focus on balancing leverage and premium:
① J.P. Morgan Put Warrant (23955): Leverage of 9.7x, exercise price at 23,600 points. Its core feature is the highest leverage with the lowest premium and implied volatility, suitable for investors sensitive to short-term market fluctuations and seeking efficient leverage.
② BOC Bull Certificate (53747): Leverage of 27.4x, call price at 24,818 points. Its core feature is relatively low premium, aligning well with the rebound rhythm of the Hang Seng Index, ideal for investors optimistic about a continued short-term rebound.
Risk Warning: CBBCs have leveraged attributes and high volatility; investors should choose based on their risk tolerance and operate cautiously.
What’s your preference for short-term trading? A. Follow the rebound. B. Stay on the sidelines. C. Reduce positions on rallies. Feel free to share your thoughts in the comments section.
Reminder: This article does not constitute any investment advice.
This article is for reference only and does not constitute any investment advice. The market data, opinions, and analysis contained herein may change at any time without prior notice. We are not responsible for any loss or damage caused by reliance on the information in this article. Technical analysis only shows whether certain technical conditions are met; a comprehensive assessment of asset performance should be conducted using additional data. Decisions to trade should not be based solely on this article. Please note that past performance is not indicative of future results.
#HKStocks #HangSengIndex #LiveAnalysis #CBBCSelection #CBBCStrategy #DerivativesHedging #Tencent #Alibaba #HSBC #TechnicalAnalysis
Risk Disclaimer: The above content only represents the author's view. It does not represent any position or investment advice of Futu. Futu makes no representation or warranty.Read more
Comments
to post a comment