
Hong Kong stocks pull back—how will they perform in the second half of the year?

Alibaba (9988) surged nearly 4%, with key resistance at 144.8 yuan becoming the focal point
$BABA-W (09988.HK)$ Surging nearly 4%, the stock hit a high of 132 yuan during trading. However, observing the overall trend, the share price remains in a lower range, with short-term technical indicators presenting complex signals that warrant deeper analysis.
The current trend shows that although Alibaba's stock price rebounded by more than 3%, it has not yet broken away from the weak pattern. The latest price of 131.2 yuan is significantly below key moving averages, including the 10-day average (139.35 yuan), 30-day average (154.46 yuan), and 60-day average (152.85 yuan), indicating that the stock has fully broken through support levels and the short-term trend remains bearish. However, the single-day rebound accompanied by increased trading volume may signal bargain hunting buying entering, laying the groundwork for a technical rebound. A 5-day volatility of 11.7% reflects heightened fluctuations, coupled with an upward probability of 0.73, suggesting that the chance of a short-term strengthening cannot be ignored.
In terms of technical indicators, multiple oscillation indicators are signaling buy opportunities, enhancing expectations of a rebound. The stochastic oscillator indicates a buy, while the Relative Strength Index (RSI) stands at 25, entering the oversold region, traditionally considered a strong buy signal, implying selling pressure may be waning. The Williams %R indicator also supports buying, and both the momentum oscillator and rate-of-change indicator suggest a recovery in buying power, particularly as the rate-of-change indicator hints that selling may be contracting, further solidifying the foundation for a rebound. However, investors should be mindful of mixed signals: the CCI indicator is neutral, and the ADX indicator suggests combining RSI oversold conditions to consider buying, but the psychological line indicator is neutral, and other indicators such as the bull/bear power index, Ichimoku Cloud, MACD, and Bollinger Bands all signal sell opportunities, reflecting that the medium- to long-term trend has not reversed. Short-term operations should be approached cautiously.
Support and resistance level analysis provides key references for short-term trading. Current support level 1 is at 122.7 yuan, and support level 2 is at 110.4 yuan. If the stock can hold above support level 1, the rebound momentum may continue; otherwise, if it breaks down, it could test support level 2. In terms of resistance, the first key resistance level 1 is set at 144.8 yuan, near the 10-day moving average. Breaking this level will challenge resistance level 2 at 158.3 yuan.
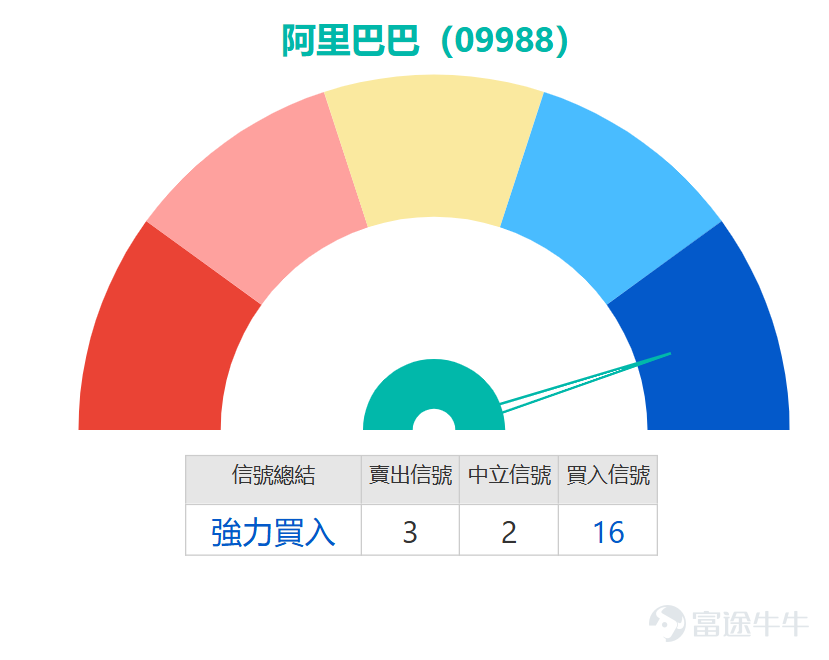
Based on comprehensive technical signals, Alibaba presents a short-term buying opportunity primarily due to mature conditions for an oversold rebound. Technical indicator summary signals a “strong buy,” with strength reaching 16, supported by multiple oscillating indicators turning positive. Professional investors are advised to consider short-term positioning. If the stock can stabilize above 122.7 yuan and break through 144.8 yuan with increased trading volume, the rebound trend may strengthen further. However, risks lie in the moving average system still showing a bearish arrangement, and some trend indicators like MACD leaning bearish. Investors should set strict stop-loss levels below 110.4 yuan and monitor changes in trading volume to confirm momentum. Overall, Alibaba’s short-term technical outlook leans towards a rebound, but confirmation will require breaking through resistance levels—flexible trading strategies are recommended.
The derivatives market of Alibaba has shown a distinct pattern of long-short博弈 over the past three trading days. Long-term bullish funds have continued to flow in, while short-term high-leverage positions have significantly been liquidated. Specifically, the street volume of call warrants has achieved a three-day consecutive increase, rising from 9239.9 million units on March 3 to 9804.2 million units on March 5, accumulating an increase of 564.3 million units, or a 6.1% rise, reflecting that off-market funds are actively positioning for a medium-to-long term rebound. Meanwhile, the street volume of put warrants has sharply retreated from 1490.94 million units to 1042.02 million units, with a three-day decline of 30.1%, indicating a clear weakening of bearish expectations.
Bull and bear certificates reveal increased short-term volatility. The street volume of bull certificates slightly rose by 1.3% to 1386.49 million units on March 4 but then plummeted by 277.14 million units the next day, shrinking 20% in a single day, mainly due to stock price pullbacks triggering forced liquidation of a large number of highly leveraged bull certificates. The street volume of bear certificates first rose and then fell, growing by 16.6% to 261.68 million units on March 4, and then retreating to 233.71 million units as the stock price stabilized, representing only 2.4% of the call warrant volume, reflecting relatively limited bearish power.


Product Review: On March 2, 2026, Alibaba (09988) common stock fell cumulatively by 4.77% in two trading days after the mentioned date, and all four bearish products recorded significant positive returns, among which $DSALIBA@EP2606A.P (20535.HK)$ the increase reached 36% two days later, making it the best-performing product in this batch, $UB#ALIBARP2811F.P (65172.HK)$ with a rise of 33%, $JP#ALIBARP2812L.P (64231.HK)$ an increase of 30%, $BIALIBA@EP2606A.P (20584.HK)$ a rise of 29%. All products’ gains significantly outperformed the decline of the underlying stock, fully demonstrating the advantage of leverage effects of derivatives in hedging or speculating on short-term trends.

Product Picks:
For call warrants, investors may consider $UBALIBA@EC2608F.C (26538.HK)$ , with an exercise price of 150.09 yuan, offering approximately 5.5 times actual leverage. Its characteristic is relatively low premium, enabling efficient tracking of the underlying stock’s rise. Another option is $BIALIBA@EC2608E.C (26562.HK)$ , with the same exercise price of 150.09 yuan and leverage of about 5.6 times. Its greatest advantage lies in having both the lowest premium and implied volatility in the market, resulting in relatively attractive holding costs. These two products are suitable for investors who are optimistic about Alibaba breaking through and stabilizing above resistance levels.
Put warrants serve as hedging or bearish tools, $GJALIBA@EP2606A.P (20512.HK)$ with a strike price of 129.9 yuan, offering about 5.3 times leverage, their premium and implied volatility are among the lowest, making them a relatively controllable cost even when used as a contrarian hedging tool. Another one, $BIALIBA@EP2606A.P (20584.HK)$ with the same strike price of 129.9 yuan and about 5 times leverage, is characterized by a relatively low premium. These two products are suitable for investors who believe that the share price may first retest support levels before rebounding or need to hedge short-term risks in their holdings.
Bull certificates are suitable for capturing short-term rebounds but require strict control of forced recovery risk. $UB#ALIBARC2608F.C (54590.HK)$ with a recovery price of 120 yuan, offers about 9.4 times leverage with a relatively lower premium and a farther recovery distance, providing a relatively higher safety margin. For those seeking higher leverage, consider $UB#ALIBARC26074.C (53784.HK)$ with a recovery price of 121.4 yuan and actual leverage of about 10.6 times, making it the lowest premium option in its category. These two bull certificates are suitable for aggressive investors who believe the stock price has stabilized near the support level and is about to start a technical rebound, but they must closely monitor stock price fluctuations to avoid being called back.
Regarding bearish certificates, $HS#ALIBARP2810D.P (68378.HK)$ with a recovery price of 145 yuan and leverage of about 9.8 times, boasts the lowest premium and relatively high actual leverage. Another one, $UB#ALIBARP2810G.P (69096.HK)$ with the same recovery price of 145 yuan and leverage of about 9.5 times, features a relatively lower premium. These two bearish certificates are suitable for investors expecting a short-term pullback after the stock price hits key resistance levels and hoping to capture this move with small capital. Strict stop-loss discipline must be enforced during operation.

Do you think Alibaba's recent oversold bounce is a fleeting technical rebound or the beginning of a valuation recovery? The street volume of Alibaba call warrants has climbed for three consecutive days, with significant short-covering observed. Do you believe the derivatives market’s fund flow can serve as a leading indicator for future trends? Feel free to leave your thoughts in the comments section.
Disclaimer: This article does not constitute any investment advice. It is for reference only and does not constitute any investment advice. Market data, opinions, and analysis presented may change at any time without prior notice. We are not responsible for any loss or damage caused by reliance on the information in this article. Technical analysis only indicates whether certain technical conditions are met; asset performance should be comprehensively evaluated using additional sources, and trading decisions should not be made solely based on this article. Please note that past performance is not indicative of future results. For more market analysis, stay tuned to Jenny's daily updates on 'HK Stock Warrants'!
#HongKongStocks #HangSengIndex #RealTimeAnalysis #WarrantsSelection #WarrantsStrategy #DerivativesHedging #HongKongWarrantsJenny #Alibaba #09988 #TechnicalAnalysis$Hang Seng Index (800000.HK)$$Hang Seng TECH Index (800700.HK)$$Alibaba (BABA.US)$
Risk Disclaimer: The above content only represents the author's view. It does not represent any position or investment advice of Futu. Futu makes no representation or warranty.Read more

Comments
to post a comment
1
1