
The rebound momentum of the Hang Seng Index is weak, key resistance at 26,300 points
On the previous day (March 5th) $Hang Seng Index (800000.HK)$
The index closed at 25,321 points, recording a slight rebound with a daily increase of approximately 0.28%.
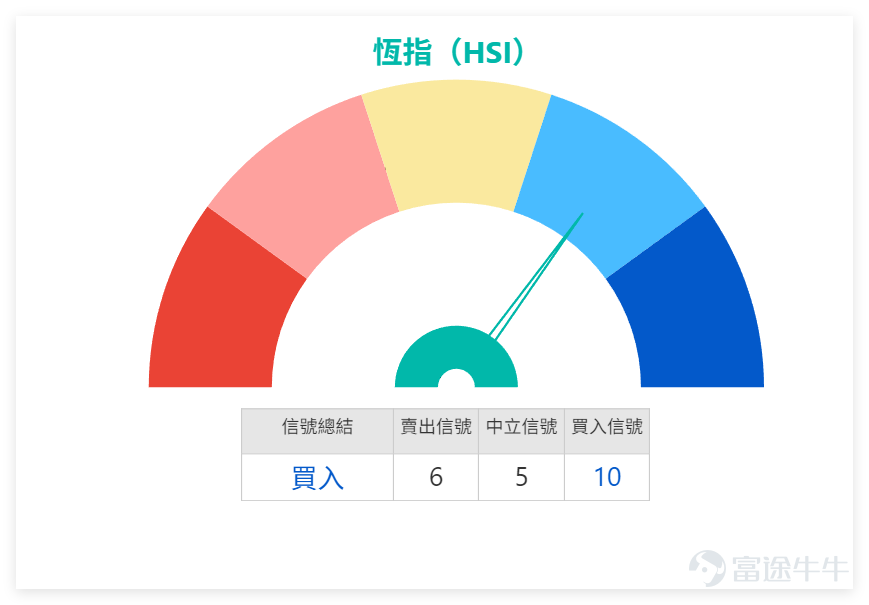
In our 【HK Stock Report】, we commented on the Hang Seng Index (HSI): Although the index has halted its decline, from the closing level, it remains below the lower band of the Bollinger Bands on the daily chart, indicating that the rebound strength is relatively limited and can only be considered as a preliminary stabilization. A clear upward breakout signal has not yet appeared. From a technical perspective, the current support level for the HSI is around 24,800 points, about 500 points away from the closing price; the resistance level is at 26,300 points, with a gap of approximately 1,000 points. If the index unfortunately breaks below the 24,800-point support, there is a higher chance of further testing the 23,800-point level. Conversely, if it successfully breaks through the 26,300-point resistance, it may aim to test above the 27,000-point level. These key levels can serve as references for deployment.
It is worth noting that the Hang Seng Index has not shown a clear buy signal, primarily because the rebound lacks volume support. Trading volume has not significantly increased, and major trend indicators such as MACD and Bollinger Bands remain in weak zones, failing to form bullish resonance. Only the RSI, which is in the oversold zone, suggests short-term rebound potential but has yet to meet the confirmation conditions for a buy signal. This is also the core logic behind the Hang Seng Index’s continued lack of a clear buy signal.

Blue chips showed mixed performance yesterday (5th), with overall volatility being minimal. Based on technical indicators, they can be divided into three categories, allowing investors to quickly identify their positions:
1. Oversold Rebound Category: Led by Tencent (00700) and Alibaba (09988). Tencent closed at HKD 502.00, down 0.79% for the day, with the closing price below all major moving averages. Its RSI is at 28, entering the oversold zone. Alibaba closed at HKD 126.30, falling 2.77% for the day, with an RSI of just 23, which indicates extreme oversold conditions. Both stocks have technical indicators signaling a buy, suggesting mature conditions for a technical rebound.
2. Stable Resilience Category: HSBC Holdings (00005), China Mobile (00941), and ICBC (00939). HSBC closed at HKD 133.90, rising 2.37%, with the closing price above the MA30 and MA60. Its RSI is 48, trending towards neutral. China Mobile closed at HKD 78.30, unchanged for the day, with an RSI of 42. The combined signals indicate a strong buy. These stocks are supported above their medium-term moving averages, showing relatively stable trends.
3. Volatile Divergence Category: AIA (01299) and ICBC (01398). AIA closed at HKD 85.10, surging 5.06% for the day, but the overall technical signal remains a sell. ICBC closed at HKD 6.36, up 0.32%, with an RSI of 50, leaning towards a sell signal. This shows a divergence between the stock price and technical indicators, implying a volatile short-term trend.
The market displayed four main characteristics yesterday (5th): first, strong oversold rebound signals, especially evident in new economy stocks; second, financial stocks remained relatively stable with strong resilience; third, technical divergence was common, with discrepancies between market sentiment and technical indicators; fourth, the market direction remains unclear, still in a weak bottom-seeking or volatile consolidation phase.
Overall, the market has preliminarily met the conditions for a technical oversold rebound after consecutive declines. However, the major trend indicators have not yet improved, and any rebound should be regarded as a correction of technical overselling. Its sustainability and magnitude need further observation.
Review and Selection of Warrant and Bull/Bear Products
Let's review the performance of the warrant products recommended earlier: The Hang Seng Index JPMorgan put warrant (22976) and Bank of China put warrant (24183) mentioned on February 27th saw increases of 56% and 48%, respectively, over two days, corresponding to a 3.24% drop in the Hang Seng Index, aligning with market movements. They can serve as references for subsequent deployment.
Two selected Hang Seng Index warrant products are now recommended, catering to different investor needs, and are provided for technical reference only:
1. HSBC call warrant (23723): Leverage of 15.6 times, exercise price of 26,733 points, lowest premium and implied volatility, suitable for investors who are optimistic about a short-term rebound in the Hang Seng Index and seek stability.
2. J.P. Morgan Put Warrant (22976): Leverage of 11.9 times, strike price at 23,400 points, with the lowest premium and relatively high leverage, suitable for investors who believe the Hang Seng Index's rebound will be weak and seek to hedge risks.
Risk Warning: Warrants are derivatives with significant leverage effects. Investors should deploy based on their risk tolerance and manage position sizes.
The Hang Seng Index has slightly rebounded. Would you choose to reduce positions at higher levels or deploy at lower levels? Feel free to share your insights in the comments section.
Reminder: This article does not constitute any investment advice.
This article is for reference only and does not constitute any investment advice. The market data, opinions, and analysis contained herein may change at any time without prior notice. We are not responsible for any loss or damage caused by reliance on the information in this article. Technical analysis only shows whether certain technical conditions are met; a comprehensive assessment of asset performance should be conducted using additional data. Decisions to trade should not be based solely on this article. Please note that past performance is not indicative of future results.
#HKStocks #HangSengIndex #RealTimeAnalysis #WarrantSelection #WarrantStrategy #DerivativesHedging #Tencent #BlueChipStocks #TechnicalAnalysis
Risk Disclaimer: The above content only represents the author's view. It does not represent any position or investment advice of Futu. Futu makes no representation or warranty.Read more
Comments
to post a comment