
Analysis of HSBC's opportunity after a pullback, having risen from HKD 120 at the beginning of the year to HKD 148
HSBC Holdings (00005.HK) has recently become a market focus due to its price movement showing a pattern of surging and then retreating. As of March 5, 2026, HSBC was trading at HKD 134.5, up 2.91%, with an intraday high of HKD 137.5, breaking back above the 50-day moving average (approximately HKD 131.6). Although the stock rebounded significantly today, overall trends show that since touching a high of HKD 148 at the end of February, the stock has seen a notable pullback. Investors are now most concerned about whether the stock can stabilize at current levels after this rebound, and what the key price levels will be going forward.
From a technical analysis perspective, HSBC’s share price climbed with fluctuations from the HKD 120 level at the start of the year, reaching a high of HKD 148 by the end of February before undergoing adjustments influenced by external factors. Based on technical data as of March 5, the first support level for HSBC Holdings is around HKD 130.7, close to the low point of the late February pullback; the second more critical support level is at HKD 123.7, equivalent to the upper boundary of the consolidation range in late January. If the share price can hold steady at the current position and move upwards, the first resistance level will be at HKD 142.1, which is near the 10-day moving average (HKD 138.19); if it successfully breaks through this, the next resistance level will be around HKD 146.5, the top of the dense trading zone at the end of February, not far from the psychological threshold of HKD 150 closely watched by the market.
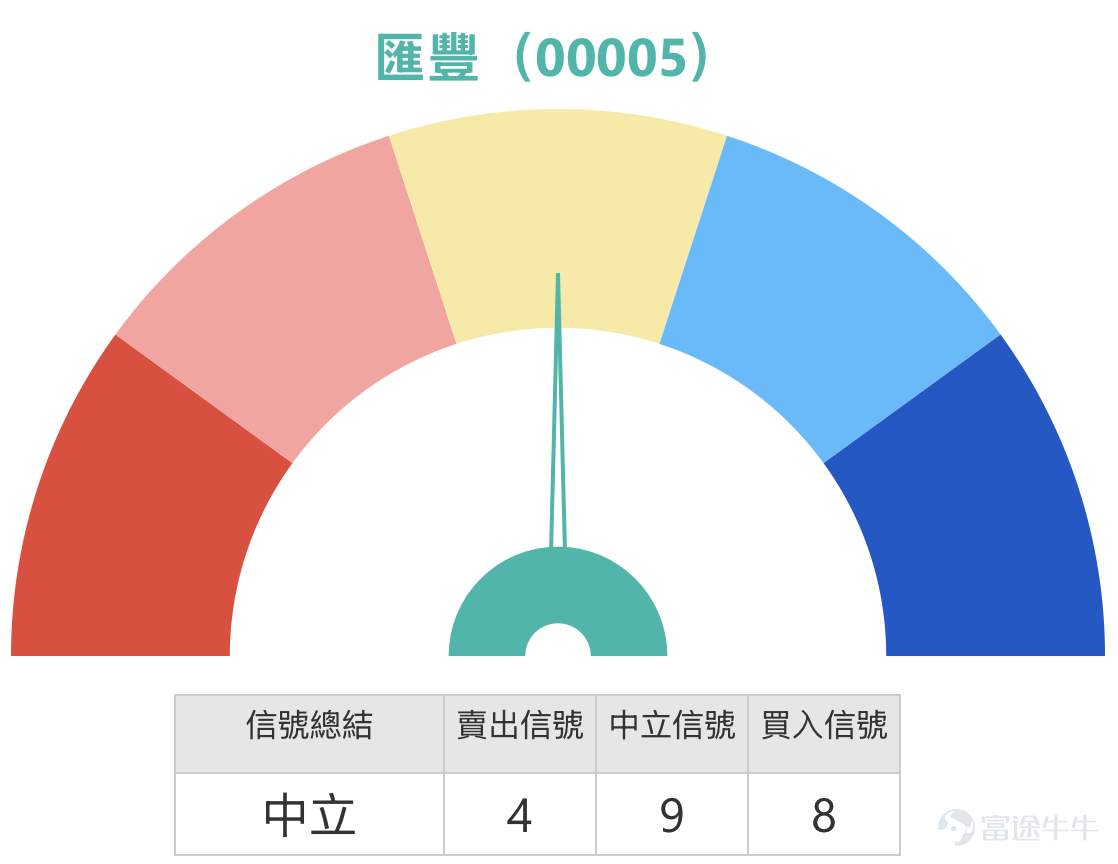
It is worth noting that, as of March 5, the summary signal of technical indicators is 'Neutral', with nine neutral signals indicating that bullish and bearish forces are temporarily balanced. Multiple oscillation indicator signals show 'Neutral'; the Relative Strength Index (RSI) is 49, near the midpoint of 50. The Williams %R and Stochastic Oscillator both indicate buy signals, while the CCI index shows neutrality. Meanwhile, trend-following indicators like the Bull-Bear Power Index suggest buying, but Ichimoku Clouds and MACD indicate selling, with Bollinger Bands showing neutrality. Overall, the current technical signals present a 'tug-of-war between bulls and bears' situation, requiring investors to closely monitor the stock's performance at key support and resistance levels.

In terms of market news, mixed positive and negative factors for HSBC Holdings have brought volatility to its stock price. On the positive side, the company has been conducting share repurchases. According to available data, multiple repurchases occurred during October 2025, with prices ranging from HKD 100.6 to HKD 103.8. In terms of institutional ratings, four research reports were issued in the last 60 days, with an overall positive rating. In stock performance, the March 5 intraday high reached HKD 137.5, breaking through the 50-day line, with active buying orders, and a buy-to-sell ratio of 82:18, resulting in net buying turnover of approximately HKD 43.75 million, reflecting active accumulation of funds. However, negative factors should not be ignored. Global banking stocks are under pressure due to concerns over credit risk and worries about narrowing interest margins affecting the sector as a whole.
Reviewing the February 26 view from [Hong Kong Stocks Podcast], the program noted that HSBC Holdings maintained an upward trend, rising from around HKD 120 at the start of the year to an intraday high of HKD 148. The program analyzed that the immediate resistance level is at HKD 150, and if broken, the next resistance level would be HKD 154.3. For call warrant strategies, Simon specifically reminded investors not to buy too far out-of-the-money products, as the higher leverage associated with greater out-of-the-money levels also brings higher risks and may not result in a high success rate. He suggested looking at products with smaller out-of-the-money levels, such as those with strike prices around HKD 148 or within HKD 159 (within 10% out-of-the-money), expiring in November or December of this year. He emphasized the need to consider implied volatility and premium differences along with leverage, comparing terms carefully to select products that offer better advantages. This view aligns with the resistance levels of HKD 142.1 and HKD 146.5 in the current technical analysis, with the HKD 150 mark remaining a key psychological resistance level.
In the review of warrant products, multiple HSBC-related derivatives mentioned on March 2, 2026, showed significant performance in the following two trading days (up to March 4). During this period, the underlying stock HSBC fell by 6.37%, while related bearish products recorded substantial gains: JPMorgan put warrants (23829) and JPMorgan bear certificates (59768) both rose by 43%; BOC put warrants (24062) performed the most outstandingly, recording a 52% increase.

With the current HSBC Holdings share price at HKD 135.1, combined with the aforementioned support level at HKD 130.7 and resistance levels at HKD 142.1 and HKD 146.5, investors can choose suitable warrants and bull/bear certificates based on their own views.
For investors who are optimistic about HSBC stabilizing at HKD 135 and rebounding upwards, two call warrants can be considered. BOC call warrant (22630). $BI-HSBC@EC2609B.C (22630.HK)$ Strike price HKD 145.1, offering about 7.6x leverage. This product stands out for its ideal leverage and implied volatility, making it suitable for cost-effective bullish strategies. Another option is BOC call warrant (23691). $BI-HSBC@EC2605A.C (23691.HK)$ Strike price HKD 148.1, with leverage of approximately 13.5x. This warrant has relatively low premium, effectively reducing holding costs. When choosing call warrants, note that the strike prices of HKD 145.1 and HKD 148.1 are higher than the current stock price, classifying them as slightly out-of-the-money to moderately out-of-the-money. Warrant 23691 offers higher leverage but is further out-of-the-money. Compared to Simon’s recommendation of 'out-of-the-money by less than 10%,' 22630's out-of-the-money level is about 7.4%, which aligns better with conservative principles; whereas 23691's out-of-the-money level is about 9.6%, still within Simon's mentioned range of below HKD 159, making it more suitable for aggressive investors.
For bull certificates, UBS Group bull certificate (59997) can be considered. $UB#HSBC RC2809F.C (59997.HK)$ Recovery price HKD 120, actual leverage 10.6x. This product has the lowest premium and relatively high actual leverage. Another option is UBS Group bull certificate (62176). $UB#HSBC RC2812B.C (62176.HK)$ Recovery price HKD 120, actual leverage 10.5x, providing the highest actual leverage and low premium. When choosing bull certificates, ensure that the recovery price is below the support level of HKD 130.7 to provide sufficient safety buffer. The recovery price for both bull certificates is HKD 120, well below the primary support level, meeting safety principles.

For investors who are bearish on HSBC’s future outlook, believing the stock price will be constrained by the resistance level at HKD 142.1 or even retest the support level, two put warrants can be considered. UBS Group put warrant (23923). $UB-HSBC@EP2609B.P (23923.HK)$ Strike price HKD 111.78, leverage 6.6x. This product has relatively low premium, making it suitable for bearish positioning; BOC put warrant (24062). $BI-HSBC@EP2609A.P (24062.HK)$The exercise price is 111.98 yuan, with a leverage of 6.7 times. This product has the lowest premium, and both implied volatility and leverage are relatively ideal. When choosing put warrants, note that the exercise prices of 111.78 yuan and 111.98 yuan are below the current stock price, making them out-of-the-money products. If the stock price breaks below the support level of 130.7 yuan and further tests 123.7 yuan, the performance of such products will be more prominent.
For bear contracts, consider UBS Group's bear contract (59897).$UB#HSBC RP2702A.P (59897.HK)$The recovery price is 150 yuan, with an actual leverage of 7.8 times, the lowest premium, and relatively high actual leverage; another option is UBS Group's bear contract (62177).$UB#HSBC RP2802A.P (62177.HK)$The recovery price is 150 yuan, with an actual leverage of 7.8 times, also having the lowest premium and relatively high actual leverage. When selecting bear contracts, it’s important to ensure the recovery price is above the resistance level of 142.1 yuan. The recovery prices for both bear contracts mentioned above are 150 yuan, higher than the first resistance level and also higher than the second resistance level of 146.5 yuan, consistent with the 150-yuan resistance level mentioned by Simon, indicating relatively controllable short-term recovery risk.
Overall, HSBC Holdings' stock price is currently in a tug-of-war between bulls and bears. Short-term rebounds have been curbed by resistance at 150 yuan, followed by a pullback, but today there was a significant rebound recovering some losses. Fundamentally, share buybacks and positive institutional ratings provide support, though global banking sector credit risks and short-selling pressures remain. Investors should strictly control risks when deploying strategies, select appropriate derivatives based on key support at 130.7 yuan and resistance at 142.1 yuan, and pay attention to the distance between recovery prices and key levels to balance leverage benefits with a margin of safety.
Interactive Questions:
What do you readers think about how HSBC Holdings (00005) will play out in the short term?
A) Hold steady above the 135-yuan mark, testing upward towards resistance at 142.1 yuan or even 146.5 yuan.
B) Weak rebound, retesting support at 130.7 yuan or even 123.7 yuan.
Feel free to share your thoughts in the comment section!
Reminder: This article does not constitute any investment advice.
This article is for reference only and does not constitute any investment advice. The market data, opinions, and analysis contained herein may change at any time without prior notice. We are not responsible for any loss or damage caused by reliance on the information in this article. Technical analysis only shows whether certain technical conditions are met; a comprehensive assessment of asset performance should combine other data and should not solely rely on this article to make trading decisions. Please note that past performance is not indicative of future results. Follow Jenny's insights on Hong Kong stock warrants for more professional analysis.
#HSBC Holdings #00005 #HongKongStocks #TechnicalAnalysis #SupportAndResistanceLevels #Warrants #BullAndBearCertificates #CallOptions #PutOptions #BankStocks #HongKongWarrantsJenny
Risk Disclaimer: The above content only represents the author's view. It does not represent any position or investment advice of Futu. Futu makes no representation or warranty.Read more


Comments
to post a comment
3
11