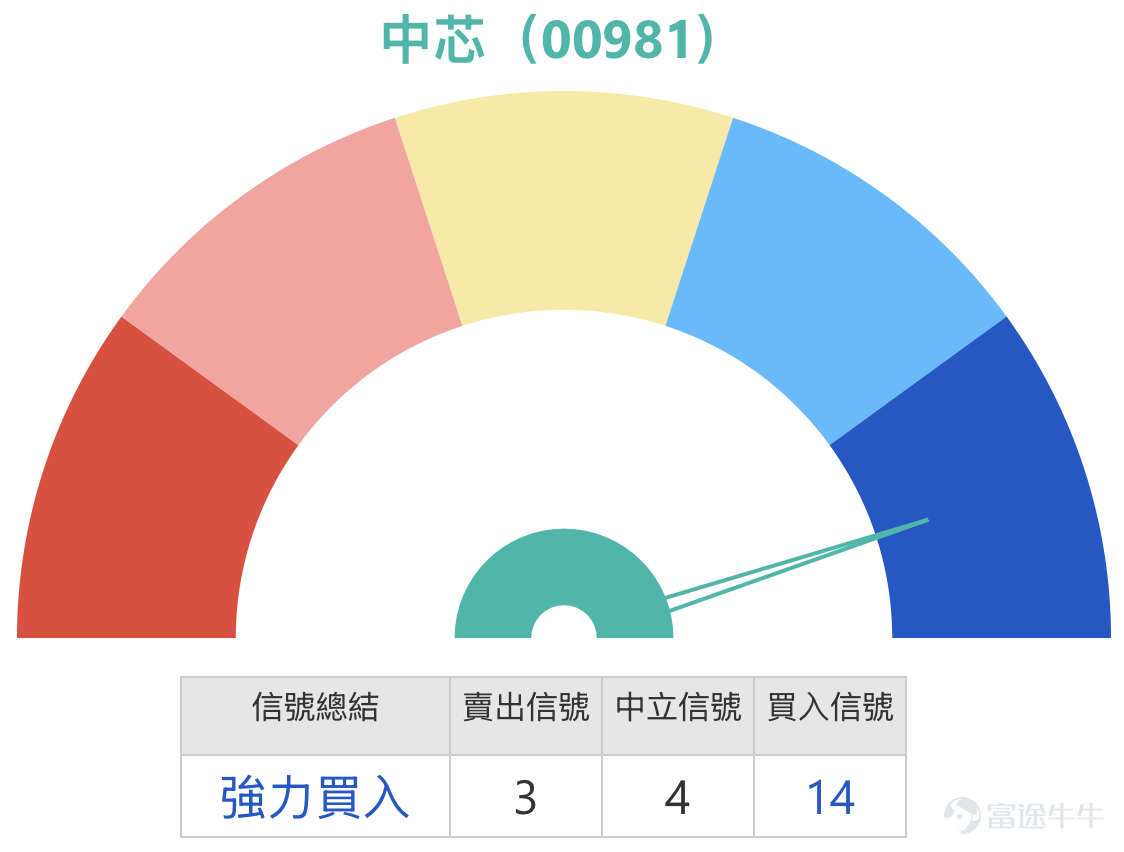

SMIC's technical indicators are showing a "strong buy" signal, with 14 buy signals dominating the short-term trend.
SMIC (00981.HK) has seen its share price remain weak recently, becoming a focal point in the market. As of March 5, 2026, SMIC's stock was trading at HKD 61.5, up slightly by 0.41%. During the session, it hit a low of HKD 61.25 and a high of HKD 63.55. Although there was a slight rebound today, the overall trend shows that the share price has fallen below the lower Bollinger Band on the daily chart, and the weak pattern has yet to reverse. Investors are now most concerned about whether the stock can find support after continuous declines and where the key levels will be moving forward.
From a technical analysis perspective, SMIC’s share price has retreated from a high of HKD 80 and has dropped to around HKD 62 without investors realizing. According to technical data as of March 5, SMIC’s first support level is approximately at HKD 59.4, close to the bottom of the consolidation range in late February; a more critical second support level is at HKD 55.3, equivalent to the low level seen in December 2025. If the stock can successfully hold its current position and rebound upwards, the first resistance level will be around HKD 67.3, near the 10-day moving average (HKD 66.42); if it breaks through successfully, the next resistance will be at HKD 74.6, which corresponds to the top of the heavy trading zone in late January.
![SMIC (00981.HK) has seen its share price remain weak recently, becoming a focal point in the market. As of March 5, 2026, SMIC's stock was trading at HKD 61.5, up slightly by 0.41%. During the session, it hit a low of HKD 61.25 and a high of HKD 63.55. Although there was a slight rebound today, the overall trend shows that the share price has fallen below the lower Bollinger Band on the daily chart, and the weak pattern has yet to reverse. Investors are now most concerned about whether the stock can find support after continuous declines and where the key levels will be moving forward. From a technical analysis perspective, SMIC’s share price has retreated from a high of HKD 80 and has dropped to around HKD 62 without investors realizing. According to technical data as of March 5, SMIC’s first support level is approximately at HKD 59.4, close to the bottom of the consolidation range in late February; a more critical second support level is at HKD 55.3, equivalent to the low level seen in December 2025. If the stock can successfully hold its current position and rebound upwards, the first resistance level will be around HKD 67.3, near the 10-day moving average (HKD 66.42); if it breaks through successfully, the next resistance will be at HKD 74.6, which corresponds to the top of the heavy trading zone in late January. Reviewing the view from [Hong Kong Stock Podcast] on March 4, the program noted that SMIC's stock performance has continued to disappoint. On the daily chart, the share price has retreated from a high of HKD 80 and has dropped to near HKD 60 without investors noticing...](https://nnqimage.futunn.com/sns_client_feed/1162342/20260305/web-1772692349261-DTmmOzXTh0.png/big?area=1&is_public=true&imageMogr2/ignore-error/1/format/webp)
Reviewing the view from [Hong Kong Stock Podcast] on March 4, the program noted that SMIC's stock performance has continued to disappoint. On the daily chart, the share price has retreated from a high of HKD 80 and has dropped to near HKD 60 without investors noticing. On March 4, the intraday low was HKD 60.7, closing at HKD 60.25. While it managed to stay slightly above HKD 60, the closing price has already fallen below the lower Bollinger Band on the daily chart. The program analyzed that SMIC’s first support level is currently around HKD 58.3; if this level fails, the next test will be at HKD 54.3. Investors can observe step by step: if the share price continues to fall, it will likely first test near HKD 58 and then the HKD 54 level. Whether it will drop further to the HKD 50 mark remains too early to determine, and further observation is needed on whether HKD 58.3 and HKD 54.3 provide effective support before making further analysis. This view aligns closely with the aforementioned technical analysis support levels of HKD 59.4 and HKD 55.3, offering important reference for investors.
In reviewing warrant products, multiple SMIC-related derivatives mentioned on March 2, 2026, recorded significant performances over the following two trading days (up to March 4). During this period, SMIC's underlying stock fell by 5.19%, while related bearish products saw considerable gains: Societe Generale bear certificate (58384) rose by 36%, and UBS Group bear certificate (58818) performed the best, recording a 42% gain; HSBC put warrant (21473) and Bank of China put warrant (21097) both rose by 25%.
![SMIC (00981.HK) has seen its share price remain weak recently, becoming a focal point in the market. As of March 5, 2026, SMIC's stock was trading at HKD 61.5, up slightly by 0.41%. During the session, it hit a low of HKD 61.25 and a high of HKD 63.55. Although there was a slight rebound today, the overall trend shows that the share price has fallen below the lower Bollinger Band on the daily chart, and the weak pattern has yet to reverse. Investors are now most concerned about whether the stock can find support after continuous declines and where the key levels will be moving forward. From a technical analysis perspective, SMIC’s share price has retreated from a high of HKD 80 and has dropped to around HKD 62 without investors realizing. According to technical data as of March 5, SMIC’s first support level is approximately at HKD 59.4, close to the bottom of the consolidation range in late February; a more critical second support level is at HKD 55.3, equivalent to the low level seen in December 2025. If the stock can successfully hold its current position and rebound upwards, the first resistance level will be around HKD 67.3, near the 10-day moving average (HKD 66.42); if it breaks through successfully, the next resistance will be at HKD 74.6, which corresponds to the top of the heavy trading zone in late January. Reviewing the view from [Hong Kong Stock Podcast] on March 4, the program noted that SMIC's stock performance has continued to disappoint. On the daily chart, the share price has retreated from a high of HKD 80 and has dropped to near HKD 60 without investors noticing...](https://nnqimage.futunn.com/sns_client_feed/1162342/20260305/web-1772692341825-EwbBJmrPQK.png/big?area=1&is_public=true&imageMogr2/ignore-error/1/format/webp)
With SMIC's current share price at HKD 62.1, combined with the aforementioned support level of HKD 59.4 and resistance level of HKD 67.3, investors can choose appropriate warrant and bull/bear certificate products based on their outlook. For investors optimistic about SMIC holding steady at HKD 62 and rebounding upwards, they may consider two call warrants: Bank of China call warrant (19343). $BI-SMIC@EC2609B.C (19343.HK)$ Strike price at 69.04 yuan, offering approximately 3.8x leverage. The key feature of this product is its highest leverage and lower premium, making it suitable for cost-effective bullish strategies. Another option is UBS Group call warrant (19350). $UB-SMIC@EC2609A.C (19350.HK)$ Strike price at 69.04 yuan, with leverage around 4x. This warrant has relatively low implied volatility, effectively reducing volatility risk, providing investors bullish on the underlying stock with a high-leverage tool that exhibits relatively stable fluctuations.
For bull contracts, consider UBS Group bull contract (68583). $UB#SMIC RC2608K.C (68583.HK)$ Recovery price at 57 yuan, actual leverage at 8.9x, with relatively lower premium. Another option is DBS bull contract (53392). $DS#SMIC RC2607C.C (53392.HK)$ Recovery price at 56 yuan, actual leverage at 7.5x, with the highest actual leverage and lowest premium. When selecting bull contracts, ensure the recovery price is below the support level of 59.4 yuan to provide sufficient safety buffer. The recovery prices of the two aforementioned bull contracts are 57 yuan and 56 yuan respectively, both below the primary support level, meeting safety criteria.
![SMIC (00981.HK) has seen its share price remain weak recently, becoming a focal point in the market. As of March 5, 2026, SMIC's stock was trading at HKD 61.5, up slightly by 0.41%. During the session, it hit a low of HKD 61.25 and a high of HKD 63.55. Although there was a slight rebound today, the overall trend shows that the share price has fallen below the lower Bollinger Band on the daily chart, and the weak pattern has yet to reverse. Investors are now most concerned about whether the stock can find support after continuous declines and where the key levels will be moving forward. From a technical analysis perspective, SMIC’s share price has retreated from a high of HKD 80 and has dropped to around HKD 62 without investors realizing. According to technical data as of March 5, SMIC’s first support level is approximately at HKD 59.4, close to the bottom of the consolidation range in late February; a more critical second support level is at HKD 55.3, equivalent to the low level seen in December 2025. If the stock can successfully hold its current position and rebound upwards, the first resistance level will be around HKD 67.3, near the 10-day moving average (HKD 66.42); if it breaks through successfully, the next resistance will be at HKD 74.6, which corresponds to the top of the heavy trading zone in late January. Reviewing the view from [Hong Kong Stock Podcast] on March 4, the program noted that SMIC's stock performance has continued to disappoint. On the daily chart, the share price has retreated from a high of HKD 80 and has dropped to near HKD 60 without investors noticing...](https://nnqimage.futunn.com/sns_client_feed/1162342/20260305/web-1772692364016-XtcjKGj048.png/big?area=1&is_public=true&imageMogr2/ignore-error/1/format/webp)
For investors bearish on SMIC's outlook, believing the stock price will face resistance at 67.3 yuan or even retest support levels, you may consider two put warrants: HSBC put warrant (21090) with a strike price at 62.81 yuan and 4.4x leverage. This product features the lowest implied volatility and high leverage, making it suitable for bearish strategies; Bank of China put warrant (21281). $BI-SMIC@EP2606A.P (21281.HK)$ Strike price at 62.76 yuan, with 4.5x leverage. This product has the lowest premium, and its implied volatility and leverage are both relatively ideal. For bear contracts, consider UBS Group bear contract (58818), with recovery price at 72.8 yuan, actual leverage at 6.7x, the highest actual leverage, and relatively lower premium; Societe Generale bear contract (58384). $SG#SMIC RP2812V.P (58384.HK)$ Recovery price at 73 yuan, actual leverage at 6.7x, with the highest actual leverage and lowest premium. When selecting bear contracts, ensure the recovery price is above the resistance level of 67.3 yuan. The recovery prices of the two aforementioned bear contracts are 72.8 yuan and 73 yuan respectively, both far above the first resistance level, as well as the second resistance level of 74.6 yuan, meaning short-term recovery risk is relatively controllable.
Interactive Questions:
Dear readers, how do you think SMIC (00981) will perform in the short term?
A) Consolidation above the support level of 59.4 yuan, followed by an upward test of the resistance level at 67.3 yuan.
B) The rebound lacks momentum, further testing of the support level at HK$55.3 or even lower is expected.
Feel free to share your thoughts in the comment section!
#SMIC #00981 #HKStocks #TechnicalAnalysis #SupportAndResistance #Derivatives #BullBearCertificates #CallWarrants #PutWarrants #Semiconductors #HKStocksDerivativesJenny
Reminder: This article does not constitute any investment advice.
This article is for reference only and does not constitute any investment advice. The market data, opinions, and analysis contained herein may change at any time without prior notice. We are not responsible for any loss or damage caused by reliance on the information in this article. Technical analysis only shows whether certain technical conditions are met; a comprehensive assessment of asset performance should combine other data and should not solely rely on this article to make trading decisions. Please note that past performance is not indicative of future results. Follow Jenny's insights on Hong Kong stock warrants for more professional analysis.
Risk Disclaimer: The above content only represents the author's view. It does not represent any position or investment advice of Futu. Futu makes no representation or warranty.Read more

Comments
to post a comment
4
12