
AIA surges over 4% in a single day, has the short-term bottom been established?
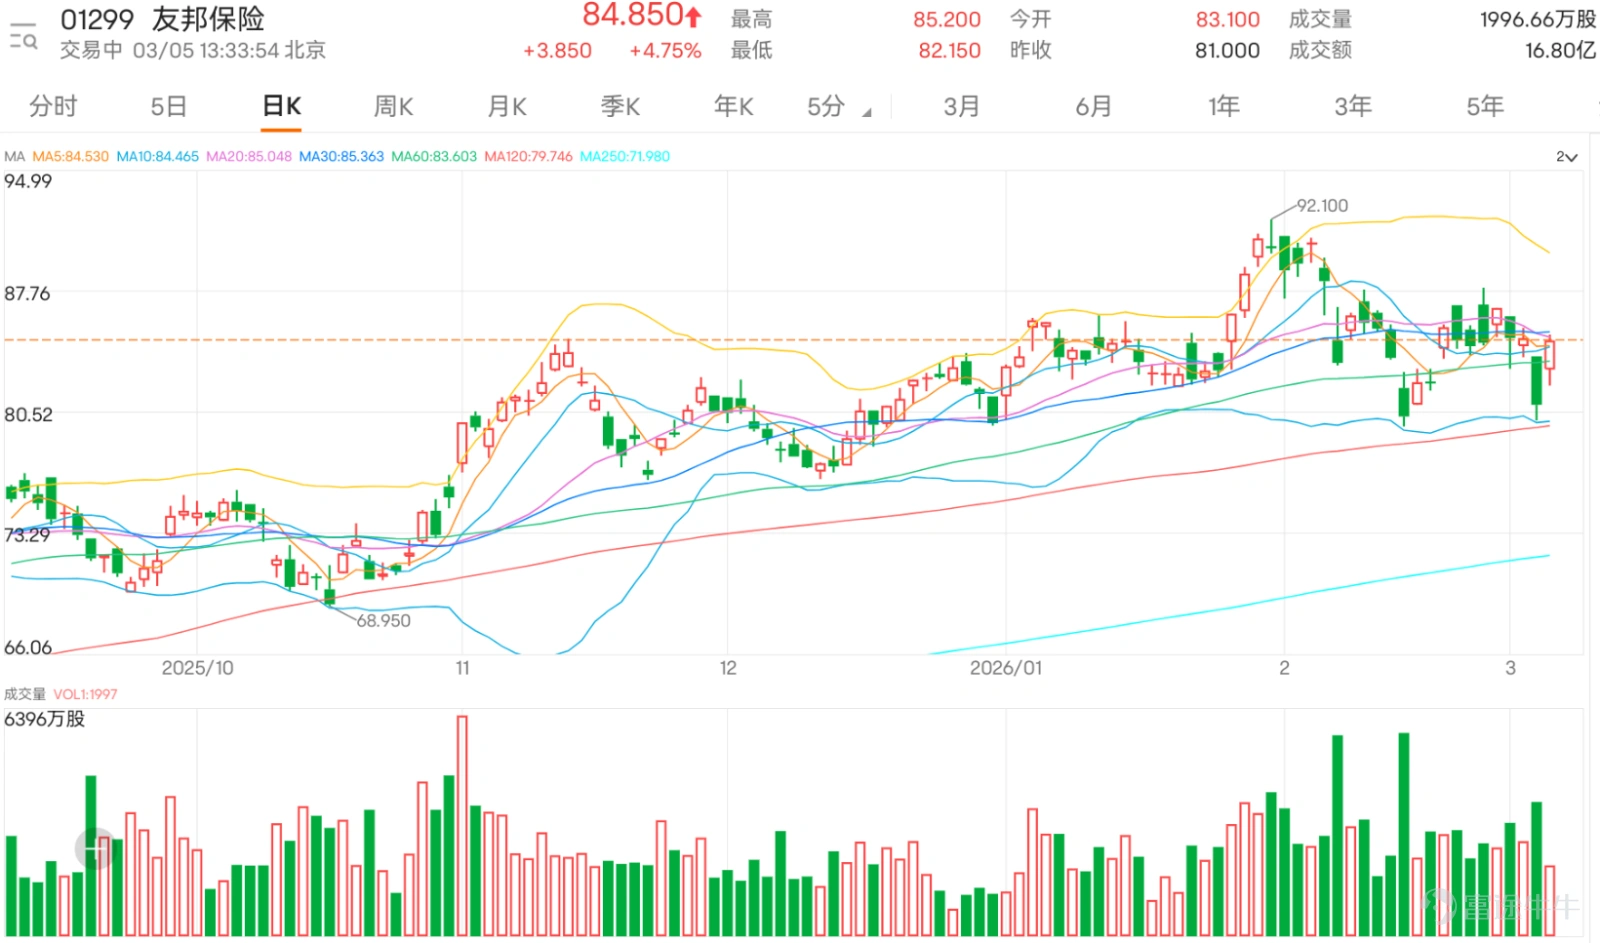
After a period of range consolidation, $AIA (01299.HK)$ The stock price surged over 4% today, closing at 84.85 yuan. In terms of moving averages, the current price is just above the 10-day moving average (84.43 yuan), slightly breaking through its resistance. Meanwhile, it remains below the 30-day moving average (85.35 yuan) with short-term pressure from it, while firmly standing above the 60-day moving average (83.60 yuan). Overall, the short-term trend shows characteristics of rebounding after a consolidation phase.
Technical Indicator Signal Interpretation
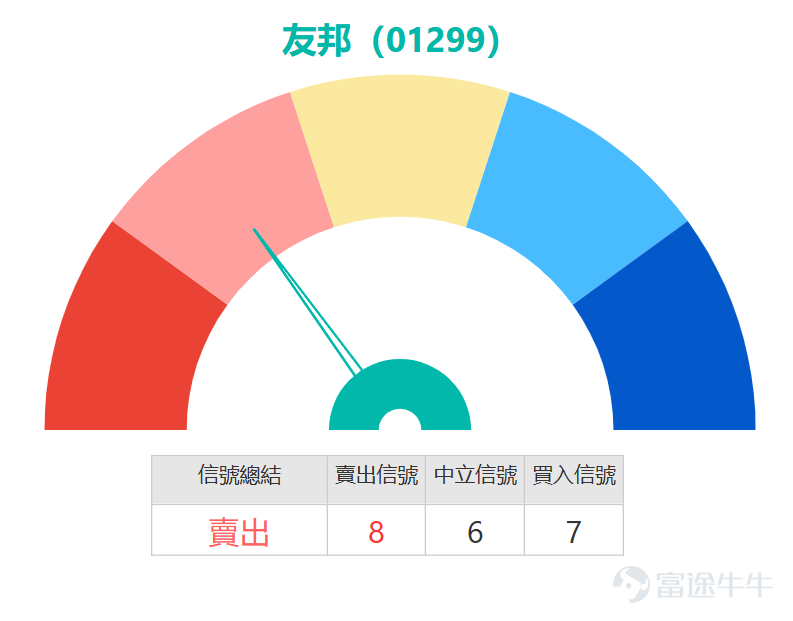
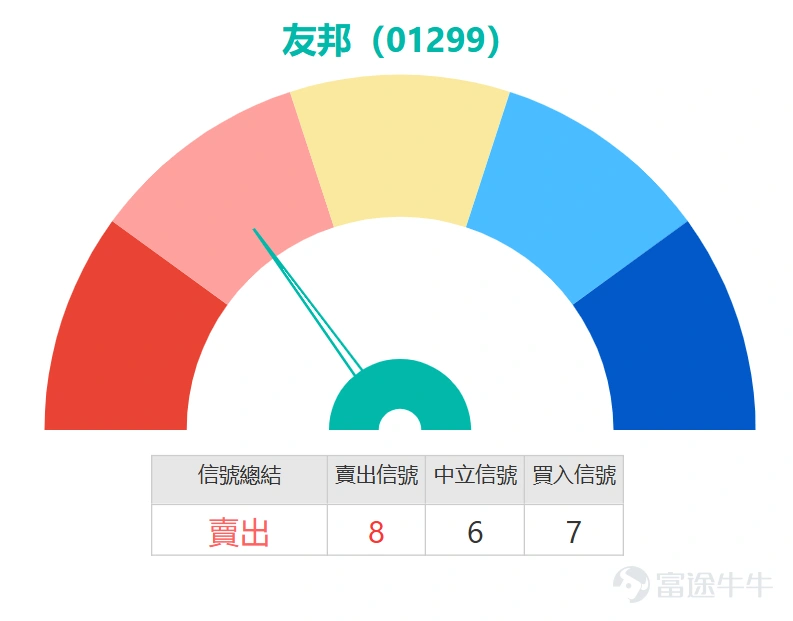
Based on a comprehensive analysis of multiple technical indicators, different indicators show divergent characteristics: the Stochastic Oscillator is currently giving a clear buy signal, while the VR Volume Ratio and Momentum Oscillation indicators also indicate buying opportunities. The Williams %R indicator shows an oversold condition, suggesting that a short-term bottom may be forming. Meanwhile, the RSI indicator stands at 46, within the neutral range, and the CCI, ADX, Psychological Line, and Rate of Change indicators all remain neutral, reflecting that the current market's bullish and bearish forces are relatively balanced. However, MACD, Bollinger Bands, Ichimoku Cloud, and Bull-Bear Power indicators are signaling sell, with an overall technical summary indicating a sell signal. The signal strength is 8, implying that the short to medium-term downtrend still has some momentum.
Support and Resistance Level Analysis
The first support level for AIA is currently at HKD 81.3, which is an important short-term battleground between bulls and bears. If the stock price retraces to this level and finds support, the short-term rebound logic would still hold. The second support level is at HKD 78, representing a strong support point; if this level is broken, the likelihood of a weakening short-term trend significantly increases. On the resistance side, the first resistance level is at HKD 87.7, the initial target for a recent rebound. A decisive breakout above this level would open up further upside potential. The second resistance level is at HKD 91, an important medium-term pressure point where significant selling pressure is expected to emerge. The probability of an upward move from the current share price is 0.5, meaning the balance between bulls and bears requires further confirmation through additional signals.
Operational Signals and Summary
Overall, AIA’s short-term signals are mixed, with a general technical summary pointing towards a sell signal. However, some oscillation indicators have already started showing buy signals and suggest an oversold bottoming-out pattern, making it suitable for professional investors of varying styles to consider. Aggressive investors may attempt a small position when the stock price tests but holds above the first support level of HKD 81.3, targeting the first resistance level at HKD 87.7, with a stop-loss below HKD 81.3. Conservative investors are advised to stay on the sidelines for now, waiting for the stock price to break above the 30-day moving average at HKD 85.35 or until clearer trend signals appear before taking action. Should the stock fall below the second support level at HKD 78, caution is recommended.
Product Review
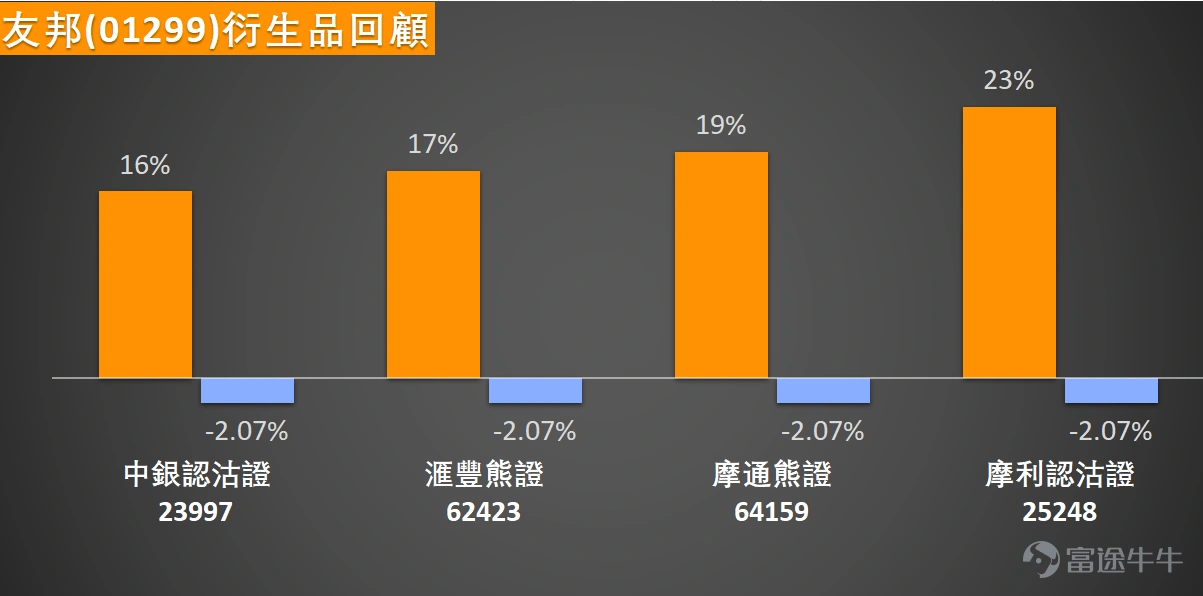
On February 27, 2026, regarding the mentioned AIA (01299) related derivative warrants and bear certificates, in the following two trading days, the underlying AIA stock price fell by 2.07%, $HS#AIA RP2812B.P (62423.HK)$ then rose by 17% two days later. $MS-AIA @EP2606A.P (25248.HK)$ showed even more impressive performance, with gains reaching 23% over the same period. Another product $JP#AIA RP2810A.P (64159.HK)$ also rose by 19%, while $BI-AIA @EP2607B.P (23997.HK)$ with a 16% increase recorded.
Product Highlights
For investors who are bullish on AIA shares, they can consider $BI#AIA RC2612A.C (65957.HK)$ , which has a leverage of 11.6 times and a strike price of 79.1. Its feature is relatively low premium, effectively reducing the entry cost. Another option is $UB#AIA RC2706A.C (69178.HK)$ , with a leverage of 8.8 times and a strike price of 76. It offers the lowest premium and higher actual leverage, providing stronger bullish momentum. For investors who are bearish on the market, $UB#AIA RP2812A.P (64884.HK)$ has a leverage of 8.5 times, a strike price of 95, the highest actual leverage, and the lowest premium, making it suitable for capturing opportunities in share price declines. $SG#AIA RP2812E.P (64263.HK)$ also features 8.5 times leverage, a strike price of 95, the highest actual leverage, and a relatively low premium, making it another high-quality choice for bearish strategies.
For call warrants, $BI-AIA @EC2612A.C (22387.HK)$ has an exercise price of 91.66 and a leverage of 4.8 times, offering the highest leverage and relatively low premium, making it ideal for investors expecting share price increases and seeking higher returns. $UB-AIA @EC2612A.C (22905.HK)$ has an exercise price of 91.71 and a leverage of 5.2 times, with relatively low implied volatility, helping to reduce costs caused by fluctuations. In the put warrant section, $BI-AIA @EP2612A.P (22385.HK)$ has an exercise price of 77.88 and a leverage of 4.1 times, featuring the highest leverage and low implied volatility, making it suitable for bearish operations while managing risk. $UB-AIA @EP2612A.P (24372.HK)$ has an exercise price of 77.83 and a leverage of 4.2 times, with both leverage and implied volatility being fairly ideal, offering a balanced risk-reward profile.

Whether the current buy signal issued by AIA's volatility indicator will be offset by the压制effect of the 30-day moving average, and what is the likelihood of a short-term breakout above the resistance level at $87.7? Feel free to share your insights.
This article is for reference only and does not constitute any investment advice. The market data, opinions, and analysis contained herein may change at any time without prior notice. We assume no responsibility for any loss or damage resulting from reliance on the information in this article. Technical analysis only indicates whether certain technical conditions are met; a comprehensive assessment of asset performance should combine other data, and trading decisions should not be made solely based on this article. Please note that past performance is not indicative of future results. Be sure to follow 'Hong Kong Warrants Jenny' for more professional analysis articles on investment opportunities in Hong Kong stock derivatives!
#HongKongStocks #HangSengIndex #RealTimeAnalysis #WarrantsSelection #WarrantsStrategy #DerivativesHedging #HongKongWarrantsJenny #InsuranceSector #AIA #01299$Hang Seng Index (800000.HK)$$Insurance (LIST1003.HK)$
Risk Disclaimer: The above content only represents the author's view. It does not represent any position or investment advice of Futu. Futu makes no representation or warranty.Read more

Comments
to post a comment
1