
English
Back
Open Account
米股研究
wrote a post · Mar 5 11:41

Technical analysis of the seven major US tech stocks (March 5): MAGS/NVIDIA/Microsoft/Apple/Amazon/Google/META/Tesla

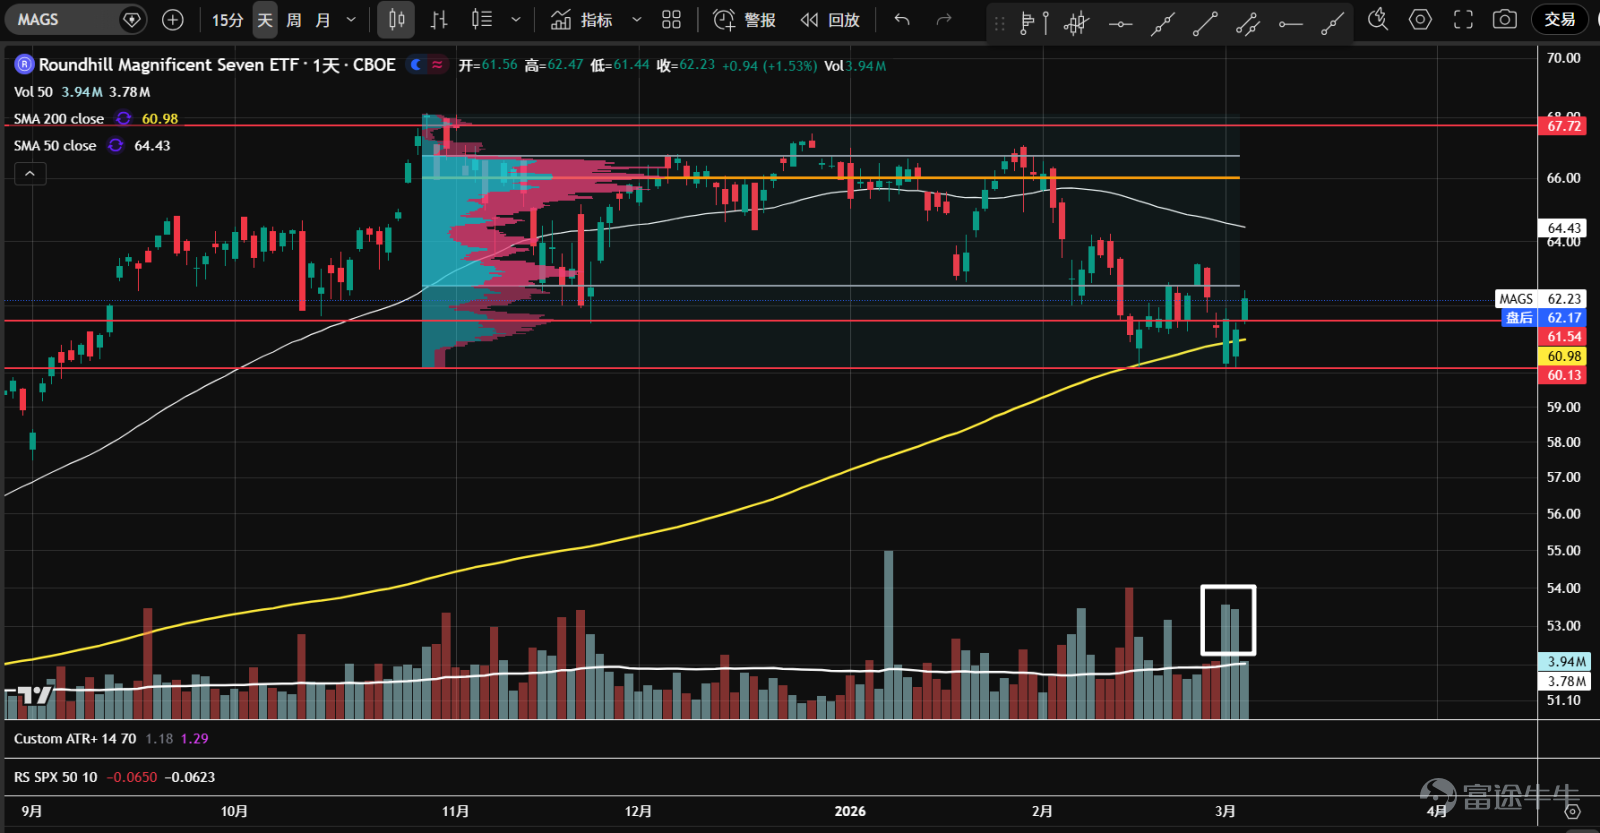
1. The ETF for the seven major tech stocks ( $Roundhill Magnificent Seven ETF (MAGS.US)$ It began to consolidate sideways in October last year, and started falling from its peak at the end of January. The overall trading volume expanded, showing a bearish price-volume cycle with clear signs of distribution. Recently, it stabilized at the $60 support level and near the annual moving average line, closing with a high K-line. However, the trading volume remains too large, indicating significant disagreement between buyers and sellers. Pay attention to whether there will be another contraction test.
1. The ETF for the seven major tech stocks ( $Roundhill Magnificent Seven ETF (MAGS.US)$ It began to consolidate sideways in October last year, and started falling from its peak at the end of January. The overall trading volume expanded, showing a bearish price-volume cycle with clear signs of distribution. Recently, it stabilized at the $60 support level and near the annual moving average line, closing with a high K-line. However, the trading volume remains too large, indicating significant disagreement between buyers and sellers. Pay attention to whether there will be another contraction test.  2、 $NVIDIA (NVDA.US)$ It has been continuously moving within a large consolidation range, repeatedly attempting to break through the upper resistance at 194.5 but failing each time. Following the release of the latest earnings report, it experienced heavy selling pressure at the upper resistance level, while the subsequent rebound lacked momentum due to shrinking volume. Generally, during the later stages of consolidation, if trading volumes are high during pullbacks but lower during rebounds, with wider price fluctuations, this is an important sign of distribution. The current direction remains unclear, and guidance from the GTC conference should be awaited.  3、 $Microsoft (MSFT.US)$ At the beginning of February this year, panic selling occurred near the previous gap area, followed by a brief rebound before reversing downward again. Although new lows were hit, trading volumes had already started contracting, and a swift rebound followed, confirming the effectiveness of the 393 support level. This was a successful second test. The control point for trading volumes shifted downwards, forming a type-b distribution. A short-term sideways consolidation may occur; watch for potential entry opportunities.  4、 $Apple (AAPL.US)$...
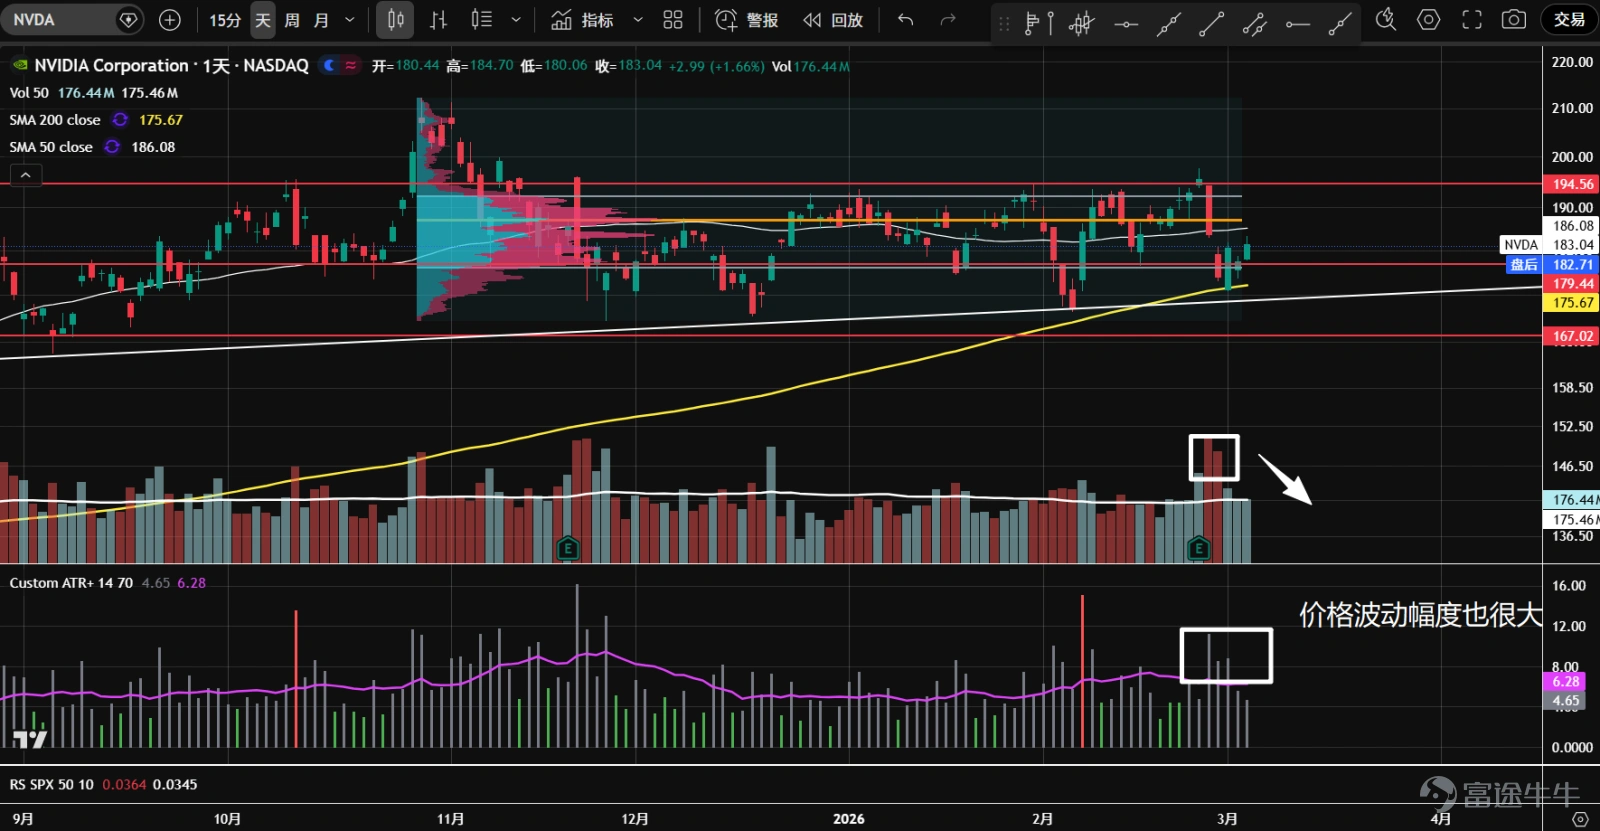
2、 $NVIDIA (NVDA.US)$ It has been continuously moving within a large consolidation range, repeatedly attempting to break through the upper resistance at 194.5 but failing each time. Following the release of the latest earnings report, it experienced heavy selling pressure at the upper resistance level, while the subsequent rebound lacked momentum due to shrinking volume. Generally, during the later stages of consolidation, if trading volumes are high during pullbacks but lower during rebounds, with wider price fluctuations, this is an important sign of distribution. The current direction remains unclear, and guidance from the GTC conference should be awaited.
1. The ETF for the seven major tech stocks ( $Roundhill Magnificent Seven ETF (MAGS.US)$ It began to consolidate sideways in October last year, and started falling from its peak at the end of January. The overall trading volume expanded, showing a bearish price-volume cycle with clear signs of distribution. Recently, it stabilized at the $60 support level and near the annual moving average line, closing with a high K-line. However, the trading volume remains too large, indicating significant disagreement between buyers and sellers. Pay attention to whether there will be another contraction test.  2、 $NVIDIA (NVDA.US)$ It has been continuously moving within a large consolidation range, repeatedly attempting to break through the upper resistance at 194.5 but failing each time. Following the release of the latest earnings report, it experienced heavy selling pressure at the upper resistance level, while the subsequent rebound lacked momentum due to shrinking volume. Generally, during the later stages of consolidation, if trading volumes are high during pullbacks but lower during rebounds, with wider price fluctuations, this is an important sign of distribution. The current direction remains unclear, and guidance from the GTC conference should be awaited.  3、 $Microsoft (MSFT.US)$ At the beginning of February this year, panic selling occurred near the previous gap area, followed by a brief rebound before reversing downward again. Although new lows were hit, trading volumes had already started contracting, and a swift rebound followed, confirming the effectiveness of the 393 support level. This was a successful second test. The control point for trading volumes shifted downwards, forming a type-b distribution. A short-term sideways consolidation may occur; watch for potential entry opportunities.  4、 $Apple (AAPL.US)$...
3、 $Microsoft (MSFT.US)$ At the beginning of February this year, panic selling occurred near the previous gap area, followed by a brief rebound before reversing downward again. Although new lows were hit, trading volumes had already started contracting, and a swift rebound followed, confirming the effectiveness of the 393 support level. This was a successful second test. The control point for trading volumes shifted downwards, forming a type-b distribution. A short-term sideways consolidation may occur; watch for potential entry opportunities.
1. The ETF for the seven major tech stocks ( $Roundhill Magnificent Seven ETF (MAGS.US)$ It began to consolidate sideways in October last year, and started falling from its peak at the end of January. The overall trading volume expanded, showing a bearish price-volume cycle with clear signs of distribution. Recently, it stabilized at the $60 support level and near the annual moving average line, closing with a high K-line. However, the trading volume remains too large, indicating significant disagreement between buyers and sellers. Pay attention to whether there will be another contraction test.  2、 $NVIDIA (NVDA.US)$ It has been continuously moving within a large consolidation range, repeatedly attempting to break through the upper resistance at 194.5 but failing each time. Following the release of the latest earnings report, it experienced heavy selling pressure at the upper resistance level, while the subsequent rebound lacked momentum due to shrinking volume. Generally, during the later stages of consolidation, if trading volumes are high during pullbacks but lower during rebounds, with wider price fluctuations, this is an important sign of distribution. The current direction remains unclear, and guidance from the GTC conference should be awaited.  3、 $Microsoft (MSFT.US)$ At the beginning of February this year, panic selling occurred near the previous gap area, followed by a brief rebound before reversing downward again. Although new lows were hit, trading volumes had already started contracting, and a swift rebound followed, confirming the effectiveness of the 393 support level. This was a successful second test. The control point for trading volumes shifted downwards, forming a type-b distribution. A short-term sideways consolidation may occur; watch for potential entry opportunities.  4、 $Apple (AAPL.US)$...
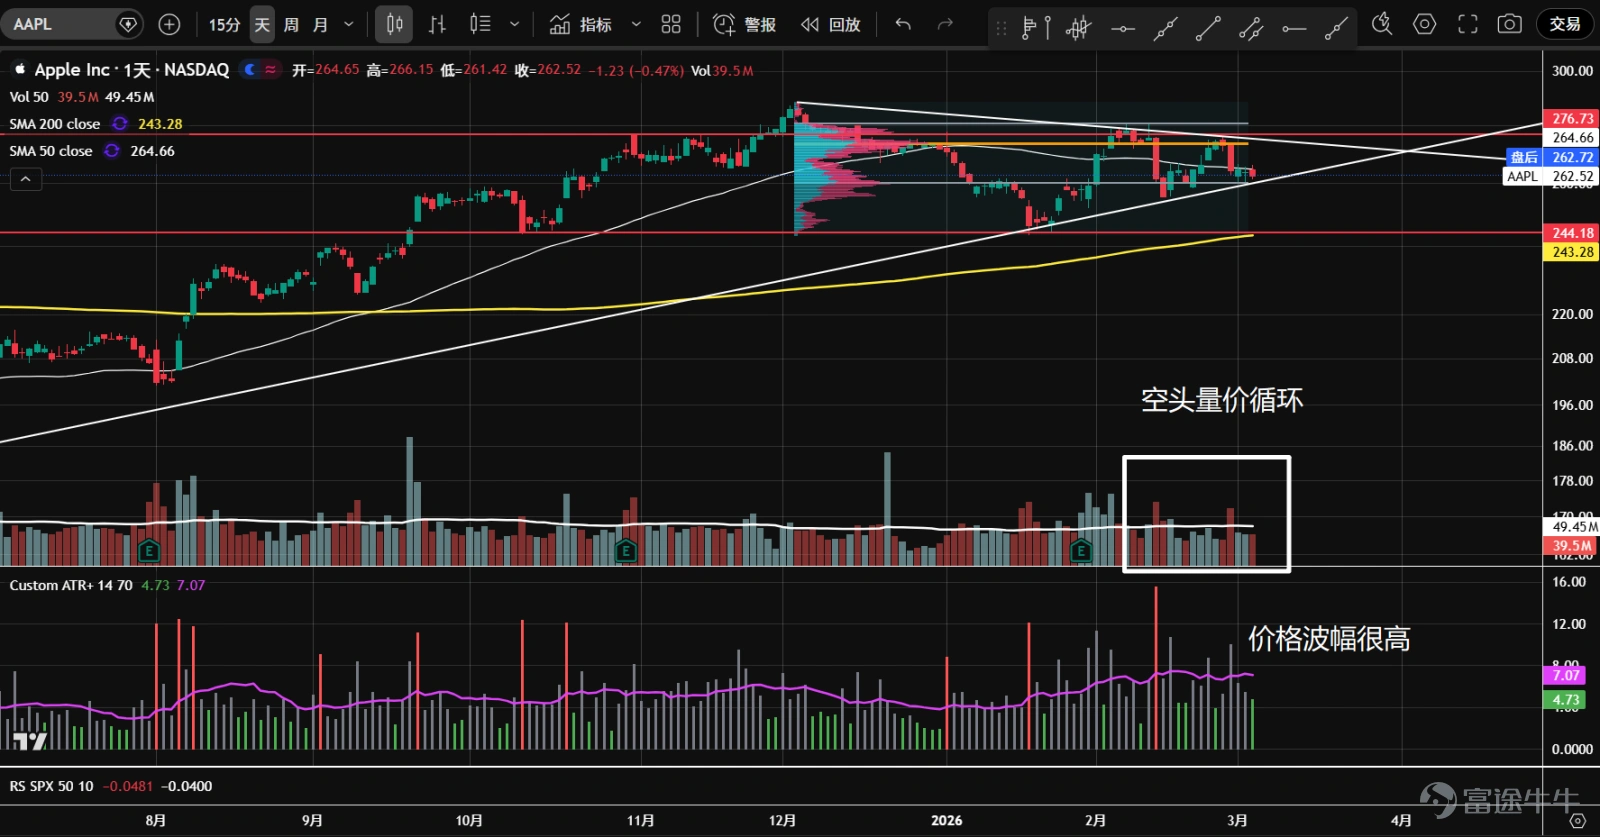
4、 $Apple (AAPL.US)$ The adjustment began in December last year and it is currently forming a converging triangle pattern. On February 27, heavy trading volume pushed prices toward the rising trendline, but the rebound was weak. In the bearish price-volume cycle, price volatility has been high, with many trapped positions above. It is recommended to stay on the sidelines for now.
1. The ETF for the seven major tech stocks ( $Roundhill Magnificent Seven ETF (MAGS.US)$ It began to consolidate sideways in October last year, and started falling from its peak at the end of January. The overall trading volume expanded, showing a bearish price-volume cycle with clear signs of distribution. Recently, it stabilized at the $60 support level and near the annual moving average line, closing with a high K-line. However, the trading volume remains too large, indicating significant disagreement between buyers and sellers. Pay attention to whether there will be another contraction test.  2、 $NVIDIA (NVDA.US)$ It has been continuously moving within a large consolidation range, repeatedly attempting to break through the upper resistance at 194.5 but failing each time. Following the release of the latest earnings report, it experienced heavy selling pressure at the upper resistance level, while the subsequent rebound lacked momentum due to shrinking volume. Generally, during the later stages of consolidation, if trading volumes are high during pullbacks but lower during rebounds, with wider price fluctuations, this is an important sign of distribution. The current direction remains unclear, and guidance from the GTC conference should be awaited.  3、 $Microsoft (MSFT.US)$ At the beginning of February this year, panic selling occurred near the previous gap area, followed by a brief rebound before reversing downward again. Although new lows were hit, trading volumes had already started contracting, and a swift rebound followed, confirming the effectiveness of the 393 support level. This was a successful second test. The control point for trading volumes shifted downwards, forming a type-b distribution. A short-term sideways consolidation may occur; watch for potential entry opportunities.  4、 $Apple (AAPL.US)$...
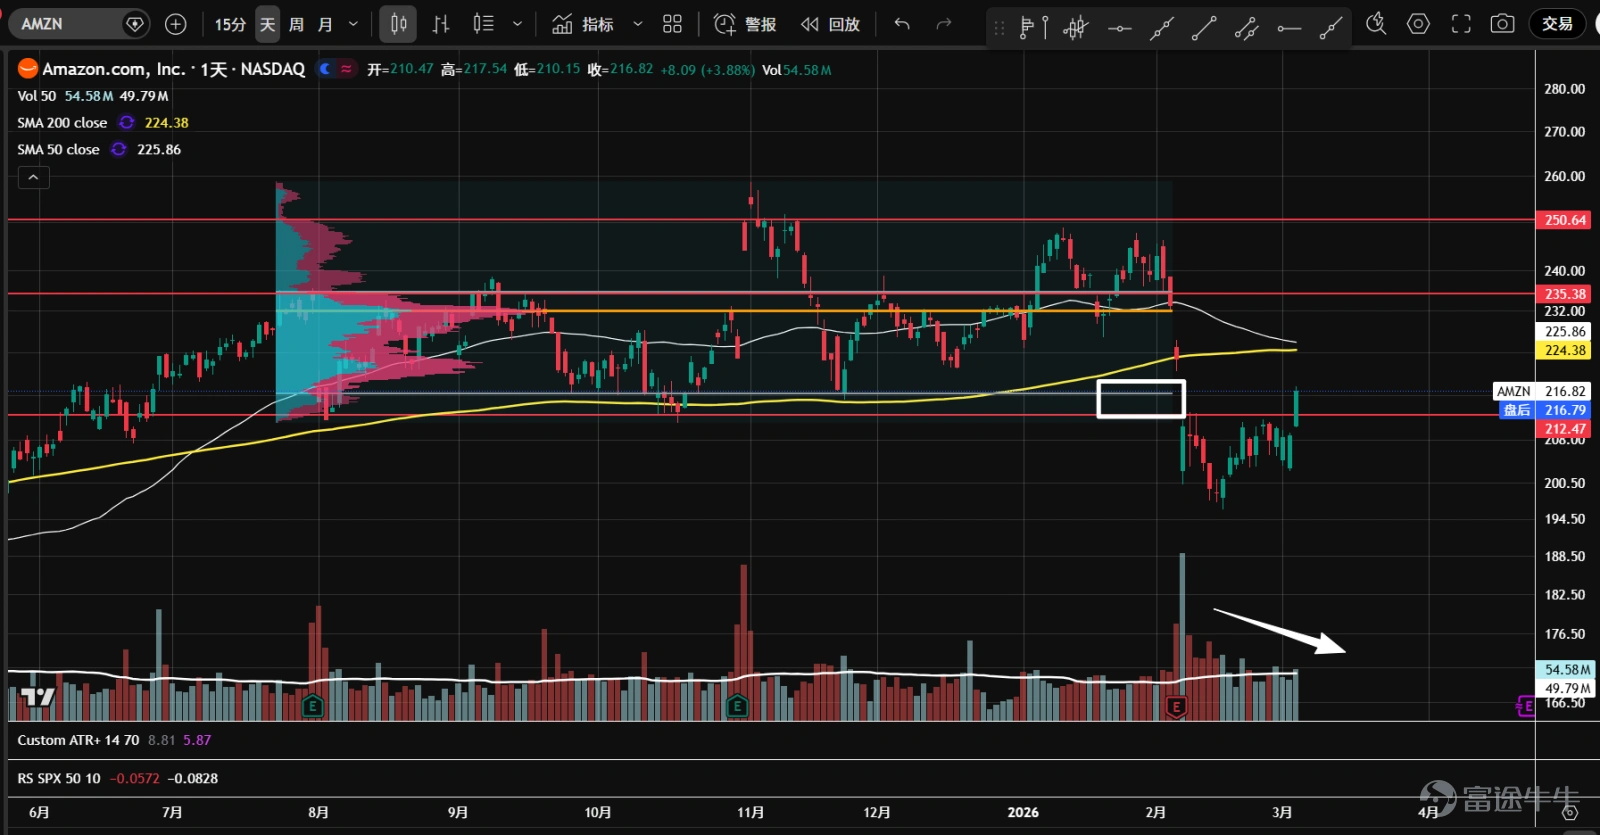
5、 $Amazon (AMZN.US)$ After the earnings report released at the beginning of February, heavy trading volume broke below the consolidation range formed since August last year, and it is currently experiencing a shrinking-volume rebound. The latest price broke through the ice line (red) at the bottom of the range and reached the lower boundary of the value zone (gray). Watch for potential resistance in this area.
1. The ETF for the seven major tech stocks ( $Roundhill Magnificent Seven ETF (MAGS.US)$ It began to consolidate sideways in October last year, and started falling from its peak at the end of January. The overall trading volume expanded, showing a bearish price-volume cycle with clear signs of distribution. Recently, it stabilized at the $60 support level and near the annual moving average line, closing with a high K-line. However, the trading volume remains too large, indicating significant disagreement between buyers and sellers. Pay attention to whether there will be another contraction test.  2、 $NVIDIA (NVDA.US)$ It has been continuously moving within a large consolidation range, repeatedly attempting to break through the upper resistance at 194.5 but failing each time. Following the release of the latest earnings report, it experienced heavy selling pressure at the upper resistance level, while the subsequent rebound lacked momentum due to shrinking volume. Generally, during the later stages of consolidation, if trading volumes are high during pullbacks but lower during rebounds, with wider price fluctuations, this is an important sign of distribution. The current direction remains unclear, and guidance from the GTC conference should be awaited.  3、 $Microsoft (MSFT.US)$ At the beginning of February this year, panic selling occurred near the previous gap area, followed by a brief rebound before reversing downward again. Although new lows were hit, trading volumes had already started contracting, and a swift rebound followed, confirming the effectiveness of the 393 support level. This was a successful second test. The control point for trading volumes shifted downwards, forming a type-b distribution. A short-term sideways consolidation may occur; watch for potential entry opportunities.  4、 $Apple (AAPL.US)$...
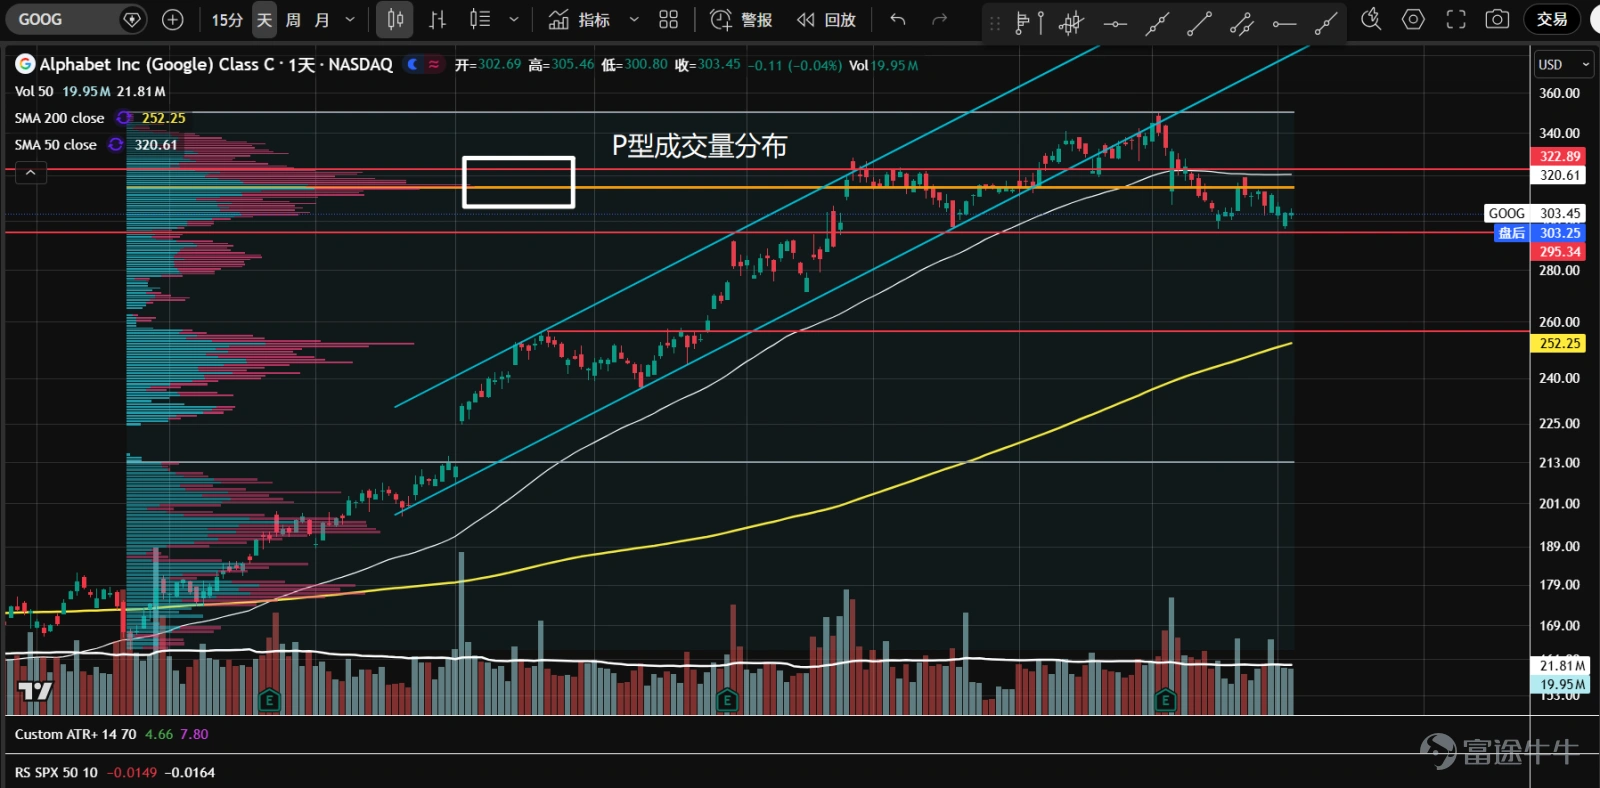
6、 $Alphabet-C (GOOG.US)$ After breaking below the upward channel line in early February, a pullback began and support was found around the 295 level. Volume has formed a P-shaped distribution, confirming that the stock has likely entered a consolidation phase. In the first half of February, share prices experienced heavy selling pressure, with bearish price-volume cycles, though bulls showed some strength with higher volume on positive days. The rebound has been limited, so temporary observation is advised.
1. The ETF for the seven major tech stocks ( $Roundhill Magnificent Seven ETF (MAGS.US)$ It began to consolidate sideways in October last year, and started falling from its peak at the end of January. The overall trading volume expanded, showing a bearish price-volume cycle with clear signs of distribution. Recently, it stabilized at the $60 support level and near the annual moving average line, closing with a high K-line. However, the trading volume remains too large, indicating significant disagreement between buyers and sellers. Pay attention to whether there will be another contraction test.  2、 $NVIDIA (NVDA.US)$ It has been continuously moving within a large consolidation range, repeatedly attempting to break through the upper resistance at 194.5 but failing each time. Following the release of the latest earnings report, it experienced heavy selling pressure at the upper resistance level, while the subsequent rebound lacked momentum due to shrinking volume. Generally, during the later stages of consolidation, if trading volumes are high during pullbacks but lower during rebounds, with wider price fluctuations, this is an important sign of distribution. The current direction remains unclear, and guidance from the GTC conference should be awaited.  3、 $Microsoft (MSFT.US)$ At the beginning of February this year, panic selling occurred near the previous gap area, followed by a brief rebound before reversing downward again. Although new lows were hit, trading volumes had already started contracting, and a swift rebound followed, confirming the effectiveness of the 393 support level. This was a successful second test. The control point for trading volumes shifted downwards, forming a type-b distribution. A short-term sideways consolidation may occur; watch for potential entry opportunities.  4、 $Apple (AAPL.US)$...
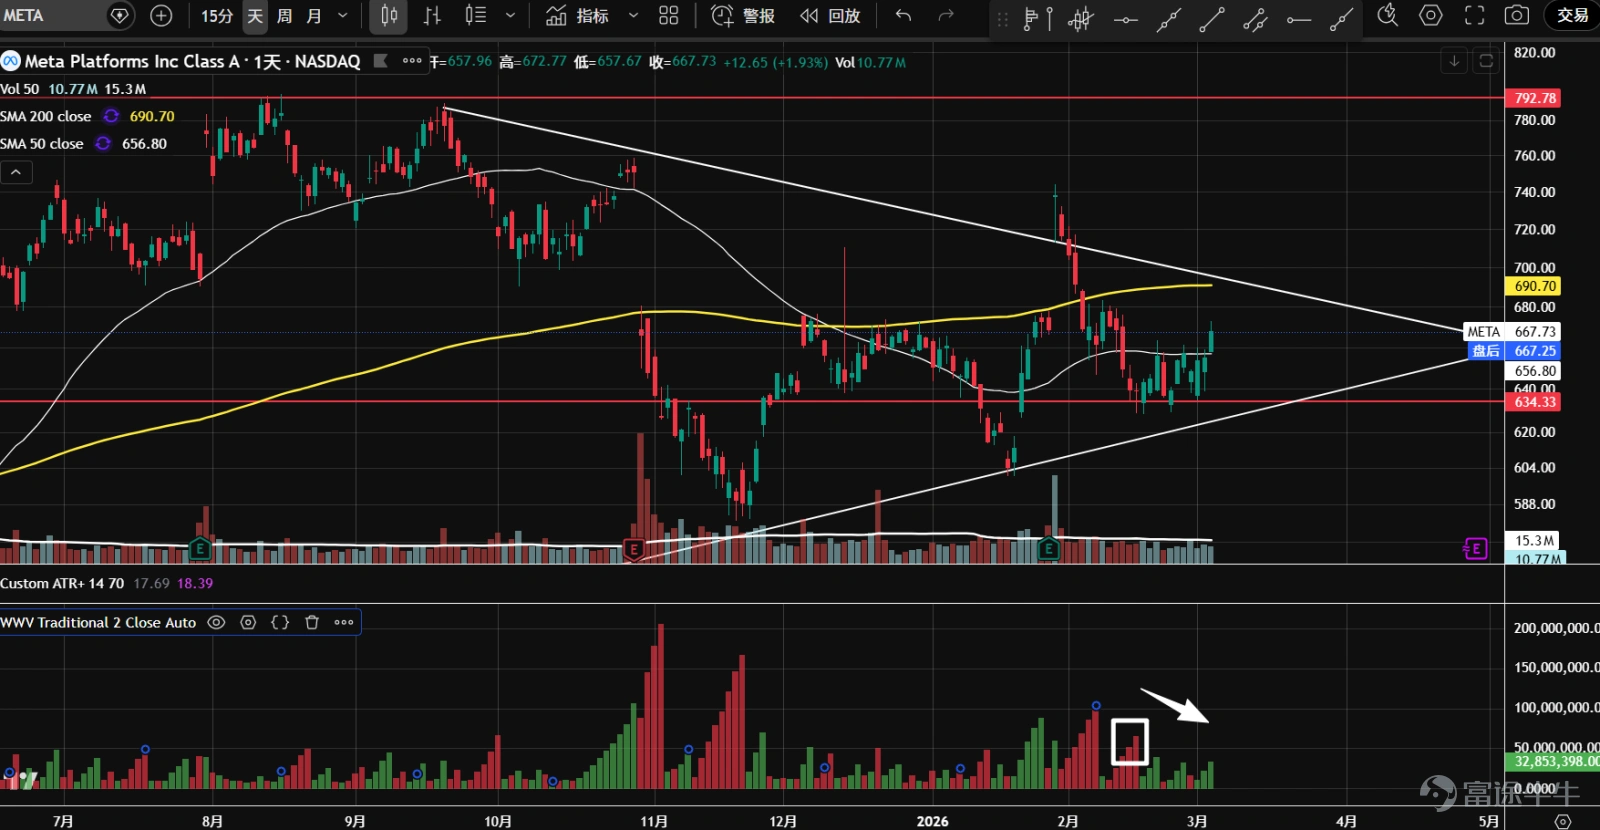
7、 $Meta Platforms (META.US)$ Since November last year, the stock has formed a large converging triangle pattern and is now approaching the tail end of the triangle. The most recent pullback did not touch the lower trendline but instead stabilized after a low-volume second test above the strong support at 634. Candlestick patterns have mostly closed near highs, indicating reduced selling pressure and bulls gaining the upper hand. A rebound has already begun.
1. The ETF for the seven major tech stocks ( $Roundhill Magnificent Seven ETF (MAGS.US)$ It began to consolidate sideways in October last year, and started falling from its peak at the end of January. The overall trading volume expanded, showing a bearish price-volume cycle with clear signs of distribution. Recently, it stabilized at the $60 support level and near the annual moving average line, closing with a high K-line. However, the trading volume remains too large, indicating significant disagreement between buyers and sellers. Pay attention to whether there will be another contraction test.  2、 $NVIDIA (NVDA.US)$ It has been continuously moving within a large consolidation range, repeatedly attempting to break through the upper resistance at 194.5 but failing each time. Following the release of the latest earnings report, it experienced heavy selling pressure at the upper resistance level, while the subsequent rebound lacked momentum due to shrinking volume. Generally, during the later stages of consolidation, if trading volumes are high during pullbacks but lower during rebounds, with wider price fluctuations, this is an important sign of distribution. The current direction remains unclear, and guidance from the GTC conference should be awaited.  3、 $Microsoft (MSFT.US)$ At the beginning of February this year, panic selling occurred near the previous gap area, followed by a brief rebound before reversing downward again. Although new lows were hit, trading volumes had already started contracting, and a swift rebound followed, confirming the effectiveness of the 393 support level. This was a successful second test. The control point for trading volumes shifted downwards, forming a type-b distribution. A short-term sideways consolidation may occur; watch for potential entry opportunities.  4、 $Apple (AAPL.US)$...
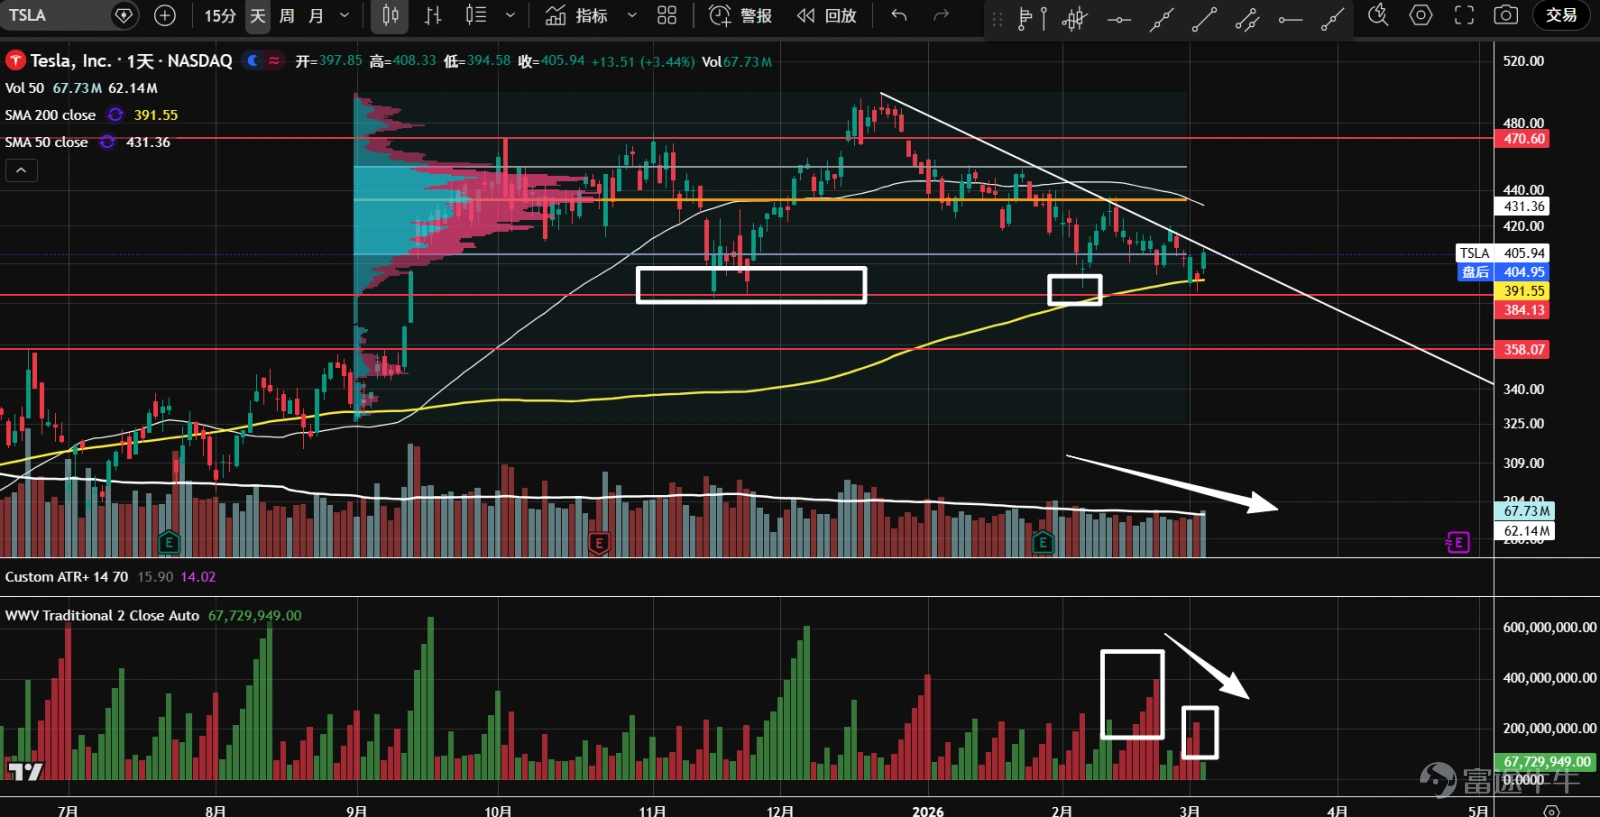
8、 $Tesla (TSLA.US)$ The stock has been range-bound since September of last year, and began to decline from the top of the range in late December. It is currently testing the double support of the bottom of the range at 384 and the yearly moving average for the second time, entering a critical angle position. Overall trading volume has gradually decreased, stabilizing during low-volume tests. Candlesticks are closing near the highs above the support zone, suggesting a high probability of an upward breakout.
1. The ETF for the seven major tech stocks ( $Roundhill Magnificent Seven ETF (MAGS.US)$ It began to consolidate sideways in October last year, and started falling from its peak at the end of January. The overall trading volume expanded, showing a bearish price-volume cycle with clear signs of distribution. Recently, it stabilized at the $60 support level and near the annual moving average line, closing with a high K-line. However, the trading volume remains too large, indicating significant disagreement between buyers and sellers. Pay attention to whether there will be another contraction test.  2、 $NVIDIA (NVDA.US)$ It has been continuously moving within a large consolidation range, repeatedly attempting to break through the upper resistance at 194.5 but failing each time. Following the release of the latest earnings report, it experienced heavy selling pressure at the upper resistance level, while the subsequent rebound lacked momentum due to shrinking volume. Generally, during the later stages of consolidation, if trading volumes are high during pullbacks but lower during rebounds, with wider price fluctuations, this is an important sign of distribution. The current direction remains unclear, and guidance from the GTC conference should be awaited.  3、 $Microsoft (MSFT.US)$ At the beginning of February this year, panic selling occurred near the previous gap area, followed by a brief rebound before reversing downward again. Although new lows were hit, trading volumes had already started contracting, and a swift rebound followed, confirming the effectiveness of the 393 support level. This was a successful second test. The control point for trading volumes shifted downwards, forming a type-b distribution. A short-term sideways consolidation may occur; watch for potential entry opportunities.  4、 $Apple (AAPL.US)$...
Risk Disclaimer: The above content only represents the author's view. It does not represent any position or investment advice of Futu. Futu makes no representation or warranty.Read more
Thumbs Up
6
Heart
3
Sob
1
Lol
1
Thumbs Up
1
368K Views
Report
Comments
Write a Comment...
12
2