After breaking through, the stock price of Chalco is targeting 16.3 yuan, with the support level at 13.5 yuan becoming critical.
Chalco (02600) has recently shown a strong stock price trend, becoming a market focus. As of March 4, 2026, Chalco closed at 14.75 yuan, surging by 5.43% in a single day, reaching an intraday high of 14.85 yuan, successfully breaking through the upper Bollinger Band on the daily chart. Along with the rise in stock price, trading volume also significantly increased, reaching 1.275 billion yuan, indicating active participation from market funds as both price and volume rose.It is worth noting that as of the morning session on March 5, the stock price further climbed to 15.27 yuan, continuing its strong performance. Investors are now most concerned about whether this upward momentum can continue, and where the potential upside target and support levels for a pullback may be.
From a technical analysis perspective, Chalco's stock price has been steadily rising since the beginning of the year, with recent gains accelerating notably. According to technical data as of March 4, the first resistance level for Chalco is around 15.4 yuan, which is very close to the previous high of 15.55 yuan set on January 29, making it an important psychological and technical test in the short term. If it can successfully break through 15.4 yuan and stabilize above it, the stock price will have a good chance to further test the 16.3 yuan level, which is also where the second resistance level lies. On the downside, the first support level is at 13.5 yuan, near the top of the sideways consolidation range in late February; the more crucial second support level is at 13.1 yuan, slightly below the 10-day moving average (13.8 yuan), serving as an important defense line for the short-term uptrend.
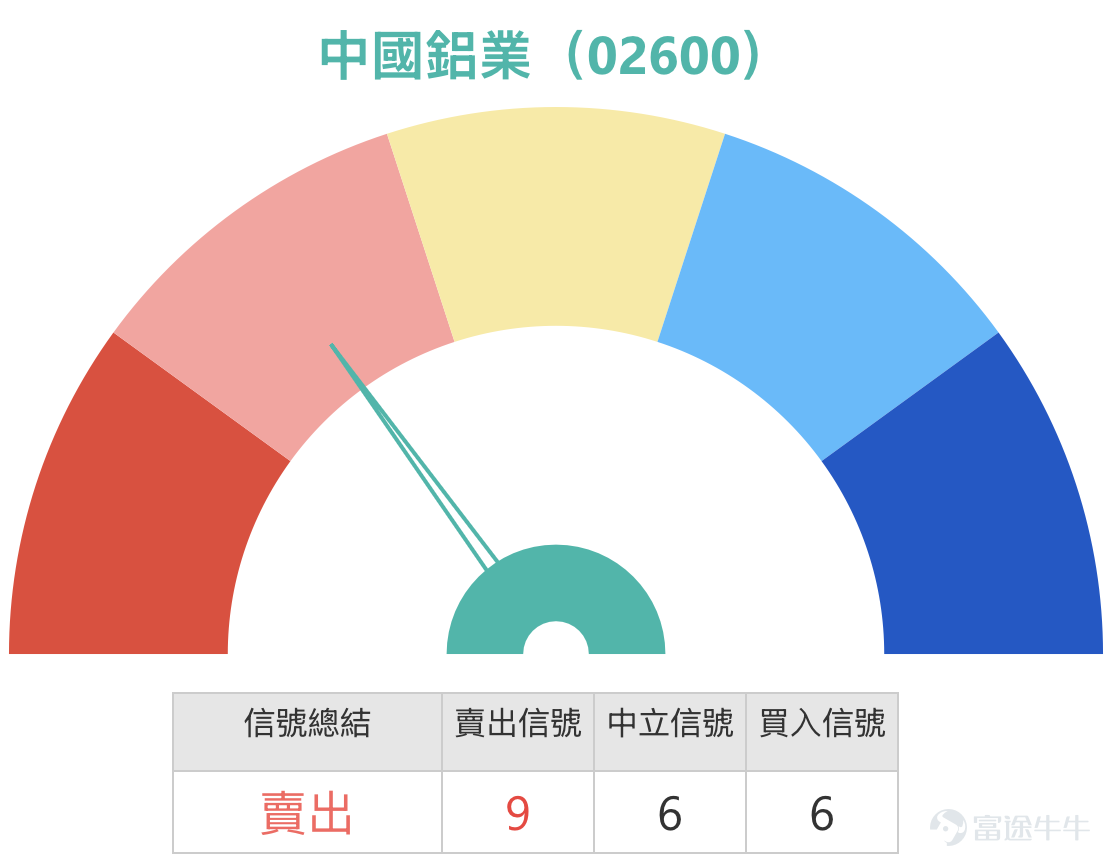
It is worth noting that although the stock price movement has been sharp, the overall technical indicator signal as of March 4 indicates a 'sell', with nine sell signals reflecting significant accumulated gains over the short term and suggesting technical pullback pressure. Several oscillating indicators show 'neutral' signals, with the Relative Strength Index (RSI) at 61, not yet entering the overbought zone (generally above 70). The Williams %R and Stochastic Oscillator both indicate neutral signals, while the CCI indicator gives a buy signal. Meanwhile, trend-following indicators such as Ichimoku Cloud, MACD, and Bollinger Bands still show buy signals, confirming that the medium-term uptrend has not reversed. In summary, the current technical signals suggest a 'strong but short-term overbought' pattern, and investors need to weigh the sustainability of the trend against the risk of a short-term pullback.

Reviewing the view from [HKEX Podcast] on March 4, the program noted that Chalco's recent trend has been quite strong, with the stock price breaking through the upper Bollinger Band on the daily chart, accompanied by a gradual increase in trading volume, signaling a typical breakout. Based on resistance calculations, the first resistance level is around 15.4 yuan, very close to the previous high of 15.55 yuan set on January 29; if it can successfully break through, the stock price will have a good chance to further test the 16.3 yuan level. The program’s viewpoint aligns closely with the above technical analysis, providing important reference for investors.
In the review of warrant products, the two China Aluminum Corporation-related call warrants mentioned on February 26, 2026, showed significant performance in the following two trading days (up to February 28). During this period, the underlying stock, China Aluminum Corporation, rose by 6.73%, and the Macquarie call warrant (22829) $MSALUCO@EC2607C.C (22829.HK)$ surged 32%, while the UBS Group call warrant (22845) $UBALUCO@EC2607A.C (22845.HK)$ rose 28% as well.
This data fully demonstrates the leverage effect that warrants can exert when the underlying stock rises. Investors using warrants and bull/bear certificates for deployment can capture potential returns from the movement of the underlying stock with a predefined risk (maximum loss being the premium invested). The core advantage of such products lies in capital efficiency and trading flexibility: investors can establish positions equivalent to holding a certain amount of the underlying stock with relatively less capital, thereby amplifying potential returns. Meanwhile, whether they are bullish or bearish on the market, investors can deploy different types of products. When spotting short-term support levels, they can use call warrants to capture breakout opportunities, or use put warrants for hedging near resistance levels. Bull/bear certificates also have a forced stop mechanism; if the underlying stock hits the stop price, the product will terminate immediately. Therefore, choosing the stop price requires careful consideration of key support and resistance levels of the underlying stock.

#LearnWarrantsAndBullBearCertificatesWithJenny# Key Analysis: 'Change in Street Volume from Previous Day'
Among the terms of warrants and bull/bear certificates, there is an indicator often overlooked by investors but highly valuable for reference: the 'Change in Street Volume from Previous Day' provided by Societe Generale's website and other warrant issuers. 'Street volume' refers to the quantity of warrants or bull/bear certificates already bought and held by investors, which have not been repurchased and canceled by the issuer, usually displayed as a percentage of the total issuance of the product. The change in street volume reflects the increase or decrease in accumulated holdings of the product by market investors over the past trading day.
The significance of this indicator lies in revealing the flow of market funds and retail investor sentiment. When the street volume of a product continues to increase, it means more and more investors are buying and holding the product, forming a certain 'retail consensus.' Conversely, if the street volume continuously decreases, it indicates investors are taking profits or cutting losses. Investors should analyze the changes in street volume alongside the trend of the underlying stock and technical levels. For example, when China Aluminum Corporation breaks through the resistance level of 15.4 yuan, if the street volume of call warrants increases moderately at the same time, it can be considered a positive signal. However, if the stock price approaches the resistance level and the street volume surges, one must be cautious about the profit-taking pressure after 'crowded trades.'
Given the strong current trend of China Aluminum Corporation’s share price, combined with the above-mentioned support level of 13.5 yuan and resistance levels of 15.4 yuan and 16.3 yuan, investors can choose suitable warrant products based on their own views. For those optimistic about China Aluminum Corporation extending its strength, breaking through the 15.4 yuan resistance level, and testing 16.3 yuan, consider the following call warrants:
UBS Group call warrant (22437) $UBALUCO@EC2605A.C (22437.HK)$ with an exercise price of 14.89 yuan, providing approximately 5.9 times leverage. The distinguishing feature of this product is that both its premium and implied volatility are the lowest among similar products, effectively reducing holding costs and volatility risks, making it suitable for a conservative leverage strategy. Macquarie call warrant (22380) $MSALUCO@EC2605A.C (22380.HK)$The strike price is 14.89 yuan, with a leverage of approximately 5.7 times. This warrant offers relatively ideal leverage and implied volatility levels, providing good cost-effectiveness. When choosing the above two products, note that the strike price of 14.89 yuan is slightly higher than the closing price of 14.75 yuan on March 4, making it a slightly out-of-the-money warrant. The leverage effect is quite favorable for capturing breakout movements.
For more aggressive investors who are optimistic about China Aluminum's potential to surge above 16 yuan, they may consider Bank of China call warrants (24177).$BIALUCO@EC2605A.C (24177.HK)$The strike price is 16.89 yuan, with a leverage of about 5.9 times. This product has a higher strike price and is an out-of-the-money warrant. Although its premium is relatively high at 19.26%, it provides higher potential leverage, making it suitable for investors expecting significant upward price movement. The advantage of choosing such products lies in their lower cost, but be aware of faster time decay, making them suitable for short-term trading.

Interactive Questions:
Dear readers, do you think China Aluminum (02600) can successfully break through the resistance level of 15.4 yuan in the short term?
A) Yes, benefiting from strong aluminum prices and positive factors, it will further test the 16.3 yuan level.
B) No, short-term overbought conditions require consolidation first, retesting the support level of 13.5 yuan.
Feel free to share your views in the comment section!
Follow Jenny's HK Stock Warrants for deeper analysis of the warrants and bull/bear certificates market!
Friendly Reminder: This article does not constitute any investment advice.
This article is for reference only and does not constitute any investment advice. The market data, opinions, and analysis contained herein may change at any time without prior notice. We are not responsible for any loss or damage caused by reliance on the information in this article. Technical analysis only shows whether certain technical conditions are met; a comprehensive assessment of asset performance should combine other data and should not solely rely on this article to make trading decisions. Please note that past performance is not indicative of future results. Follow Jenny's insights on Hong Kong stock warrants for more professional analysis.
#China Aluminum #02600 #HongKongStocks #TechnicalAnalysis #SupportResistanceLevels #Warrants #BullBearCertificates #CallOptions #AluminumPrice #Geopolitics #HongKongWarrantsJenny
Risk Disclaimer: The above content only represents the author's view. It does not represent any position or investment advice of Futu. Futu makes no representation or warranty.Read more

Comments
to post a comment
2
12