English
Back
Open Account
港股窩輪Jenny
wrote a column ·

HSBC's technical signals are neutral, short-term focus on the MA30 resistance (136.07 HKD)

The previous day (March 4), Hong Kong-listed banking stocks generally performed weakly $HSBC HOLDINGS (00005.HK)$
The stock closed at 130.8 HKD for the day, down 3.68% in a single day with a trading volume of 4.655 billion HKD, showing an overall weak consolidation pattern. The specific technical details are as follows: the closing price is below the MA10 (138.1 HKD) and MA30 (136.07 HKD), but slightly above the MA60 (128.14 HKD), which provides temporary support without an effective breakdown yet. The RSI is 43, indicating a mid-to-lower range; the comprehensive technical indicator signal is 'neutral', with intensity 10; the Williams %R is in an oversold condition but has not issued a strong buy signal. MACD, Bollinger Bands, and other trend indicators lean towards selling, making the overall signals mixed, with unclear short-term direction.
The previous day (March 4), Hong Kong-listed banking stocks generally performed weakly $HSBC HOLDINGS (00005.HK)$ The stock closed at 130.8 HKD for the day, down 3.68% in a single day with a trading volume of 4.655 billion HKD, showing an overall weak consolidation pattern. The specific technical details are as follows: the closing price is below the MA10 (138.1 HKD) and MA30 (136.07 HKD), but slightly above the MA60 (128.14 HKD), which provides temporary support without an effective breakdown yet. The RSI is 43, indicating a mid-to-lower range; the comprehensive technical indicator signal is 'neutral', with intensity 10; the Williams %R is in an oversold condition but has not issued a strong buy signal. MACD, Bollinger Bands, and other trend indicators lean towards selling, making the overall signals mixed, with unclear short-term direction. Banking stocks: HSBC Holdings $STANCHART (02888.HK)$ 、 $BOC HONG KONG (02388.HK)$ 、 $BANK OF E ASIA (00023.HK)$ The previous day (March 4), banking stocks fell across the board, reflecting a cautious market sentiment toward the financial sector in the short term. Common trends show that all individual stocks' closing prices were below both the MA10 and MA30, indicating consistent weakness in the sector’s short-term trend. The RSI ranges between 34 and 44, releasing some downward momentum, but not entering the extremely oversold region, leaving the market still in a wait-and-see phase. However, technical signals have diverged: $STANCHART (02888.HK)$ The RSI is 34, combining...
Banking stocks: HSBC Holdings $STANCHART (02888.HK)$$BOC HONG KONG (02388.HK)$$BANK OF E ASIA (00023.HK)$ The previous day (March 4), banking stocks fell across the board, reflecting a cautious market sentiment toward the financial sector in the short term. Common trends show that all individual stocks' closing prices were below both the MA10 and MA30, indicating consistent weakness in the sector’s short-term trend. The RSI ranges between 34 and 44, releasing some downward momentum, but not entering the extremely oversold region, leaving the market still in a wait-and-see phase.
However, technical signals have diverged: $STANCHART (02888.HK)$ The RSI is at 34, with comprehensive technical signals suggesting a 'buy,' as multiple oscillation indicators point to a high likelihood of a rebound from oversold conditions; whereas for HSBC, Bank of China (Hong Kong), and East Asia Bank, the comprehensive signal remains 'neutral.' Although there are signs of being oversold, no strong consensus for buying has formed yet. Comparatively, Standard Chartered shows stronger demand for a short-term rebound.
As of 10:11 AM today (5th), HSBC's latest price was HKD 135.1, with a temporary rebound of 3.21%.Immediate resistance is seen at HKD 138.3, with further resistance at HKD 143.8 if broken through. In the short term, focus will be on whether it can regain support above the MA30. Support levels will mainly be watched around the MA60 level of HKD 128.14, with further support at HKD 126.9.
Review and Selection of Bull/Bear Warrants:
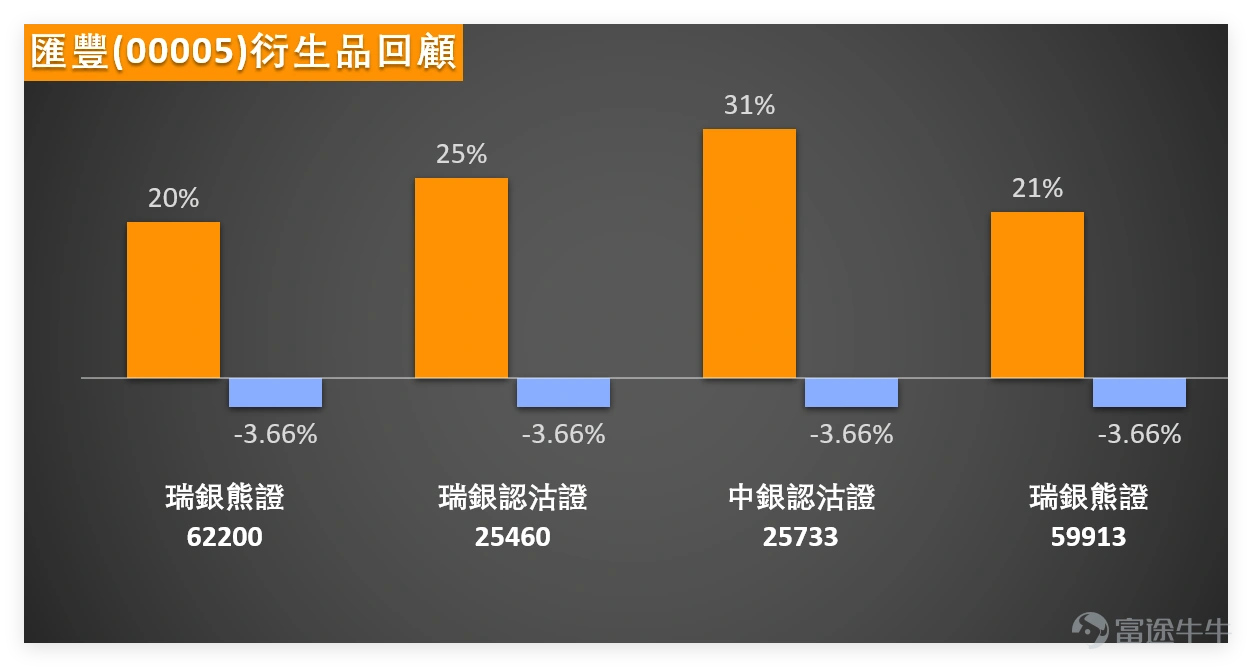
1. Warrant Review: The HSBC-related warrants and bear contracts recommended on February 26 performed well, $BI-HSBC@EP2607B.P (25733.HK)$ with gains reaching 31% two days later, $UB-HSBC@EP2607B.P (25460.HK)$ and increases of 25%. UBS Group bear contracts ( $UB#HSBC RP2802B.P (62200.HK)$$UB#HSBC RP2701A.P (59913.HK)$ ) gained 20% and 21%, respectively, matching the underlying stock's drop of 3.66% on that day, achieving solid returns.
The previous day (March 4), Hong Kong-listed banking stocks generally performed weakly $HSBC HOLDINGS (00005.HK)$ The stock closed at 130.8 HKD for the day, down 3.68% in a single day with a trading volume of 4.655 billion HKD, showing an overall weak consolidation pattern. The specific technical details are as follows: the closing price is below the MA10 (138.1 HKD) and MA30 (136.07 HKD), but slightly above the MA60 (128.14 HKD), which provides temporary support without an effective breakdown yet. The RSI is 43, indicating a mid-to-lower range; the comprehensive technical indicator signal is 'neutral', with intensity 10; the Williams %R is in an oversold condition but has not issued a strong buy signal. MACD, Bollinger Bands, and other trend indicators lean towards selling, making the overall signals mixed, with unclear short-term direction. Banking stocks: HSBC Holdings $STANCHART (02888.HK)$ 、 $BOC HONG KONG (02388.HK)$ 、 $BANK OF E ASIA (00023.HK)$ The previous day (March 4), banking stocks fell across the board, reflecting a cautious market sentiment toward the financial sector in the short term. Common trends show that all individual stocks' closing prices were below both the MA10 and MA30, indicating consistent weakness in the sector’s short-term trend. The RSI ranges between 34 and 44, releasing some downward momentum, but not entering the extremely oversold region, leaving the market still in a wait-and-see phase. However, technical signals have diverged: $STANCHART (02888.HK)$ The RSI is 34, combining...
2. Product Selection:
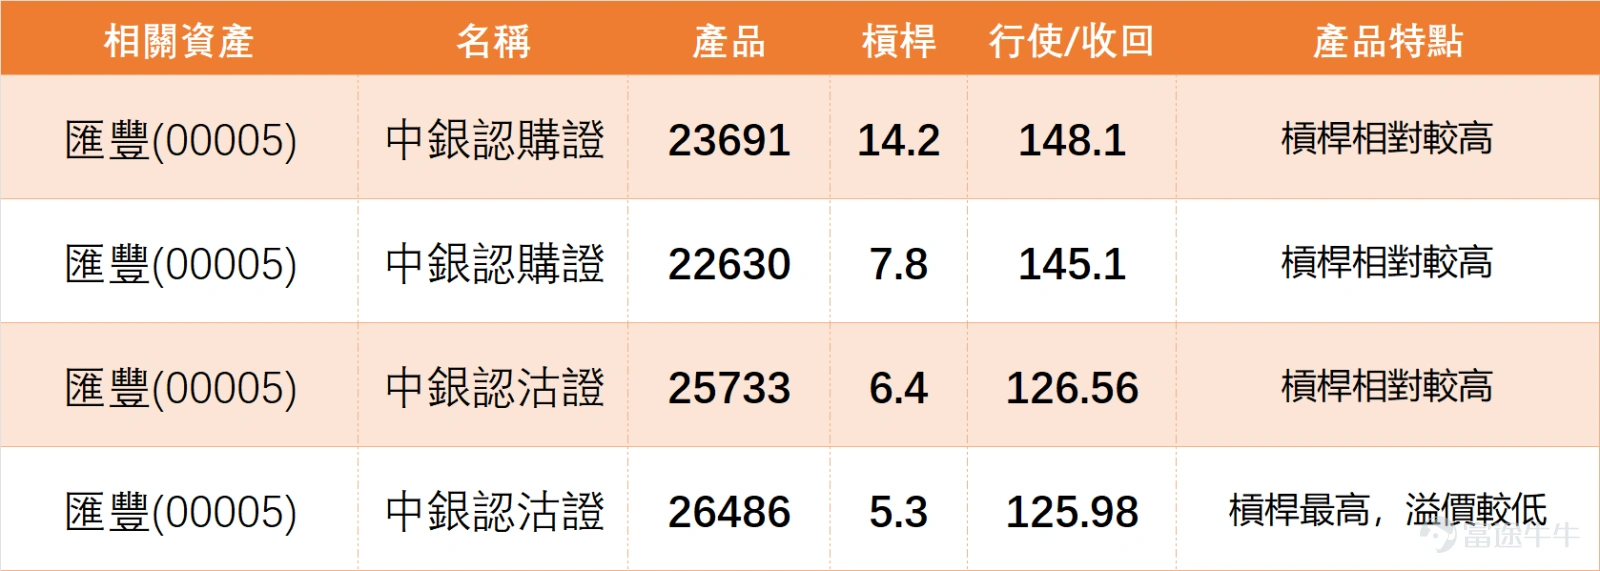
$BI-HSBC@EP2607B.P (25733.HK)$ Leverage of 6.4, strike price at HKD 126.56, relatively high leverage suitable for short-term investors bearish on HSBC; note the support level near the strike price.
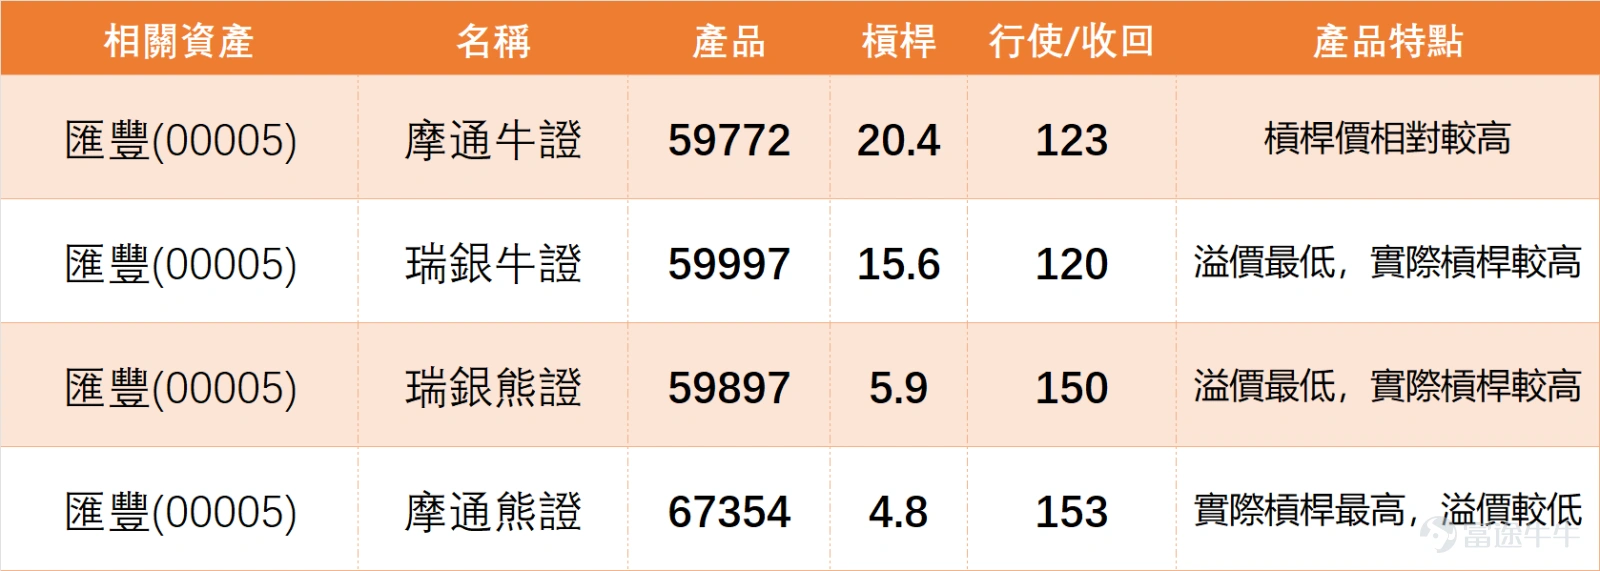
$JP#HSBC RP2702C.P (67354.HK)$ Highest actual leverage with lower premium, recovery price at HKD 153, risk is relatively controllable, suitable for investors expecting HSBC to weaken in the short term.
The previous day (March 4), Hong Kong-listed banking stocks generally performed weakly $HSBC HOLDINGS (00005.HK)$ The stock closed at 130.8 HKD for the day, down 3.68% in a single day with a trading volume of 4.655 billion HKD, showing an overall weak consolidation pattern. The specific technical details are as follows: the closing price is below the MA10 (138.1 HKD) and MA30 (136.07 HKD), but slightly above the MA60 (128.14 HKD), which provides temporary support without an effective breakdown yet. The RSI is 43, indicating a mid-to-lower range; the comprehensive technical indicator signal is 'neutral', with intensity 10; the Williams %R is in an oversold condition but has not issued a strong buy signal. MACD, Bollinger Bands, and other trend indicators lean towards selling, making the overall signals mixed, with unclear short-term direction. Banking stocks: HSBC Holdings $STANCHART (02888.HK)$ 、 $BOC HONG KONG (02388.HK)$ 、 $BANK OF E ASIA (00023.HK)$ The previous day (March 4), banking stocks fell across the board, reflecting a cautious market sentiment toward the financial sector in the short term. Common trends show that all individual stocks' closing prices were below both the MA10 and MA30, indicating consistent weakness in the sector’s short-term trend. The RSI ranges between 34 and 44, releasing some downward momentum, but not entering the extremely oversold region, leaving the market still in a wait-and-see phase. However, technical signals have diverged: $STANCHART (02888.HK)$ The RSI is 34, combining...
Risk Warning: Warrants and bull/bear products are derivatives with significant leverage effects. Investors should choose according to their risk tolerance and act within their means.
Do you currently hold HSBC shares? A. Holding (averaging down/holding steady). B. Not holding (waiting on the sidelines/waiting for entry).
Feel free to share your insights in the comment section. For more market analysis, stay tuned to 'HK Stock Warrants Jenny' for daily updates!
Reminder: This article does not constitute any investment advice.
This article is for reference only and does not constitute any investment advice. The market data, opinions, and analysis contained herein may change at any time without prior notice. We are not responsible for any loss or damage caused by reliance on the information in this article. Technical analysis only shows whether certain technical conditions are met; a comprehensive assessment of asset performance should be conducted using additional data. Decisions to trade should not be based solely on this article. Please note that past performance is not indicative of future results.
#HongKongStocks #RealTimeAnalysis #WarrantsSelection #WarrantsStrategy #DerivativesHedging #HongKongWarrantsJenny #HSBCHoldings #BankingSector #TechnicalAnalysis
Risk Disclaimer: The above content only represents the author's view. It does not represent any position or investment advice of Futu. Futu makes no representation or warranty.Read more
174K Views
Report
Comment (1)
Write a Comment...
1