
AI and electric vehicles drive growth! Can Xiaomi's rebound momentum continue?

Bull certificates below HK$30 increased by 253 contracts: How strong is the signal of funds bottom-fishing Xiaomi?
[HK Stocks Podcast] Classic Review: Xiaomi's correction exceeds 17%, bearish products surged up to 104%
Xiaomi Group (01810) has seen significant pressure on its share price recently, closing at HK$31.58 on March 3, 2026, with a single-day drop of 4.71% and trading volume surging to HK$8.957 billion. Observing from the technical trend, the stock has retreated from its high at the beginning of this year, and recently fell below several key moving averages, showing a clear adjustment pattern. However, today’s (March 4) share price stood at HK$31.96, rebounding by 1.2%.
Technical Analysis and Support/Resistance Levels
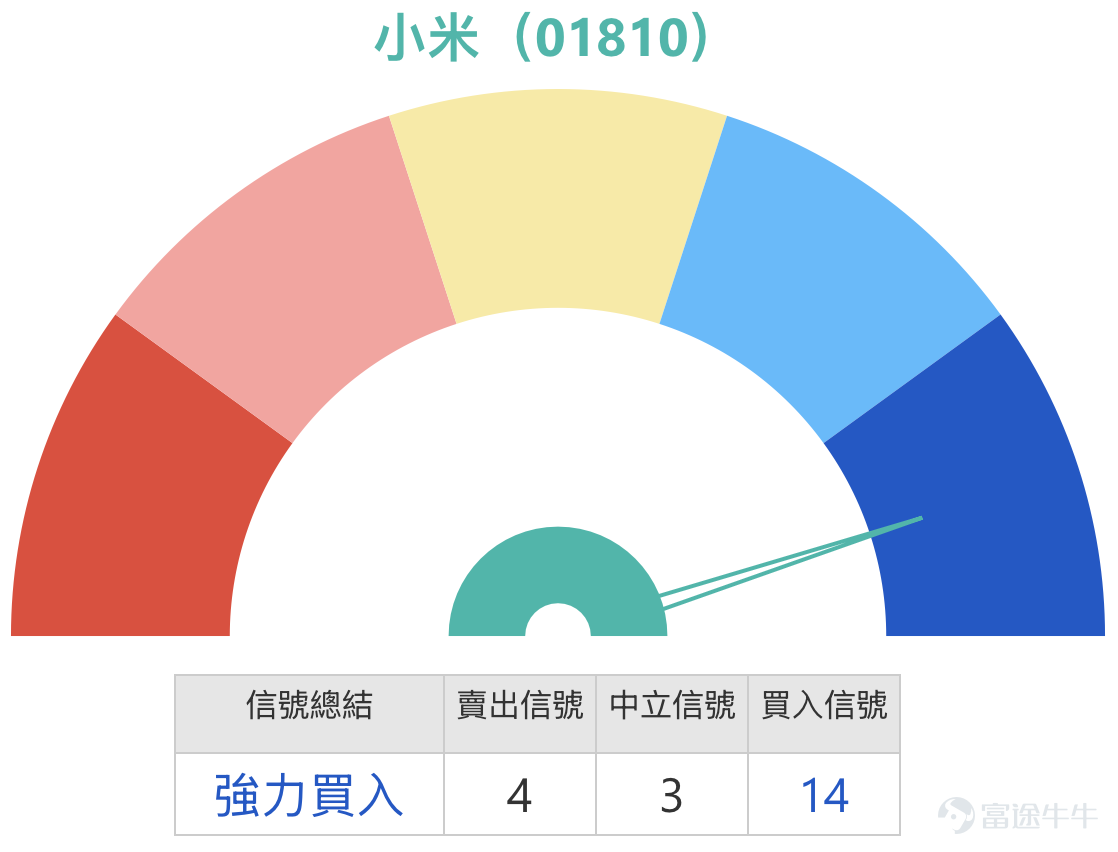
Based on a comprehensive analysis of technical indicators, Xiaomi is currently in a range where 'buy' signals are dominant, with a signal strength of 11, mainly due to multiple oscillators issuing oversold signals. The RSI is at 25, indicating a deeply oversold level; Williams %R, Stochastic Oscillator, and CCI indicators are all in oversold territory and issuing buy signals. More notably, the momentum oscillator showed a 'bullish divergence' buy signal, meaning that while prices were making new lows, downward momentum was weakening, which is one of the forward-looking signals of a potential trend reversal. The VR trading ratio indicator also shows 'oversold, possible bottom forming,' and the bull-bear power indicator similarly issued a buy signal.
However, on the flip side of these positive signals, trend-following indicators are entirely bearish. The MACD signal, Bollinger Bands, and Ichimoku Cloud all clearly issue sell signals, and the stock price is near the lower band of the Bollinger Bands, indicating that the downtrend remains dominant. The 10-day line (HK$35.16), 30-day line (HK$35.5), and 60-day line (HK$37.77) have all been breached, showing a standard bearish alignment. Overall, Xiaomi is currently in a significant divergence between 'downward trend' and 'extremely oversold momentum.'
From a technical perspective, Xiaomi Group's short-term support level is at HKD 30.6. If this level is breached, the next support will be tested at HKD 27.8. As for resistance levels, the immediate short-term resistance lies at HKD 34.3; if it can break through, the upward target would be HKD 36.8. Market analysts generally believe that HKD 34.3 is the initial rebound test level, with stronger resistance located near HKD 36.5-37, where multiple moving averages converge, making it harder to break through.
![[HK Stocks Podcast] Classic Review: Xiaomi's correction exceeds 17%, bearish products surged up to 104% Xiaomi Group (01810) has seen significant pressure on its share price recently, closing at HK$31.58 on March 3, 2026, with a single-day drop of 4.71% and trading volume surging to HK$8.957 billion. Observing from the technical trend, the stock has retreated from its high at the beginning of this year, and recently fell below several key moving averages, showing a clear adjustment pattern. However, today’s (March 4) share price stood at HK$31.96, rebounding by 1.2%. Technical Analysis and Support/Resistance Levels Based on a comprehensive analysis of technical indicators, Xiaomi is currently in a range where 'buy' signals are dominant, with a signal strength of 11, mainly due to multiple oscillators issuing oversold signals. The RSI is at 25, indicating a deeply oversold level; Williams %R, Stochastic Oscillator, and CCI indicators are all in oversold territory and issuing buy signals. More notably, the momentum oscillator showed a 'bullish divergence' buy signal, meaning that while prices were making new lows, downward momentum was weakening, which is one of the forward-looking signals of a potential trend reversal. The VR trading ratio indicator also shows 'oversold, possible bottom forming,' and the bull-bear power indicator similarly issued a buy signal. However, on the flip side of these positive signals, trend-following indicators are entirely bearish. The MACD signal, Bollinger Bands, and Ichimoku Cloud all clearly issue sell signals, and the stock price is near the lower band of the Bollinger Bands, indicating that the downtrend remains dominant...](https://nnqimage.futunn.com/sns_client_feed/1162342/20260304/web-1772594259477-DGMWDjmW5P.png/big?area=1&is_public=true&imageMogr2/ignore-error/1/format/webp)
Combined with [Hong Kong Stock Podcast] viewpoint analysis
Reviewing Simon's analysis of Xiaomi Group in the February 11 [HK Stocks Podcast], when the stock closed at HKD 37.1, it was in a recovery phase. Simon pointed out that to reach the target level of HKD 40, two key thresholds need to be broken: the first threshold at HKD 38.8, and if successfully surpassed, the stock could further rise to HKD 39.7. Meanwhile, he mentioned that some investors, seeing the stock price rise to higher levels, chose to deploy put warrants for bearish operations, believing that the recent significant stock price increase carried downside risks. This view aligns perfectly with Xiaomi's current decline from around HKD 37 to HKD 31.58.
In the February 6 Podcast, Simon also analyzed Xiaomi Group’s movements. At that time, the stock closed near HKD 35.18. Regarding the deployment of put warrants, he mentioned that there were near-the-money put warrants available in the market with an exercise price of approximately HKD 35.16, offering leverage of over 6 times. However, these products had expiration dates concentrated in April of this year, and due to their shorter duration, they experienced faster time decay. To mitigate the loss of time value, one could consider products expiring in June this year, with exercise prices ranging between HKD 31 and HKD 32, representing out-of-the-money ranges of about 8.5% to 9.4%. Comparing the current price of HKD 31.58, the put warrants Simon mentioned with exercise prices of HKD 31-32 have moved from being 8.5%-9.4% out-of-the-money to nearly at-the-money or slightly in-the-money, reflecting his forward-looking judgment on downside risk.
Observation of the street-level holdings distribution
According to the March 3 data on Xiaomi Group’s bull and bear certificate street-level holdings distribution, the overall long-short structure shows a clear dominance of bear certificates. The ratio of bull to bear certificates is approximately 64.9% to 35.1%, with total bear certificate holdings reaching 5,709 contracts compared to 3,130 contracts for bull certificates, indicating strong overall bearish sentiment in the market.
Looking at the distribution of bear certificates (bearish), capital is highly concentrated in the narrow range of HKD 39-42.98, forming a strong resistance zone. Specifically, the HKD 39-39.98 range holds 2,741 bear certificates, making it the most densely held area; the HKD 42-42.98 range has 2,007 bear certificates, increasing by 18 from the previous day. Notably, the HKD 37-37.98 range saw an addition of 62 bear certificates, the largest daily increase, showing an intensified bearish sentiment at this price level. This echoes the technical resistance levels at HKD 36.8 and HKD 38.1, indicating heavy upward pressure.
From the perspective of bull certificate (bullish) street-level holdings distribution, capital is mainly concentrated in the HKD 29-31.98 range, forming a key support zone against declines. In the HKD 30-30.98 range, there are 936 bull certificates, with an increase of 253 on the day, making it the area with the highest inflow of bull certificates, suggesting active bottom-fishing activities at this price level, closely related to the technical support level at HKD 30.6. Meanwhile, the HKD 31-31.98 range saw a large outflow of 1,287 bull certificates, reflecting notable profit-taking or stop-loss pressures near this price. The current price of HKD 31.58 is situated between the dense zones of bull and bear certificates, with major resistance above at HKD 39-42.98 and major support below at HKD 29-30.98, leading to continued multi-air battles within these two critical ranges.
![[HK Stocks Podcast] Classic Review: Xiaomi's correction exceeds 17%, bearish products surged up to 104% Xiaomi Group (01810) has seen significant pressure on its share price recently, closing at HK$31.58 on March 3, 2026, with a single-day drop of 4.71% and trading volume surging to HK$8.957 billion. Observing from the technical trend, the stock has retreated from its high at the beginning of this year, and recently fell below several key moving averages, showing a clear adjustment pattern. However, today’s (March 4) share price stood at HK$31.96, rebounding by 1.2%. Technical Analysis and Support/Resistance Levels Based on a comprehensive analysis of technical indicators, Xiaomi is currently in a range where 'buy' signals are dominant, with a signal strength of 11, mainly due to multiple oscillators issuing oversold signals. The RSI is at 25, indicating a deeply oversold level; Williams %R, Stochastic Oscillator, and CCI indicators are all in oversold territory and issuing buy signals. More notably, the momentum oscillator showed a 'bullish divergence' buy signal, meaning that while prices were making new lows, downward momentum was weakening, which is one of the forward-looking signals of a potential trend reversal. The VR trading ratio indicator also shows 'oversold, possible bottom forming,' and the bull-bear power indicator similarly issued a buy signal. However, on the flip side of these positive signals, trend-following indicators are entirely bearish. The MACD signal, Bollinger Bands, and Ichimoku Cloud all clearly issue sell signals, and the stock price is near the lower band of the Bollinger Bands, indicating that the downtrend remains dominant...](https://nnqimage.futunn.com/sns_client_feed/1162342/20260304/web-1772594370518-32DQgmj6rO.png/big?area=1&is_public=true&imageMogr2/ignore-error/1/format/webp)
Review of Warrant Products
Reviewing Xiaomi Group’s warrant products mentioned on February 27, their performance in the following two days confirmed the impressive returns of bearish products. UBS Group’s bear certificate (59592) surged 104% in the two days after being mentioned, while the underlying stock fell by 9.51% during the same period; J.P. Morgan's bear certificate (60434) $JP#XIAMIRP2810G.P (60434.HK)$ rose by 97%; HSBC’s put warrant (23111) $HSXIAMI@EP2607A.P (23111.HK)$ gained 70%; Bank of China’s put warrant (23123) rose by 54%.
![[HK Stocks Podcast] Classic Review: Xiaomi's correction exceeds 17%, bearish products surged up to 104% Xiaomi Group (01810) has seen significant pressure on its share price recently, closing at HK$31.58 on March 3, 2026, with a single-day drop of 4.71% and trading volume surging to HK$8.957 billion. Observing from the technical trend, the stock has retreated from its high at the beginning of this year, and recently fell below several key moving averages, showing a clear adjustment pattern. However, today’s (March 4) share price stood at HK$31.96, rebounding by 1.2%. Technical Analysis and Support/Resistance Levels Based on a comprehensive analysis of technical indicators, Xiaomi is currently in a range where 'buy' signals are dominant, with a signal strength of 11, mainly due to multiple oscillators issuing oversold signals. The RSI is at 25, indicating a deeply oversold level; Williams %R, Stochastic Oscillator, and CCI indicators are all in oversold territory and issuing buy signals. More notably, the momentum oscillator showed a 'bullish divergence' buy signal, meaning that while prices were making new lows, downward momentum was weakening, which is one of the forward-looking signals of a potential trend reversal. The VR trading ratio indicator also shows 'oversold, possible bottom forming,' and the bull-bear power indicator similarly issued a buy signal. However, on the flip side of these positive signals, trend-following indicators are entirely bearish. The MACD signal, Bollinger Bands, and Ichimoku Cloud all clearly issue sell signals, and the stock price is near the lower band of the Bollinger Bands, indicating that the downtrend remains dominant...](https://nnqimage.futunn.com/sns_client_feed/1162342/20260304/web-1772594442827-MhTagNF3JB.png/big?area=1&is_public=true&imageMogr2/ignore-error/1/format/webp)
Recommended Warrant Products and Terms Analysis
For investors optimistic about Xiaomi Group's rebound, you can pay attention to the following two call warrants. HSBC Call Warrant (22791) has a strike price of 37.12 yuan, offering 4.6x leverage with relatively low premium, making it suitable for investors looking to capture the rebound at a lower cost. This strike price is higher than the current price of 31.58 yuan, categorizing it as an out-of-the-money product. If the underlying stock can break through the short-term resistance level at 34.3 yuan and advance further towards 36.8 yuan, this warrant will gradually move into the in-the-money state, potentially delivering significant returns. Bank of China Call Warrant (13186) also has a strike price of 37.15 yuan, providing 4.6x leverage. Its key feature is that both the premium and implied volatility are the lowest among similar products, meaning investors incur less time cost, resulting in better cost efficiency.
For investors bearish on Xiaomi Group, consider the following two put warrants. UBS Put Warrant (23061) has a strike price of 31.28 yuan, offering 6.3x leverage with relatively low premium, suitable for capturing further short-term declines. This strike price is slightly below the current price of 31.58 yuan, making it an at-the-money put warrant with high sensitivity to declines in the underlying stock. If the share price breaks below the support level at 30.6 yuan and moves further down towards 27.8 yuan, this warrant’s performance will be more prominent. Bank of China Put Warrant (13235) has a strike price of 31.88 yuan, offering 5.3x leverage, with the lowest implied volatility among similar products, featuring higher leverage. If investors expect the stock price to gradually test the 30-yuan level, this warrant is a more stable choice.
![[HK Stocks Podcast] Classic Review: Xiaomi's correction exceeds 17%, bearish products surged up to 104% Xiaomi Group (01810) has seen significant pressure on its share price recently, closing at HK$31.58 on March 3, 2026, with a single-day drop of 4.71% and trading volume surging to HK$8.957 billion. Observing from the technical trend, the stock has retreated from its high at the beginning of this year, and recently fell below several key moving averages, showing a clear adjustment pattern. However, today’s (March 4) share price stood at HK$31.96, rebounding by 1.2%. Technical Analysis and Support/Resistance Levels Based on a comprehensive analysis of technical indicators, Xiaomi is currently in a range where 'buy' signals are dominant, with a signal strength of 11, mainly due to multiple oscillators issuing oversold signals. The RSI is at 25, indicating a deeply oversold level; Williams %R, Stochastic Oscillator, and CCI indicators are all in oversold territory and issuing buy signals. More notably, the momentum oscillator showed a 'bullish divergence' buy signal, meaning that while prices were making new lows, downward momentum was weakening, which is one of the forward-looking signals of a potential trend reversal. The VR trading ratio indicator also shows 'oversold, possible bottom forming,' and the bull-bear power indicator similarly issued a buy signal. However, on the flip side of these positive signals, trend-following indicators are entirely bearish. The MACD signal, Bollinger Bands, and Ichimoku Cloud all clearly issue sell signals, and the stock price is near the lower band of the Bollinger Bands, indicating that the downtrend remains dominant...](https://nnqimage.futunn.com/sns_client_feed/1162342/20260304/web-1772594479918-6yvHkiNHmp.png/big?area=1&is_public=true&imageMogr2/ignore-error/1/format/webp)
Bull/Bear Certificate Recommendations and Terms Analysis
Investors bullish on Xiaomi Group can pay attention to the following two bull contracts. UBS Bull Contract (67825) $UB#XIAMIRC2609A.C (67825.HK)$ with a recovery price of 30 yuan, provides 13.2x actual leverage, characterized by high actual leverage, low premium, and excellent cost-effectiveness. The recovery price of 30 yuan is below the short-term support level of 30.6 yuan and lies within the concentrated range of bull contracts between 30-30.98 yuan, offering a buffer space of approximately 1.58 yuan, demonstrating solid downside protection, making it suitable for adopting a strategy of buying on dips. HSBC Bull Contract (58641) also has a recovery price of 30 yuan, providing 13.2x leverage with similar terms, catering to investors who prefer different issuers.
Investors bearish on Xiaomi Group can focus on the following two bear contracts. J.P. Morgan Bear Contract (60434) has a recovery price of 37.8 yuan, offering 5.5x actual leverage, the highest among similar products, with relatively low premium, suitable for investors seeking higher returns. The recovery price of 37.8 yuan is below the most concentrated range of bear contracts between 39-39.98 yuan but above the range of 37-37.98 yuan which has recently seen capital inflows, providing a buffer space of approximately 6.22 yuan, showing decent defensive characteristics. UBS Bear Contract (59592) $UB#XIAMIRP2810E.P (59592.HK)$ also has a recovery price of 37.8 yuan, providing 5.5x actual leverage with similar terms, allowing investors to choose based on their preferences. Notably, these two bear contracts recorded increases of 97% and 104% respectively two days after being mentioned on February 27, reflecting their high sensitivity to declines in the underlying stock.
Summary and Interactive Questions
In summary, Xiaomi Group remains constrained by a short-term downtrend, with technical indicators showing a significant divergence between 'downward trend' and 'oversold momentum,' making the support levels of 30.6 yuan and 27.8 yuan critical defensive zones. Street-level positioning shows a high concentration of bear contracts in the 39-42.98 yuan range, forming upward resistance; while bull contracts have actively increased positions in the 29-30.98 yuan range, creating downward support. Market news presents mixed signals: downward revisions from institutions add pressure, while the company's ongoing buybacks demonstrate confidence. Simon’s analysis in February had already pointed out the risk of a pullback and the opportunity to position for put warrants in the 31-32 yuan range, highly consistent with the current trend.
Interactive Question:
Do you think Xiaomi’s stock will first test the support level at 30.6 yuan, or consolidate around the 31-yuan level before rebounding to challenge the resistance at 34.3 yuan?
Reminder: This article does not constitute any investment advice.
This article is for reference only and does not constitute any investment advice. Market data, opinions, and analyses contained herein may change at any time without prior notice. We are not responsible for any losses or damages caused by reliance on the information in this article. Technical analysis only indicates whether certain technical conditions are met and should be used alongside other data for a comprehensive assessment of asset performance; trading decisions should not be made solely based on this article. Note that past performance is not indicative of future results. Follow Jenny’s HK warrants for more professional insights.
#XiaomiGroup #01810 #HKStockAnalysis #TechnicalAnalysis #SupportResistanceLevels #WarrantStrategies #BullBearContractStrategy #StreetPositionDistribution #ShareRepurchase #HKWarrantsJenny
Risk Disclaimer: The above content only represents the author's view. It does not represent any position or investment advice of Futu. Futu makes no representation or warranty.Read more
Comments
to post a comment
14