
Support levels step-by-step: If the Hong Kong Exchange falls below HKD 402, can it hold at the next support level of HKD 393?
The Hong Kong Exchange (00388) has recently shown a fluctuating and weakening price trend, closing at HKD 409.4 on March 3, 2026, with a slight drop of 0.39%, and a turnover reaching HKD 1.973 billion. From a technical perspective, since retreating from its high of HKD 460.2 in January this year, the stock has been in an adjustment channel, recently testing support at the 400-point level. Today’s (March 4) share price is at HKD 404.
Technical Analysis and Support/Resistance Levels
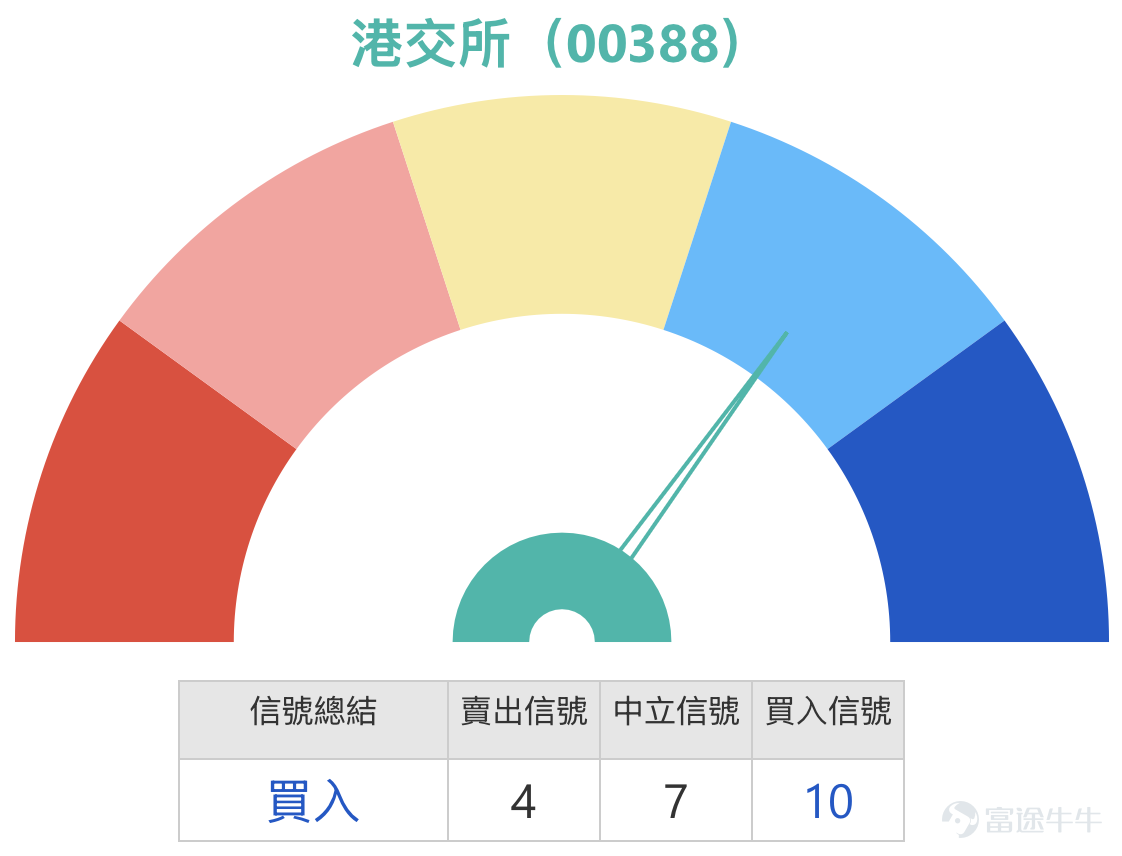
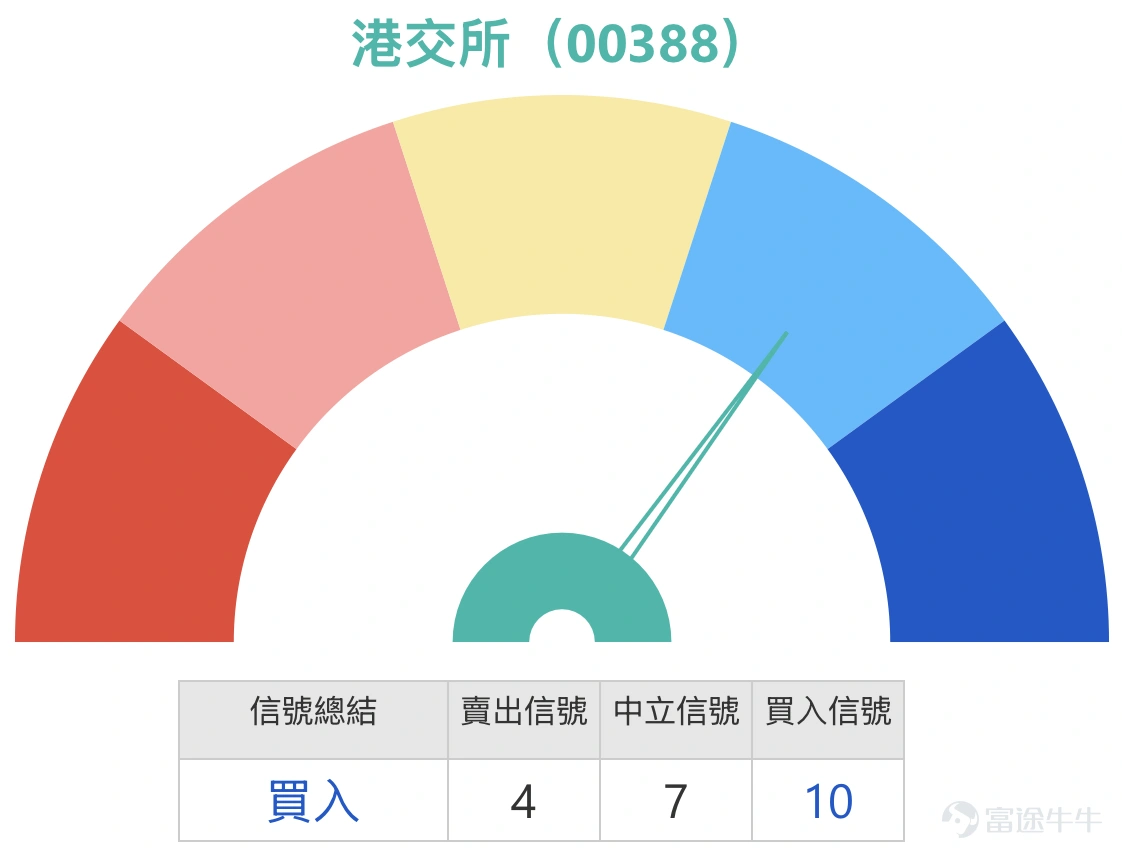
Based on a comprehensive analysis of technical indicators, the Hong Kong Exchange is currently within a range where ‘buy’ signals slightly outweigh others, with a signal strength of 10, leaning towards a neutral zone. Several oscillation indicators show balanced bullish and bearish forces: RSI stands at 46, which is a neutral level; the Williams %R, Stochastic Oscillator, and CCI indicators all emit neutral signals. Notably, the bull-bear power indicator shows a buy signal, while the rate-of-change indicator suggests a sell signal, indicating some divergence among technical indicators.
In terms of key technical levels, the short-term support for the Hong Kong Exchange is at HKD 402, which coincides with the bottom of the Bollinger Bands on the daily chart. If this level fails to hold, the next support will be tested at HKD 393. On the resistance side, the immediate short-term resistance is at HKD 422, and if broken, the target above would be HKD 442. The closing price on March 3 of HKD 409.4 has dropped below the 10-day moving average (HKD 412.02) and the 30-day moving average (HKD 420.61), but remains above the 60-day moving average (HKD 416.60), showing a weak short-term trend but not yet a fully negative mid-term trend.
Combined with [Hong Kong Stock Podcast] viewpoint analysis
Reviewing Simon's analysis of the Hong Kong Exchange in the March 3 [Hong Kong Stock Podcast], when the share price closed at HKD 409, consistent with the current level. Simon pointed out that the short-term support was at HKD 402, which also corresponds to the bottom of the Bollinger Bands on the daily chart, and if it breaks below HKD 402, the next support would be tested at HKD 393. This view aligns perfectly with the current technical analysis support levels of HKD 402 and HKD 393.
Regarding the deployment of call warrants, Simon particularly reminded investors to avoid terms that are too far out-of-the-money. He pointed out that out-of-the-money products may fail to keep up with price movements in a timely manner, and if short-term products more than 10% out-of-the-money are purchased, once the market reverses, investors will find themselves in a passive situation. Based on the current price of HKD 409.4, there are call warrants on the market with strike prices ranging from HKD 418-419, expiring relatively later (in June), making them slightly out-of-the-money choices. Meanwhile, products with a strike price of HKD 460 will expire at the end of May, qualifying as short-term out-of-the-money products with higher risk. Simon suggests prioritizing products closer to being at-the-money with longer expiration dates, which, despite offering lower leverage, provide stronger downside protection. This advice aligns with the resistance levels of HKD 422 and HKD 442 identified in the current technical analysis, and investors can refer to these key levels when choosing suitable warrant terms.
Market News and Capital Movements
The Hong Kong Exchange has seen mixed bullish and bearish news flow recently. On the positive side, HSBC Global Research issued a report reiterating its "Buy" rating for the Hong Kong Exchange, maintaining the target price at HKD 520. The report noted that following better-than-expected Q4 2025 results, the Hong Kong Exchange is well-positioned to benefit from positive wealth effects and expansion demands from mainland China enterprises. Additionally, the Hong Kong Exchange will distribute a second interim dividend of HKD 6.52 per share on March 25, providing stable cash returns for shareholders.
Review of Warrant Products
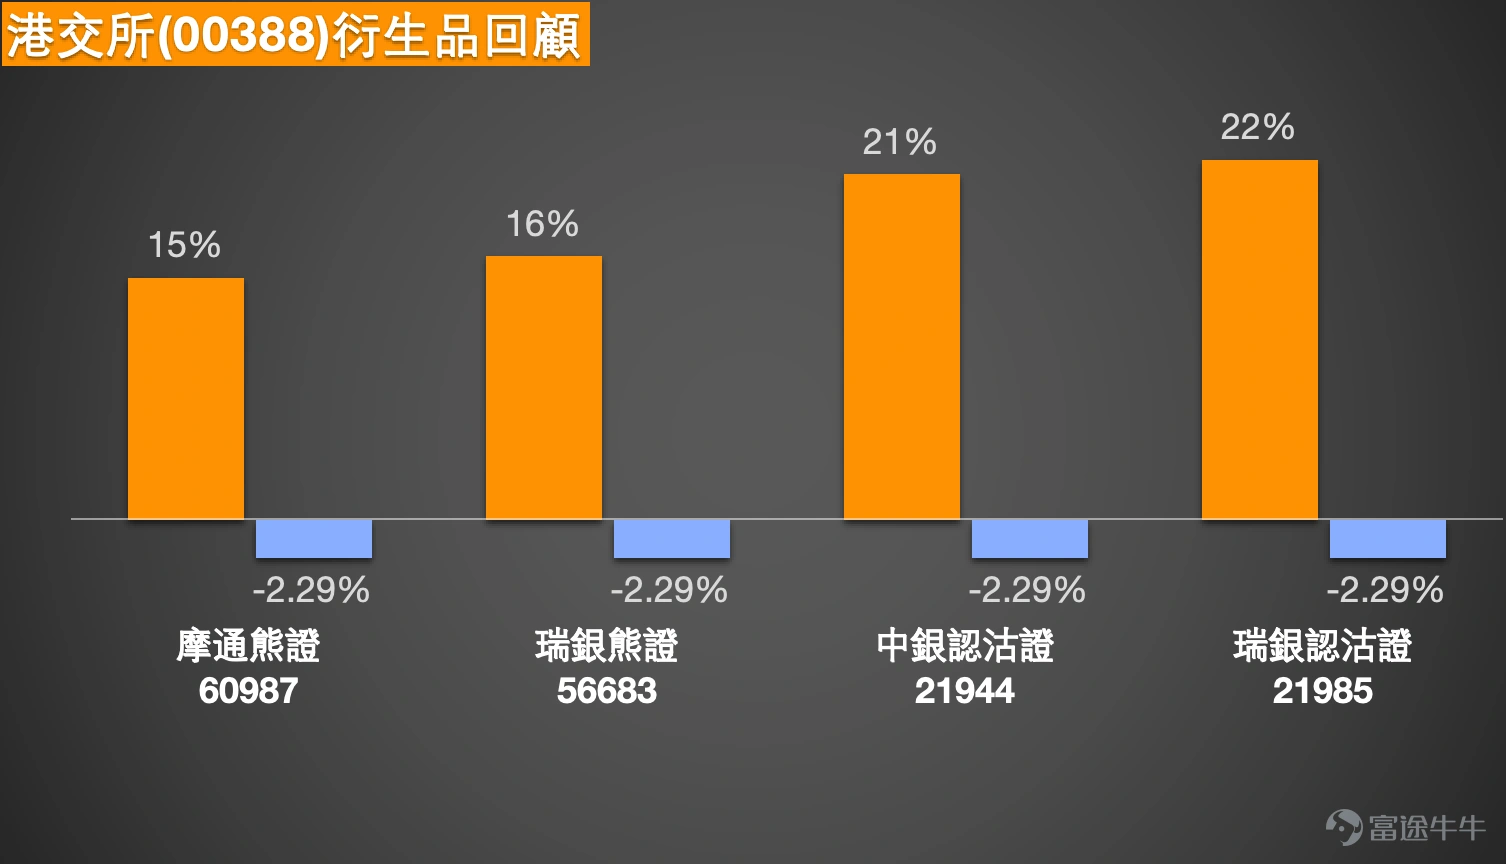
Looking back at the Hong Kong Exchange's warrant products mentioned on February 27, their performance over the following two days confirmed the appeal of bearish products. UBS Group's put warrant (21985) recorded a 22% increase over those two days, while the underlying stock fell by 2.29%; BOC’s put warrant (21944) gained 21%; UBS Group's bear contract (56683) rose by 16%; and J.P. Morgan’s bear contract (60987) increased by 15%. This reflects that during periods of underlying stock pullbacks, put warrants and bear contracts can serve as effective hedging tools for investors, even creating profit opportunities.
Warrant Product Recommendations and Terms Analysis
For investors optimistic about a rebound in the Hong Kong Exchange, they can consider the following two call warrants. HSBC's call warrant (23458) has a strike price of HKD 464.19, offering 13.1 times leverage with relatively low premium, making it suitable for investors looking to amplify gains from the underlying stock. The strike price of HKD 464.19 is above the current price of HKD 409.4, categorizing it as an out-of-the-money product. If the underlying stock breaks through the short-term resistance level of HKD 422 and moves towards HKD 442, this warrant will gradually move into the money, potentially delivering significant returns. BOC's call warrant (23431) $BI-HKEX@EC2605A.C (23431.HK)$ Also features a strike price of HKD 464.19, offering 13.5 times leverage. Its standout feature is that both its premium and implied volatility are the lowest among similar products, meaning investors incur lower time costs, leading to better cost efficiency, aligning with Simon's recommendation principle of 'comparing premiums and implied volatilities'.
For investors bearish on the Hong Kong Exchange, the following two put warrants can be considered. UBS Group's put warrant (21985) $UB-HKEX@EP2606A.P (21985.HK)$ Has a strike price of HKD 359.8, offering 10.5 times leverage with relatively low premium, making it suitable for capturing short-term pullback opportunities. The strike price of HKD 359.8 is below the current price of HKD 409.4, classifying it as an out-of-the-money put warrant. If the stock price falls below the support level of HKD 402 and further tests HKD 393, this warrant's performance will stand out. BOC’s put warrant (21944) with a strike price of HKD 359.8 also offers 10.7 times leverage with relatively low premium, featuring similar terms to UBS Group's put warrant. For investors expecting the stock price to gradually test the HKD 390 mark, this warrant represents a more conservative choice.

Bull/Bear Certificate Recommendations and Terms Analysis
Investors bullish on the Hong Kong Exchange can pay attention to the following two bull contracts. J.P. Morgan’s bull contract (57624) $JP#HKEX RC2805E.C (57624.HK)$ Features a recovery price of HKD 388, providing 19.5 times actual leverage, high actual leverage, low premium, and outstanding cost efficiency. The recovery price of HKD 388 is below the short-term support level of HKD 402 and the next support level of HKD 393, offering a buffer zone of approximately HKD 21.4, showing good defensive characteristics, suitable for investors adopting a buy-on-dips strategy. Société Générale’s bull contract (59084) has a recovery price of HKD 386, offering 18.2 times leverage, with the lowest premium among similar products, high actual leverage, suitable for more aggressive investors. The recovery price of HKD 386 is also below the support levels, with a buffer space of approximately HKD 23.4, providing stronger defense against underlying stock movements, and investors should closely monitor the defensive strength around the HKD 402 level.
Investors bearish on the Hong Kong Exchange can consider the following two bear contracts. J.P. Morgan’s bear contract (68170) $JP#HKEX RP2812A.P (68170.HK)$The recovery price is HK$458, offering an actual leverage of 7.4 times, which is relatively high and suitable for investors seeking high returns. The recovery price of HK$458 is higher than the resistance levels at HK$422 and HK$442, but lower than the year's high of HK$460.2, providing a buffer zone of approximately HK$48.6 and showing strong defensive characteristics. UBS bear certificate (67346) has a recovery price of HK$450, providing 9.1 times actual leverage with the lowest premium among similar products, demonstrating high cost-effectiveness. The recovery price of HK$450 is also above the resistance level, with a buffer zone of about HK$40.6, making it appropriate for investors with moderate risk preference.
Summary and Interactive Questions
In summary, the Hong Kong Exchange’s short-term upward movement is constrained by the HK$420 mark, leading to pullbacks. Technical indicators remain neutral, with key support levels at HK$402 and HK$393 acting as crucial defensive zones. Market news presents mixed signals: on one hand, a robust IPO market and positive outlooks from major banks offer long-term benefits; on the other, weak peripheral market conditions limit short-term performance. Simon’s analysis on March 3rd highlighted the importance of the HK$402 support level and the control of out-of-price ranges, consistent with current technical analysis. Investors should closely monitor the HK$402 support and HK$422 resistance levels for entry and exit references. Bulls may consider bullish certificates with recovery prices between HK$386-388 or call warrants with a strike price of HK$464; bears could look at bearish certificates with recovery prices between HK$450-458 or put warrants with a strike price of HK$359.
Interactive Questions:
1. Do you think that in this pullback, the Hong Kong Exchange’s share price will first test the HK$402 support level, or consolidate around the HK$410 level before challenging the HK$422 resistance?
2. If you are optimistic about the Hong Kong Exchange benefiting from a thriving IPO market to rebound, would you choose a bullish certificate with a recovery price of HK$388 (e.g., JPMorgan 57624) for a stable setup, or a call warrant with a strike price of HK$464 (e.g., Bank of China 23431) for higher leverage? Feel free to leave your comments and share your thoughts!
Reminder: This article does not constitute any investment advice.
This article is for reference only and does not constitute any investment advice. The market data, opinions, and analysis contained herein may change at any time without prior notice. We are not responsible for any loss or damage caused by reliance on the information in this article. Technical analysis only shows whether certain technical conditions are met; a comprehensive assessment of asset performance should combine other data and should not solely rely on this article to make trading decisions. Please note that past performance is not indicative of future results. Follow Jenny's insights on Hong Kong stock warrants for more professional analysis.
#Hong Kong Stock Exchange #00388 #Hong Kong Stock Analysis #Technical Analysis #Support and Resistance Levels #Warrants Deployment #Bull and Bear Certificate Strategy #IPO #Dividend #Hong Kong Stock Warrants Jenny
Risk Disclaimer: The above content only represents the author's view. It does not represent any position or investment advice of Futu. Futu makes no representation or warranty.Read more

Comments
to post a comment
4
12