
Bull certificates heavily defend the HK$130 level: If HSBC holds above HK$134.8, where is the rebound target?
HSBC Holdings (00005) has recently shown a pattern of pulling back after an upward surge. As of March 3, 2026, it closed at HK$136.9, down 2%, with a trading volume of HK$2.227 billion. From a technical perspective, the stock had been oscillating upwards from the HK$120 level since the beginning of the year and touched a high of HK$148 at the end of February. However, it has recently experienced a pullback due to external factors.
Technical Analysis and Support/Resistance Levels
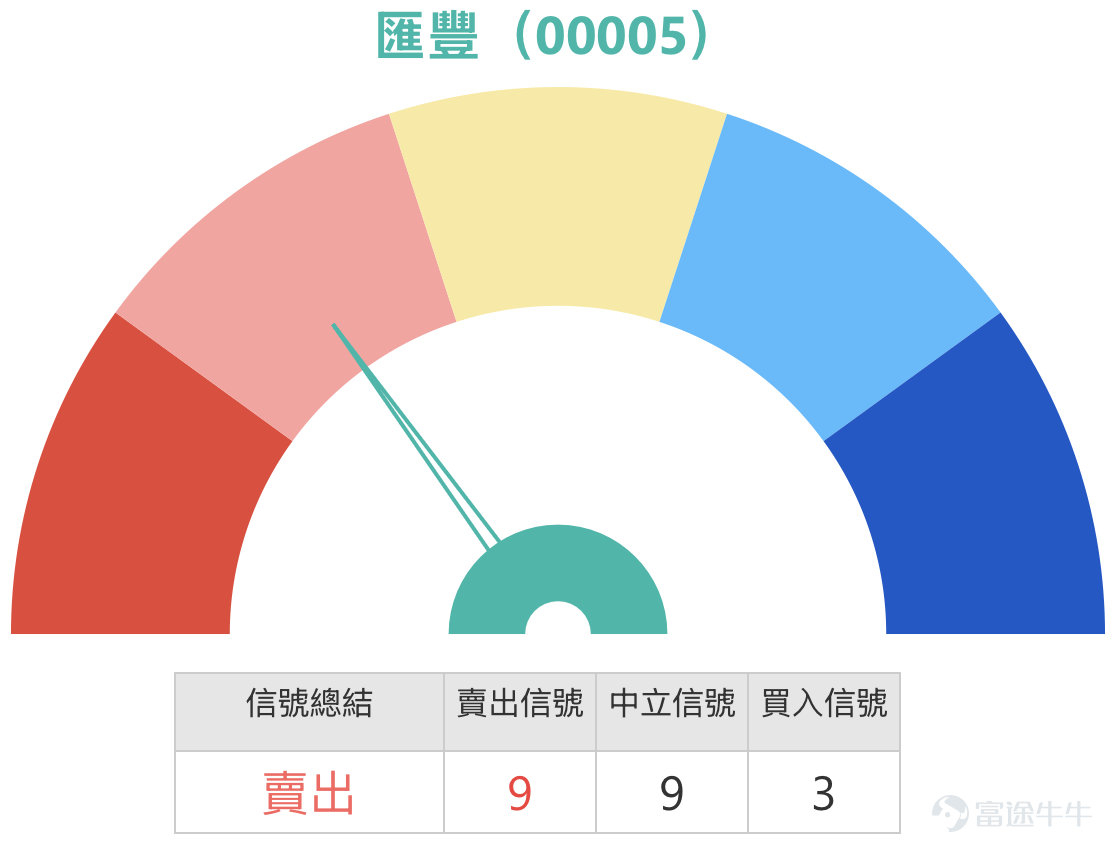
Based on a comprehensive analysis of technical indicators, HSBC is currently in a zone with a stronger 'sell' signal, with a signal strength of 9, leaning towards a neutral region. Various oscillation indicators show balanced bullish and bearish forces: RSI stands at 56, which is within the neutral range. In terms of key technical levels, HSBC's short-term support is at HK$134.8; if this level is breached, the next support will be tested at HK$129.7. On the resistance side, the immediate short-term resistance is at HK$144.4, and if broken, the upside target could reach HK$148.3. Notably, the closing price on March 3 was HK$139, still above several major moving averages including the 10-day MA (HK$138.91), 30-day MA (HK$136.1), and 60-day MA (HK$127.86), indicating that the medium-term trend has not weakened.
![HSBC Holdings (00005) has recently shown a pattern of pulling back after an upward surge. As of March 3, 2026, it closed at HK$136.9, down 2%, with a trading volume of HK$2.227 billion. From a technical perspective, the stock had been oscillating upwards from the HK$120 level since the beginning of the year and touched a high of HK$148 at the end of February. However, it has recently experienced a pullback due to external factors. Technical Analysis and Support/Resistance Levels Based on a comprehensive analysis of technical indicators, HSBC is currently in a zone with a stronger 'sell' signal, with a signal strength of 9, leaning towards a neutral region. Various oscillation indicators show balanced bullish and bearish forces: RSI stands at 56, which is within the neutral range. In terms of key technical levels, HSBC's short-term support is at HK$134.8; if this level is breached, the next support will be tested at HK$129.7. On the resistance side, the immediate short-term resistance is at HK$144.4, and if broken, the upside target could reach HK$148.3. Notably, the closing price on March 3 was HK$139, still above several major moving averages including the 10-day MA (HK$138.91), 30-day MA (HK$136.1), and 60-day MA (HK$127.86), indicating that the medium-term trend has not weakened. Combined with [Hong Kong Stock Podcast] viewpoint analysis [Share Link: February 26 [Hong Kong Stock Podcast] Hang Seng Index, Tencent, HSBC, Li Ning, NetEase, AIA] Reviewing Simon’s analysis of HSBC in the February 26 [Hong Kong Stock Podcast], when the share price surged intraday to HK$148, compared to the current level of HK$13...](https://nnqimage.futunn.com/sns_client_feed/1162342/20260303/web-1772521589701-5qXqM73luP.png/big?area=1&is_public=true&imageMogr2/ignore-error/1/format/webp)
Combined with [Hong Kong Stock Podcast] viewpoint analysis
Reviewing Simon’s analysis of HSBC in the February 26 [Hong Kong Stock Podcast], when the share price surged intraday to HK$148, there has been a noticeable pullback compared to the current level of HK$139. Simon pointed out that HSBC maintains an upward trend, with direct resistance at HK$150. If it breaks through, the next resistance will be HK$154.3. Compared to the current technical analysis resistance levels of HK$144.4 and HK$148.3, the HK$150 mark remains a key psychological resistance for the market.
Regarding the deployment of call warrants, Simon particularly reminded investors against buying products too far out-of-the-money. The higher the leverage with greater out-of-the-money levels, the greater the corresponding risk, which may not result in a higher success rate. He recommended paying attention to products with smaller out-of-the-money levels, such as call warrants with a strike price around HK$148 or within HK$159 (out-of-the-money by less than 10%), mostly expiring in November or December this year. He emphasized that besides leverage, one should also consider differences in implied volatility and premium, comparing terms to select more favorable products. Compared to the current price of HK$139, the HK$148 strike price mentioned by Simon is about 6.5% in-the-money, while HK$159 is about 14.4% out-of-the-money, allowing investors to make choices based on their risk tolerance.
Observation of the street-level warrant distribution
From the bull and bear certificate street-level distribution chart of HSBC Holdings on March 2, combined with the day's closing price of HK$139.7, the distribution pattern of long and short funds is very clear. These changes on the charts are of significant reference value for judging the current price trend.
First, the layout between bearish and bullish certificates shows a 'price range dislocation.' The bear certificates are entirely concentrated above the closing price in the HK$150-174.9 range, with the HK$160-164.9 range being the core dense area, totaling 207 contracts. Meanwhile, the bull certificates are all distributed below the closing price in the HK$80-134.9 range, forming a clear layered layout of 'bear certificates above, bull certificates below,' with no street-level positions recorded in the HK$135-149.9 range near the closing price. This means that the current price of HK$139 is in a 'vacuum zone' for long and short positions, where resistance for upward or downward movements is relatively low.
Second, there is a significant difference in the size of positions within the core dense areas. For bull certificates, the range of HK$100-104.9 has the highest street-level volume at 386 contracts, followed by the range of HK$130-134.9 with 257 contracts, creating two distinct dense zones for bull certificates, closely related to technical support levels at HK$134.8 and HK$129.7. As for bear certificates, the range of HK$160-164.9, with 207 contracts, is the core point for bearish fund deployment, surpassing Simon’s mentioned resistance level of HK$150 and next target at HK$154.3.
Third, the dynamics of capital inflows and outflows show a divergence of 'increased positions for bull certificates, decreased positions for bear certificates.' All bear certificate ranges with data variations recorded a reduction in street-level volumes, with the three core ranges of HK$160-164.9, HK$150-154.9, and HK$155-159.9 decreasing by 32, 24, and 21 contracts respectively, indicating that bearish funds are taking profits or cutting losses. Bull certificates, however, showed an increase in positions, especially in the range of HK$130-134.9, which saw a substantial rise of 130 contracts, while the range of HK$120-124.9 increased by 33 contracts, reflecting active capital deployment at lower levels, corresponding to technical support levels.
Review of Warrant Products
Reviewing the HSBC warrant products mentioned on February 26, their performance over the following two days confirmed the appeal of bearish products. BOC Put Warrant (25733) $BI-HSBC@EP2607B.P (25733.HK)$ Recorded a 31% increase over the two days after it was mentioned, while the underlying stock fell by 3.66% during the same period; UBS Put Warrant (25460) $UB-HSBC@EP2607B.P (25460.HK)$ Recorded a 25% increase; UBS Bear Certificate (62200) $UB#HSBC RP2802B.P (62200.HK)$ Recorded a 20% increase; UBS Bear Certificate (59913) recorded a 21% increase.
![HSBC Holdings (00005) has recently shown a pattern of pulling back after an upward surge. As of March 3, 2026, it closed at HK$136.9, down 2%, with a trading volume of HK$2.227 billion. From a technical perspective, the stock had been oscillating upwards from the HK$120 level since the beginning of the year and touched a high of HK$148 at the end of February. However, it has recently experienced a pullback due to external factors. Technical Analysis and Support/Resistance Levels Based on a comprehensive analysis of technical indicators, HSBC is currently in a zone with a stronger 'sell' signal, with a signal strength of 9, leaning towards a neutral region. Various oscillation indicators show balanced bullish and bearish forces: RSI stands at 56, which is within the neutral range. In terms of key technical levels, HSBC's short-term support is at HK$134.8; if this level is breached, the next support will be tested at HK$129.7. On the resistance side, the immediate short-term resistance is at HK$144.4, and if broken, the upside target could reach HK$148.3. Notably, the closing price on March 3 was HK$139, still above several major moving averages including the 10-day MA (HK$138.91), 30-day MA (HK$136.1), and 60-day MA (HK$127.86), indicating that the medium-term trend has not weakened. Combined with [Hong Kong Stock Podcast] viewpoint analysis [Share Link: February 26 [Hong Kong Stock Podcast] Hang Seng Index, Tencent, HSBC, Li Ning, NetEase, AIA] Reviewing Simon’s analysis of HSBC in the February 26 [Hong Kong Stock Podcast], when the share price surged intraday to HK$148, compared to the current level of HK$13...](https://nnqimage.futunn.com/sns_client_feed/1162342/20260303/web-1772521651268-7vukHD52EZ.png/big?area=1&is_public=true&imageMogr2/ignore-error/1/format/webp)
Warrant Product Recommendations and Terms Analysis
For investors optimistic about HSBC’s future rebound, the following two call warrants can be considered. UBS Call Warrant (26079) $UB-HSBC@EC2612A.C (26079.HK)$ With an exercise price of HK$160.76, offering 7.1 times leverage, which is ideal for both leverage and implied volatility, suitable for investors looking to amplify gains from the underlying stock. The exercise price of HK$160.76 is higher than the current price of HK$139, making it an out-of-the-money product. If the underlying stock can break through the short-term resistance level of HK$144.4 and further advance toward the HK$148.3 and HK$150 levels, this warrant will gradually move into the in-the-money state, potentially delivering significant returns. BOC Call Warrant (24909) $BI-HSBC@EC2608A.C (24909.HK)$The strike price is HKD 163.1, offering 10.1x leverage. The key feature is that both the premium and implied volatility are the lowest among similar products, meaning investors incur lower time costs and enjoy better cost efficiency, aligning with Simon's principle of 'comparing premiums and implied volatilities.'
For investors bearish on HSBC’s future performance, the following two put warrants can be considered: BOC Put Warrant (24062).$BI-HSBC@EP2609A.P (24062.HK)$The strike price is HKD 111.98, providing 6.8x leverage with relatively low implied volatility, making it suitable for capturing short-term pullback opportunities. The strike price of HKD 111.98 is below the current price of HKD 139, categorizing this as an out-of-the-money put warrant. If the stock price breaks below the support level at HKD 134.8 and further tests HKD 129.7, the performance of this warrant will stand out. UBS Put Warrant (23923) has a strike price of HKD 111.78, also offering 6.8x leverage with relatively low implied volatility, and its terms are similar to those of the BOC Put Warrant. If investors expect the stock price to gradually test the HKD 130 mark, this warrant would be a more prudent choice.
![HSBC Holdings (00005) has recently shown a pattern of pulling back after an upward surge. As of March 3, 2026, it closed at HK$136.9, down 2%, with a trading volume of HK$2.227 billion. From a technical perspective, the stock had been oscillating upwards from the HK$120 level since the beginning of the year and touched a high of HK$148 at the end of February. However, it has recently experienced a pullback due to external factors. Technical Analysis and Support/Resistance Levels Based on a comprehensive analysis of technical indicators, HSBC is currently in a zone with a stronger 'sell' signal, with a signal strength of 9, leaning towards a neutral region. Various oscillation indicators show balanced bullish and bearish forces: RSI stands at 56, which is within the neutral range. In terms of key technical levels, HSBC's short-term support is at HK$134.8; if this level is breached, the next support will be tested at HK$129.7. On the resistance side, the immediate short-term resistance is at HK$144.4, and if broken, the upside target could reach HK$148.3. Notably, the closing price on March 3 was HK$139, still above several major moving averages including the 10-day MA (HK$138.91), 30-day MA (HK$136.1), and 60-day MA (HK$127.86), indicating that the medium-term trend has not weakened. Combined with [Hong Kong Stock Podcast] viewpoint analysis [Share Link: February 26 [Hong Kong Stock Podcast] Hang Seng Index, Tencent, HSBC, Li Ning, NetEase, AIA] Reviewing Simon’s analysis of HSBC in the February 26 [Hong Kong Stock Podcast], when the share price surged intraday to HK$148, compared to the current level of HK$13...](https://nnqimage.futunn.com/sns_client_feed/1162342/20260303/web-1772521689280-SC3JzrEfCC.png/big?area=1&is_public=true&imageMogr2/ignore-error/1/format/webp)
Bull/Bear Certificate Recommendations and Terms Analysis
Investors bullish on HSBC may consider the following two bull contracts: UBS Bull Contract (59995).$UB#HSBC RC2809E.C (59995.HK)$The call price is HKD 130, offering 20.4x effective leverage. With high actual leverage and low premium, it demonstrates strong cost efficiency. The call price of HKD 130 is below the short-term support level at HKD 134.8 and the street-level concentration zone between HKD 130-134.9, providing approximately HKD 9 of buffer space, showing good defensive characteristics, and is suitable for investors adopting a strategy of buying on dips. Societe Generale Bull Contract (66347) has a call price of HKD 134, providing 32.3x leverage with relatively lower premiums and higher leverage, suitable for aggressive investors. The call price of HKD 134 is slightly below the support level of HKD 134.8, with about HKD 5 of buffer space, but it places higher demands on the underlying stock’s movement, requiring investors to closely monitor the defensive strength at the HKD 134.8 mark.
Investors bearish on HSBC may consider the following two bear contracts: J.P. Morgan Bear Contract (59768) has a call price of HKD 158, offering 5.8x effective leverage, which is the highest among similar products, with relatively low premiums, making it suitable for investors seeking high returns. The call price of HKD 158 is above resistance levels at HKD 144.4 and HKD 148.3 but below the core concentration zone for bear contracts between HKD 160-164.9, providing approximately HKD 19 of buffer space, with solid defense. Macquarie Bear Contract (66931) has a call price of HKD 155, offering 6.8x effective leverage, with the lowest premium among similar products, higher actual leverage, and excellent cost efficiency. The call price of HKD 155 is also above resistance levels, with about HKD 16 of buffer space, suitable for investors with moderate risk appetite.
Summary and Interactive Questions
In summary, HSBC’s short-term rebound is constrained by resistance at HKD 150, and technical indicators suggest selling bias, though the signal strength does not reach a strong level. Market sentiment is mixed; on one hand, AI applications and business integration offer long-term positives, while on the other, global banking stocks are weighed down by credit risk concerns. Street-level data shows active accumulation in bull contracts within the HKD 130-134.9 range, while bear contracts have been reducing positions in the core concentration zone of HKD 160-164.9, reflecting a positive bias towards the market outlook. Simon’s analysis on February 26 had already highlighted the importance of the HKD 150 resistance level and controlling out-of-the-money degrees, consistent with the current technical analysis. Investors should closely watch the support level at HKD 134.8 and resistance at HKD 144.4 as reference points for entry and exit. Bulls can focus on bull contracts with call prices between HKD 130-134 or call warrants with strike prices between HKD 160-163; bears can consider bear contracts with call prices between HKD 155-158 or put warrants with a strike price of HKD 111.
Interactive Questions:
1. Do you think HSBC's current pullback will first test the support level at HKD 134.8, or consolidate around the HKD 140 level before challenging the resistance at HKD 150?
2. Street-level data shows significant accumulation in bull contracts within the HKD 130-134.9 range. If you’re optimistic about HSBC’s rebound, would you choose the bull contract with a call price of HKD 130 (e.g., UBS 59995) for a conservative setup, or the bull contract with a call price of HKD 134 (e.g., Societe Generale 66347) for higher leverage? Feel free to share your thoughts in the comments!
Friendly Reminder: This article does not constitute any investment advice.
This article is for reference only and does not constitute any investment advice. The market data, opinions, and analysis contained herein may change at any time without prior notice. We are not responsible for any loss or damage caused by reliance on the information in this article. Technical analysis only shows whether certain technical conditions are met; a comprehensive assessment of asset performance should combine other data and should not solely rely on this article to make trading decisions. Please note that past performance is not indicative of future results. Follow Jenny's insights on Hong Kong stock warrants for more professional analysis.
#HSBC Holdings #00005 #Hong Kong Stock Analysis #Technical Analysis #Support and Resistance Levels #Warrants Deployment #Bull and Bear Certificate Strategy #Street Stock Distribution #AI Applications #Hong Kong Stock Warrants Jenny
Risk Disclaimer: The above content only represents the author's view. It does not represent any position or investment advice of Futu. Futu makes no representation or warranty.Read more

Comments
to post a comment
1