
Inflation surprise heats up! US January PPI accelerates beyond expectations

Global Weekly Talk | US Inflation Pressures Weigh on Rate Cut Expectations, China's Spring Festival Consumption Shows Strong Momentum
In terms of macroeconomics
United States: January PPI exceeded expectations across the board, durable goods orders increased significantly, and inflationary pressure weighed on interest rate cut expectations
Last week, the core U.S. data points were January PPI and durable goods orders, both of which far exceeded market expectations, reflecting stubborn inflationary pressure that further dampened expectations for Federal Reserve rate cuts. January PPI rose 0.5% month-on-month and 2.9% year-on-year, while core PPI increased 0.8% month-on-month and 3.6% year-on-year.Core year-on-year reached its fastest pace since March 2025, mainly driven by soaring service costs, with a significant jump in wholesale and retail trade service profit margins.Core goods prices also rose significantly, with only energy and food prices dragging down overall goods components. Additionally, durable goods orders grew 3.1% in January, marking the largest increase since July 2024, primarily due to a surge in civilian aircraft orders (Boeing orders surged 93.9%).Core capital goods orders rose for the third consecutive month, demonstrating underlying resilience in manufacturing, but there was a mismatch between orders and deliveries.PPI exceeding expectations may push up core PCE, further complicating the Federal Reserve's monetary policy choices.
China: Spring Festival travel consumption vitality stands out, February LPR remains unchanged for the ninth consecutive month.
China's core focus is on the Spring Festival travel rush consumption and LPR quotations. The consumer market shows a clear warming trend, while monetary policy remains stable.Around the Spring Festival of 2026, the total volume of cross-regional personnel movement in society and the single-day peak both set new historical records. Travel patterns showed features of 'early return to work' and 'segmented vacations,' with outbound tourism and service consumption gaining popularity.Consumer data performed impressively, with average daily sales revenue of key retail and catering businesses growing by 8.6% year-on-year during the first four days of the Spring Festival holiday.Hainan’s offshore duty-free sales revenue increased by 15.8% year-on-year, with notable growth rates in areas like service consumption and car rentals. Regarding monetary policy, the LPR quote remained unchanged on February 24, staying at 3.0% for one year and 3.5% for over five years, marking the ninth consecutive month since June of last year without change.This is mainly due to steady macroeconomic conditions and positive development in emerging productivity sectors.In the short term, monetary policy is in an observation period and will continue to strengthen support for key areas.
In terms of the equity market
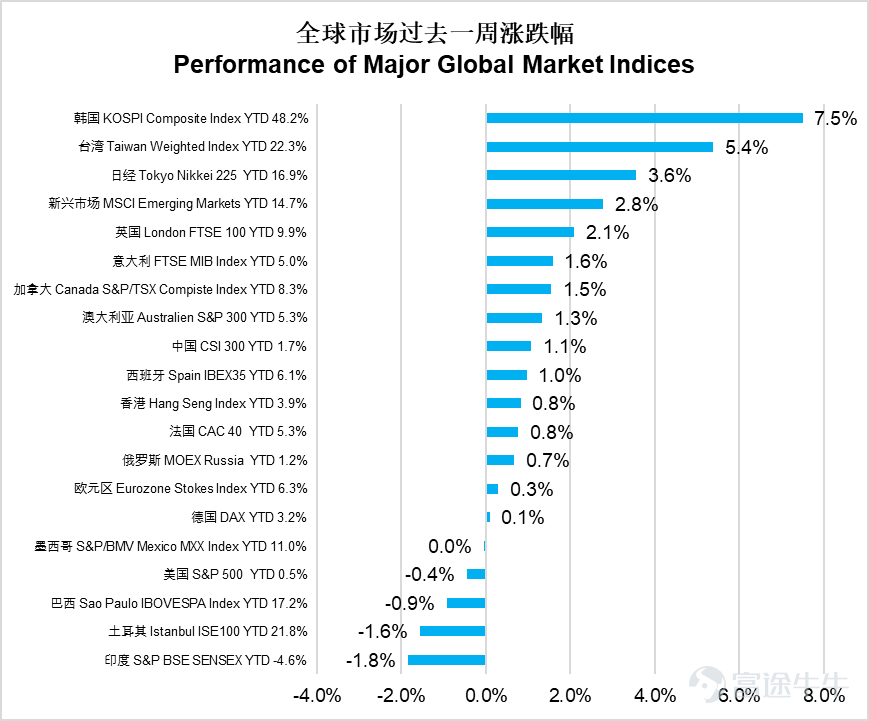
Last week, global markets showed divergent performances. South Korea's KOSPI surged 7.5%, leading globally, Taiwan's Weighted Index rose 5.4%, and Japan's Nikkei 225 climbed 3.6%.Emerging markets as a whole rose by 2.8%, and the UK's FTSE 100 increased by 2.1%. India's Sensex 30 fell by 1.8%, performing the worst; Turkey's ISE 100 dropped by 1.6%, and Brazil's IBOVESPA declined by 0.9%. The US S&P 500 slightly dipped by 0.4%, Hong Kong's Hang Seng Index rose by 0.8%, and China's CSI 300 gained 1.1%.Overall, Asian markets outperformed those in Europe and America.

Data source: Wind
The US utility sector rose 2.9%, leading performance, consumer staples increased by 2.7%, and healthcare rose by 2.1%.The energy sector gained 2.0%, materials rose 1.3%, and real estate increased by 0.7%. Communication services edged up 0.5%. However, the information technology sector fell 2.2%, financials dropped 2.0%, consumer discretionary declined 0.5%, and industrials slightly decreased by 0.1%.The market displayed a clear pattern of defensive sectors leading the gains.

Data source: Wind
In Hong Kong stocks, the raw materials sector surged 4.8%, standing out with strong performance. The finance sector rose 2.9%, while property and construction increased by 2.8%.Conglomerates climbed 2.3%, industrials grew 1.7%, telecommunications advanced 1.1%, utilities rose 0.8%, and energy gained 0.5%. However, the healthcare sector plummeted 5.0%, non-essential consumption fell 1.8%, the Hang Seng Tech Index declined 1.4%, and the information technology sector dropped 1.0%.The market showed a divergence characterized by leadership from raw materials and finance, while technology and healthcare sectors faced pressure.

Data source: Wind
In the bond market,
Global bond markets overall posted slight gains over the past week,The Global Aggregate Index rose 0.50%, the U.S. Aggregate Index gained 0.54%, U.S. investment-grade corporate bonds climbed 0.21%, and U.S. high-yield corporate bonds fell 0.22%. The Emerging Markets USD Bond Composite Index rose 0.17%, and the China USD Credit Bond Index increased by 0.42%.

In terms of interest rates, US Treasury yields have generally declined,with larger declines in the 5-10 year maturities. The 2-year US Treasury yield fell by 10 basis points from last week to 3.37%, while the 10-year US Treasury yield dropped by 15 basis points to 3.94%.

Market Outlook
– S&P 500 index constituents continue to show strong growth resilience, with a positive outlook for 2026.
As NVIDIA announces its earnings this week, the Q4 2025 earnings season for the S&P 500 index is nearing its end, with 96% of constituents having reported results.This earnings season has overall continued to demonstrate strong growth resilience, while also showing significant sector divergence. Market tolerance for earnings volatility has increased.The overall outlook for 2026 is positive. On the earnings side, index profits grew 14.2% year-over-year, marking the fifth consecutive quarter of double-digit profit growth. Revenue grew 9.4% year-over-year, the highest since Q3 2022, and marked the 21st consecutive quarter of positive growth.The overall net profit margin reached 13.3%, setting a new record since 2009.
In terms of earnings surprises, 73% of companies beat EPS estimates, and 73% exceeded revenue expectations. The proportion of companies beating revenue estimates was higher than both the 5-year and 10-year averages, but the percentage of companies beating EPS estimates fell short of historical averages, with the magnitude of beats also slightly declining. Market reactions showed clear 'imbalanced rewards and punishments': companies that positively exceeded EPS estimates saw their stock prices rise by an average of 1.2% over the two days surrounding earnings releases, higher than the 5-year average; whereas companies missing estimates experienced only a 1.3% decline, far lower than the historical average of 2.8%.This reflects the market’s significantly improved tolerance for negative earnings news.
Sector and leading company performance diverged significantly, with Information Technology leading at a 33.4% profit growth rate, followed closely by Industrials and Communication Services.The energy sector was the only one to see a year-over-year revenue decline, dragged down by a 16% drop in oil prices. The 'Magnificent Seven' of US stocks remained the core growth engine, with profits surging 27.2% year-over-year, marking the tenth time in the past 11 quarters that growth exceeded 25%. NVIDIA, Google, and Microsoft ranked among the top five contributors to index profit growth. In contrast, the earnings growth of the remaining 493 constituent stocks was only 9.8%, showing a decline from the previous quarter.
Despite the continued strong performance of the information technology sector led by NVIDIA, concerns over AI-related panic persist.This week, AI-related fears have spread to concerns about the quality of bank assets, causing a sharp drop in banking stocks. Although some leading tech companies have seen their valuations retreat to lower levels, the market is still assessing the sustainability of profitability driven by AI-related capital expenditures.Additionally, developments in the Middle Eastern geopolitical conflict in the coming weeks are expected to become the main driver of market movements. Investors should prepare for increased market volatility.
Key economic data and events this week
The US will release the February ISM Manufacturing Index on Monday.
China will release February PMI data, and the US will announce the February ISM Non-Manufacturing Index on Wednesday.
The US will release January retail sales data and February non-farm payroll data on Friday.
Disclaimer: The issuer of this report is E Fund Asset Management (Hong Kong) Co., Ltd. This report does not constitute an invitation or recommendation to invest in fund units. Investment involves risks, and fund prices can rise or fall. Past performance is not indicative of future results. Before investing, investors should carefully read the fund prospectus (including the “Risk Factors” section) to understand the investment risks associated with the fund. This report may only be distributed within certain jurisdictions. In any jurisdiction where the distribution of such information or making of any invitation or recommendation is prohibited, or if distributing this report or making an invitation or recommendation to any person would be illegal, this report does not constitute such distribution, invitation, or recommendation. This document has been exempted from prior review and approval by the Hong Kong Securities and Futures Commission (SFC), and has not been reviewed by the SFC. SFC recognition does not imply a recommendation or endorsement of the scheme, nor does it guarantee the commercial merits or performance of the scheme, nor does it represent that the scheme is suitable for all investors, or endorse its suitability for any particular investor or category of investors. All rights reserved.©️ 2026. E Fund Asset Management (Hong Kong) Co., Ltd.
Risk Disclaimer: The above content only represents the author's view. It does not represent any position or investment advice of Futu. Futu makes no representation or warranty.Read more
Comments
to post a comment
1