English
Back
Open Account
港股窩輪Jenny
wrote a column · Mar 2 09:28

[Warrant Perspective] The Tech Index is fluctuating as it searches for a bottom, with a likely range-bound trading pattern in the short term

The day saw volatile rebound movements, closing at 5,137.84 points, up slightly by 0.56% on the day, with a turnover of 71.457 billion yuan. There was significant divergence in the performance of individual stocks within the sector, with some component stocks showing relatively pressured performance towards the close, reflecting that market sentiment remains cautious. From a technical perspective, the Tech Index is still in a neutral-to-weak consolidation phase.
On February 27, $Hang Seng TECH Index (800700.HK)$ The day saw volatile rebound movements, closing at 5,137.84 points, up slightly by 0.56% on the day, with a turnover of 71.457 billion yuan. There was significant divergence in the performance of individual stocks within the sector, with some component stocks showing relatively pressured performance towards the close, reflecting that market sentiment remains cautious. From a technical perspective, the Tech Index is still in a neutral-to-weak consolidation phase. From the observation of key technical levels, initial support for the Tech Index lies around 4,814 and 4,980 points, while the primary resistance is near 5,328 points, with further resistance seen around 5,657 points. Currently, the RSI reading is 32, which is relatively low, indicating preliminary signs of recovery following oversold conditions.In terms of the moving average system, the index remains below the short-term moving averages, indicating that the technical pressure above needs to be gradually absorbed. Considering various technical indicators, current market signals show divergence: multiple oscillation-based indicators (such as the Williams %R, Stochastic Oscillator, and VR Volume Ratio) are issuing 'buy' signals, suggesting the index has entered oversold territory and meets the conditions for a technical rebound. However, trend-based indicators (such as MACD, Ichimoku Cloud, and Bollinger Bands) mostly maintain a 'sell' view, and the ADX indicator shows weak trend strength. Although the overall technical summary indicates a 'strong buy' signal with high intensity, this mainly reflects expectations of a correction after an over-correction. Overall, the Tech Index is in the process of consolidating its base through fluctuations, with a rebound...
From the observation of key technical levels, initial support for the Tech Index lies around 4,814 and 4,980 points, while the primary resistance is near 5,328 points, with further resistance seen around 5,657 points. Currently, the RSI reading is 32, which is relatively low, indicating preliminary signs of recovery following oversold conditions.In terms of the moving average system, the index remains below the short-term moving averages, indicating that the technical pressure above needs to be gradually absorbed.
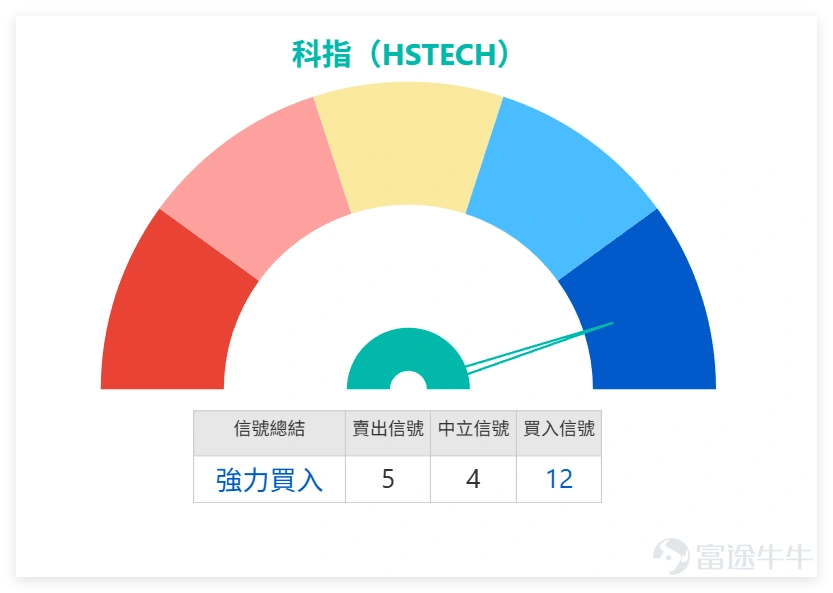
Based on a synthesis of various technical indicators, the current market signals are mixed: multiple oscillation-based indicators (such as the Williams %R, Stochastic Oscillator, and VR trading ratio) have issued 'buy' signals, suggesting that the index has entered an oversold zone with conditions ripe for a technical rebound. However, trend-based indicators (such as MACD, Ichimoku Cloud, and Bollinger Bands) mostly maintain a 'sell' perspective, and the ADX indicator shows weak trend strength. Although the overall summary of technical indicators gives a 'strong buy' signal with high intensity, this primarily reflects expectations of a correction after an excessive decline.
On February 27, $Hang Seng TECH Index (800700.HK)$ The day saw volatile rebound movements, closing at 5,137.84 points, up slightly by 0.56% on the day, with a turnover of 71.457 billion yuan. There was significant divergence in the performance of individual stocks within the sector, with some component stocks showing relatively pressured performance towards the close, reflecting that market sentiment remains cautious. From a technical perspective, the Tech Index is still in a neutral-to-weak consolidation phase. From the observation of key technical levels, initial support for the Tech Index lies around 4,814 and 4,980 points, while the primary resistance is near 5,328 points, with further resistance seen around 5,657 points. Currently, the RSI reading is 32, which is relatively low, indicating preliminary signs of recovery following oversold conditions.In terms of the moving average system, the index remains below the short-term moving averages, indicating that the technical pressure above needs to be gradually absorbed. Considering various technical indicators, current market signals show divergence: multiple oscillation-based indicators (such as the Williams %R, Stochastic Oscillator, and VR Volume Ratio) are issuing 'buy' signals, suggesting the index has entered oversold territory and meets the conditions for a technical rebound. However, trend-based indicators (such as MACD, Ichimoku Cloud, and Bollinger Bands) mostly maintain a 'sell' view, and the ADX indicator shows weak trend strength. Although the overall technical summary indicates a 'strong buy' signal with high intensity, this mainly reflects expectations of a correction after an over-correction. Overall, the Tech Index is in the process of consolidating its base through fluctuations, with a rebound...
Overall, the technology index is in the process of forming a bottom through oscillation, with moderate rebound momentum. The sustainability of future movements needs close observation of whether trading volume can effectively support it. In terms of operations, it is recommended to adopt a range-trading approach in the short term.
On Friday (27th), tech stocks generally maintained volatility, with noticeable differences in individual stock performance.
1、 $TENCENT (00700.HK)$ The stock price has stabilized above short-term moving averages, with bulls and bears temporarily in balance, and the trend is leaning towards consolidation and repair.
2、 $BABA-W (09988.HK)$ Prices surged during the session but retreated somewhat by the close, forming a long upper shadow, indicating some selling pressure at higher levels.
3、 $MEITUAN-W (03690.HK)$ A mild rebound occurred, with reasonable volume support, as the stock price attempts to reclaim moving averages, showing signs of technical oversold recovery.
4、 $JD-SW (09618.HK)$ The stock remains in a narrow range-bound movement, consolidating at lower levels, with relatively limited upward momentum in the short term.
5、 $BIDU-SW (09888.HK)$ The trend is stable and in the bottom-building phase, although there has been no significant increase in trading volume.
6、 $NTES-S (09999.HK)$ It outperformed peers, with the stock price rising above several short-term moving averages, reflecting increased investor attention.
7、 $KUAISHOU-W (01024.HK)$ The stock weakened against the broader market trend, constrained by moving average resistance, and further confirmation of lower support levels is needed.
8、 $XIAOMI-W (01810.HK)$ The price is oscillating within a low range, with moving averages converging and the direction remaining unclear for now.
9、 $TRIP.COM-S (09961.HK)$ The stock showed active performance as the price broke through short-term resistance, accompanied by an increase in trading volume; the short-term trend appears relatively positive.
10、 $BILIBILI-W (09626.HK)$ Following the broader market rebound, the stock price is fluctuating around the moving average with ongoing contention, while overhead selling pressure remains significant.
Overall, market funds are showing a preference for individual stock performances, with continued divergence in strength among sectors.
Review and Selection of Bull/Bear Warrants:
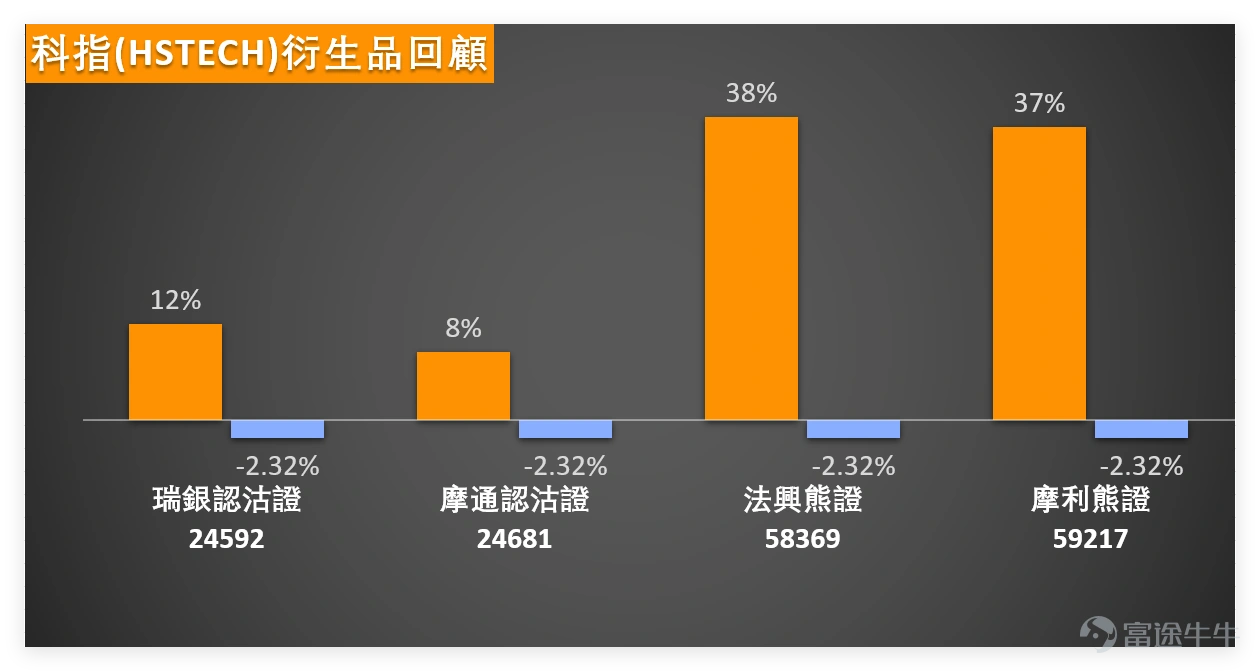
Looking back at February 23, 2026, bearish products and put warrants related to the technology index performed notably. Among them, $SG#HSTECRP2812B.P (58369.HK)$ and $MS#HSTECRP2812D.P (59217.HK)$ the gains reached 38% and 37% respectively over the following two trading days, $JPHSTEC@EP2609A.P (24681.HK)$ and $UBHSTEC@EP2609A.P (24592.HK)$ warrants also tracked the underlying stock's volatility, recording corresponding returns, once again demonstrating the high correlation between derivatives and the underlying stock's movements.
On February 27, $Hang Seng TECH Index (800700.HK)$ The day saw volatile rebound movements, closing at 5,137.84 points, up slightly by 0.56% on the day, with a turnover of 71.457 billion yuan. There was significant divergence in the performance of individual stocks within the sector, with some component stocks showing relatively pressured performance towards the close, reflecting that market sentiment remains cautious. From a technical perspective, the Tech Index is still in a neutral-to-weak consolidation phase. From the observation of key technical levels, initial support for the Tech Index lies around 4,814 and 4,980 points, while the primary resistance is near 5,328 points, with further resistance seen around 5,657 points. Currently, the RSI reading is 32, which is relatively low, indicating preliminary signs of recovery following oversold conditions.In terms of the moving average system, the index remains below the short-term moving averages, indicating that the technical pressure above needs to be gradually absorbed. Considering various technical indicators, current market signals show divergence: multiple oscillation-based indicators (such as the Williams %R, Stochastic Oscillator, and VR Volume Ratio) are issuing 'buy' signals, suggesting the index has entered oversold territory and meets the conditions for a technical rebound. However, trend-based indicators (such as MACD, Ichimoku Cloud, and Bollinger Bands) mostly maintain a 'sell' view, and the ADX indicator shows weak trend strength. Although the overall technical summary indicates a 'strong buy' signal with high intensity, this mainly reflects expectations of a correction after an over-correction. Overall, the Tech Index is in the process of consolidating its base through fluctuations, with a rebound...
Friendly reminder: Investors should closely monitor time decay, implied volatility changes, and specific risks associated with derivative products when trading them.
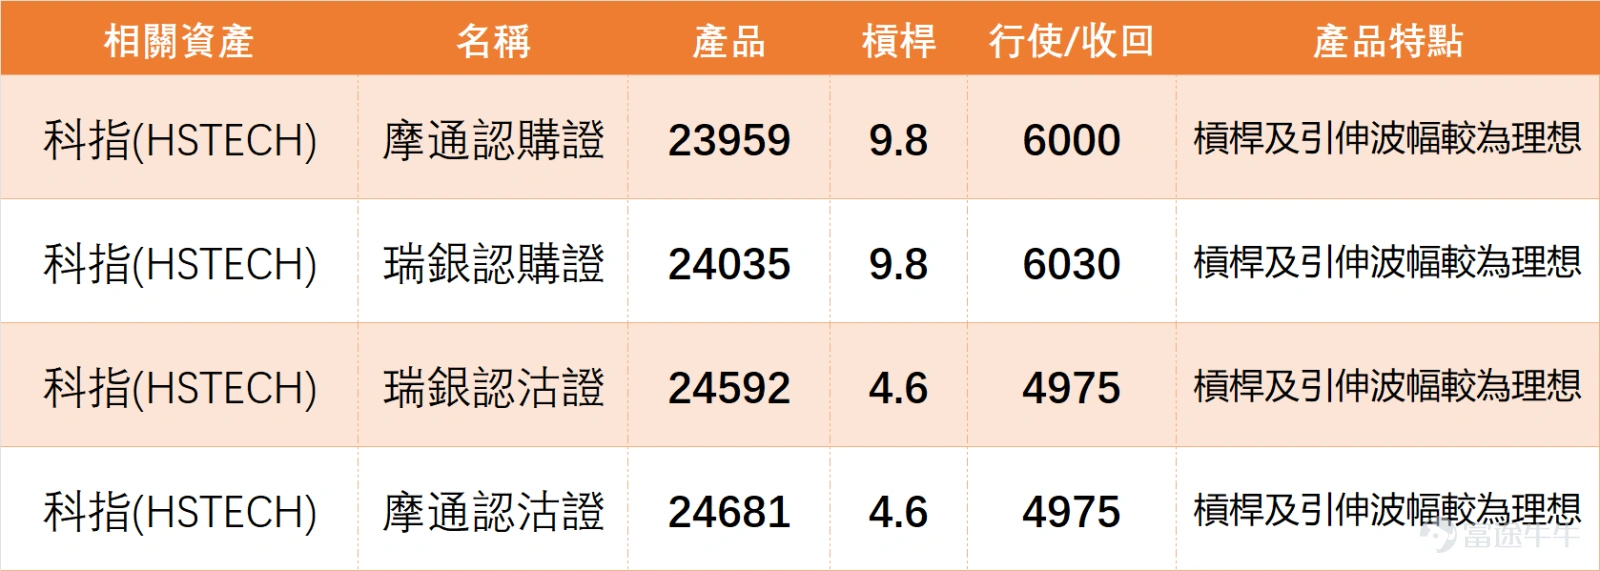
Based on the current market situation, two selected technology index-related products are provided for reference:
1、 $JPHSTEC@EC2606A.C (23959.HK)$ With a strike price of 6000 points, the actual leverage is approximately 9.8 times, offering an ideal combination of leverage level and implied volatility structure.
2、 $UBHSTEC@EC2606A.C (24035.HK)$Strike price at 6030 points, with an actual leverage of approximately 9.8 times; the product terms are suitable for investors inclined to bet on a rebound within a range.
Risk Warning: Derivatives are extremely volatile, and investors must strictly control their positions when allocating assets.
On February 27, $Hang Seng TECH Index (800700.HK)$ The day saw volatile rebound movements, closing at 5,137.84 points, up slightly by 0.56% on the day, with a turnover of 71.457 billion yuan. There was significant divergence in the performance of individual stocks within the sector, with some component stocks showing relatively pressured performance towards the close, reflecting that market sentiment remains cautious. From a technical perspective, the Tech Index is still in a neutral-to-weak consolidation phase. From the observation of key technical levels, initial support for the Tech Index lies around 4,814 and 4,980 points, while the primary resistance is near 5,328 points, with further resistance seen around 5,657 points. Currently, the RSI reading is 32, which is relatively low, indicating preliminary signs of recovery following oversold conditions.In terms of the moving average system, the index remains below the short-term moving averages, indicating that the technical pressure above needs to be gradually absorbed. Considering various technical indicators, current market signals show divergence: multiple oscillation-based indicators (such as the Williams %R, Stochastic Oscillator, and VR Volume Ratio) are issuing 'buy' signals, suggesting the index has entered oversold territory and meets the conditions for a technical rebound. However, trend-based indicators (such as MACD, Ichimoku Cloud, and Bollinger Bands) mostly maintain a 'sell' view, and the ADX indicator shows weak trend strength. Although the overall technical summary indicates a 'strong buy' signal with high intensity, this mainly reflects expectations of a correction after an over-correction. Overall, the Tech Index is in the process of consolidating its base through fluctuations, with a rebound...
Do you think the technology index, given its current technical setup, will first rise to challenge resistance or initially fall back to test support?
Feel free to share your insights in the comment section. For more market analysis, please continue following ‘Hong Kong Stock Warrants Jenny’ for daily updates!
Reminder: This article does not constitute any investment advice.
This article is for reference only and does not constitute any investment advice. The market data, opinions, and analysis contained herein may change at any time without prior notice. We are not responsible for any loss or damage caused by reliance on the information in this article. Technical analysis only shows whether certain technical conditions are met; a comprehensive assessment of asset performance should be conducted using additional data. Decisions to trade should not be based solely on this article. Please note that past performance is not indicative of future results.
#HongKongStocks #RealTimeAnalysis #WarrantsSelection #WarrantsStrategy #DerivativesHedging #HongKongWarrants Jenny #TechIndex #TechStocks #TechnicalAnalysis
Risk Disclaimer: The above content only represents the author's view. It does not represent any position or investment advice of Futu. Futu makes no representation or warranty.Read more
Thumbs Up
4
Lol
1
360K Views
Report
Comments
Write a Comment...
5