
Hong Kong-listed AI 'twin leaders' see active trading! How to position in the AI sector for the Year

Pop Mart (09992) sees a rebound after three consecutive declines – is this a technical pullback or a trend reversal?
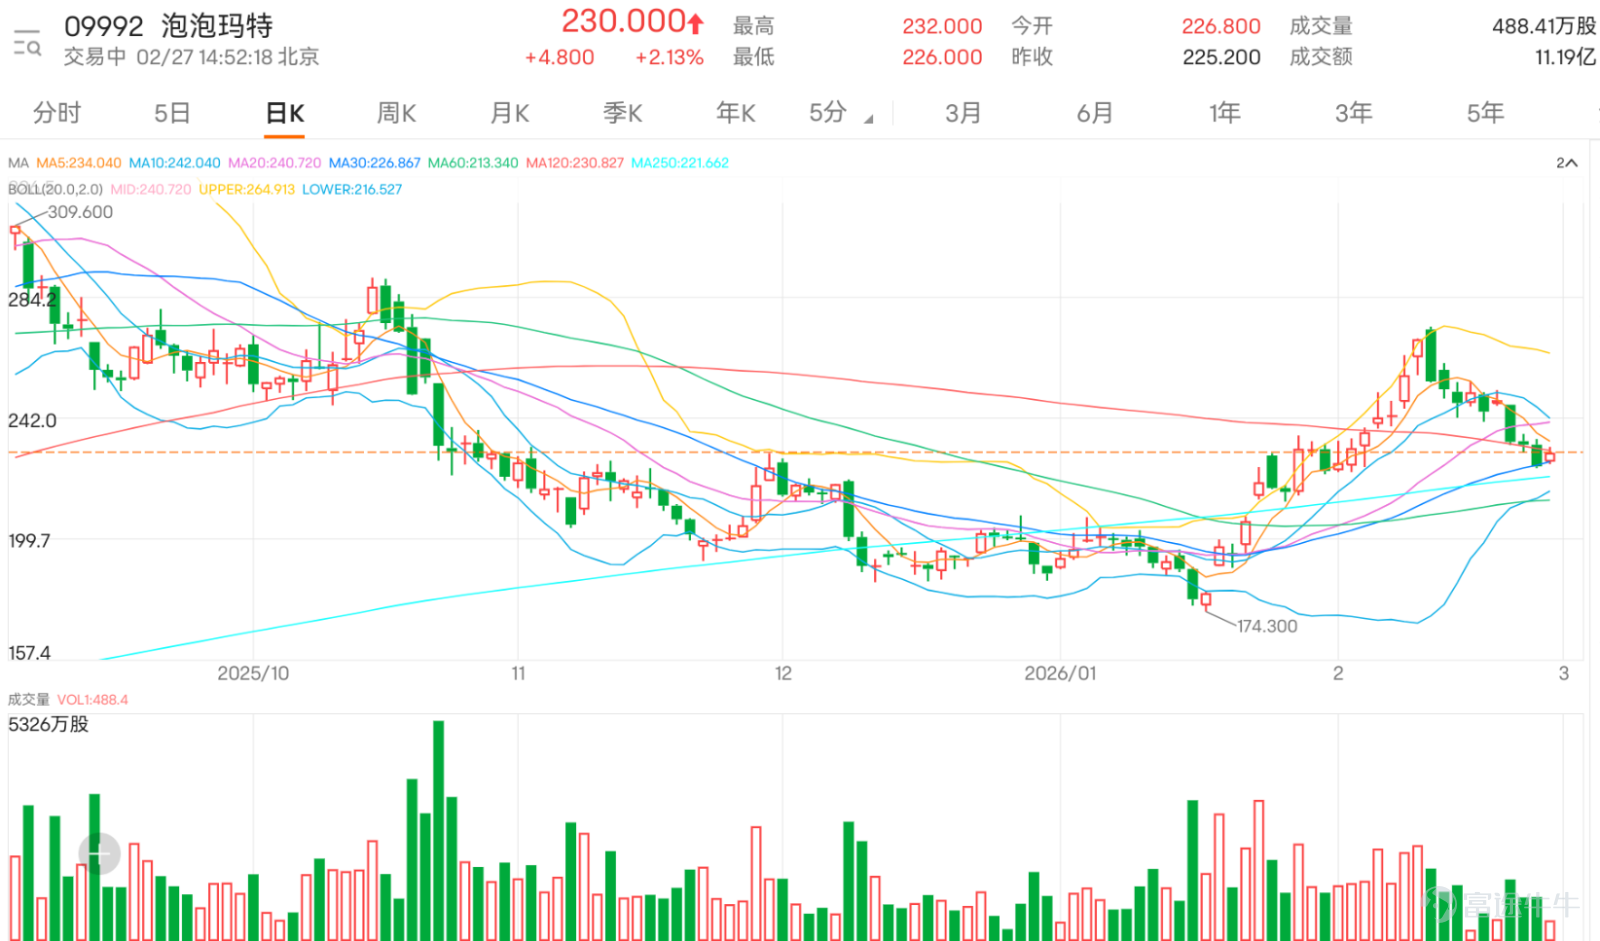
$POP MART (09992.HK)$ After experiencing a recent round of adjustments, the stock finally ended its decline today with a 2% rebound, now trading at HKD 230. However, whether this rebound can evolve into an effective upward trend still requires careful analysis from multiple technical dimensions.
Analysis of the current trend and moving average system
The stock price rebounded after hitting a recent low, but the latest price remains significantly below the 10-day moving average (242 yuan), indicating that the short-term trend is still weak. However, it is worth noting that the stock price has now recovered above the 30-day moving average (226.88 yuan), meaning that the mid-term moving average system still provides some level of support. The current pattern can be viewed as a technical rebound after the short-term downtrend found support in the mid-term support zone, but if the 10-day line cannot be quickly reclaimed, the short-term downward pressure has not been fully alleviated.
Interpretation of Key Technical Indicator Signals
Several oscillation indicators are showing preliminary turning signals worth noting. The Stochastic Oscillator (KDJ) has entered the oversold zone and issued a 'buy signal,' which usually suggests that the short-term downward momentum is waning and a rebound may be brewing. At the same time, the CCI indicator also simultaneously issued a 'buy signal,' further reinforcing the view that there is demand for a short-term rebound. However, the ADX indicator, which measures trend strength, currently shows 'neutral,' indicating that the market has not yet formed a strong one-sided trend, and the sustainability of the current rebound needs to be observed.
On the other hand, the RSI indicator is at 49 in the neutral zone, also presenting a 'neutral' signal, reflecting a temporary balance between bullish and bearish forces at this position. But the Williams %R indicator shows an 'oversold condition,' echoing the stochastic oscillator's signal, increasing the probability of short-term technical correction. It should be noted that the MACD signal remains in a 'sell' state, showing that medium-term momentum has not strengthened, possibly limiting the height and smoothness of the rebound.
Support and Resistance Levels Layout
According to technical analysis, two key support lines have been established below the stock price. The primary support is near 212 yuan, roughly coinciding with the 60-day moving average and the previous trading congestion zone, making it significant. The secondary support is at the round figure of 200 yuan, where stronger buying support is expected. On the upside, the initial resistance is at 250 yuan, close to the lower edge of the previous consolidation platform and the declining 10-day moving average. Breaking through this point would indicate a strengthening of the short-term structure. Stronger key resistance is around 261 yuan, an important checkpoint for challenging previous highs.
Summary and Operation Strategy Signal
In summary, after continuous adjustments, Pop Mart's stock price gained buying support in the mid-term moving average support zone, and multiple oscillation indicators such as the stochastic and CCI simultaneously issued oversold rebound signals, suggesting a need for short-term technical repair. However, since the stock price is still constrained by the short-term moving average (MA10) and trend indicators like MACD have not turned positive, the overall technical picture can only be defined as a 'rebound within a downtrend,' rather than a clear starting point of a trend reversal.
For professional investors, the current technical picture presents a 'cautiously optimistic on the rebound, confirm before following' stance. If the stock price can stabilize continuously above Support 1 (212 yuan) and be accompanied by corresponding trading volume, the likelihood of challenging Resistance 1 (250 yuan) will increase. However, if the rebound lacks strength and the 30-day moving average support is lost again, it will be necessary to guard against the risk of the stock price testing Support 2 (200 yuan). It is recommended to closely monitor the stock's performance near key moving averages and changes in trading volume, waiting for clearer trend signals before making any deployment.


Product Review:
Reviewing February 23, 2026, a cautious outlook on Pop Mart (09992) was held at the time. The performance of the various bearish products mentioned then showed high correlation with the stock's movement over the subsequent two trading days. After that day, Pop Mart's stock price fell by 6.28% within two trading days. Meanwhile, during the same period... $BIPOMRT@EP2604A.P (21876.HK)$ A rise of approximately 53% was recorded two days later. Similarly, for bearish products, $JPPOMRT@EP2604A.P (21762.HK)$ a rise of 41% was also recorded. As for bear certificate products with different leverage effects, $UB#POMRTRP2807N.P (58910.HK)$and$BI#POMRTRP2807A.P (59783.HK)$ they recorded increases of 35% and 33%, respectively.

Product Picks:
For investors who are optimistic about the future market and believe that stock prices can successfully bottom out and challenge resistance levels, call warrants and bull certificates are worth considering. Among these, $BIPOMRT@EC2706A.C (21869.HK)$ and $JPPOMRT@EC2706A.C (21881.HK)$ both provide an effective leverage of around 2.6 times, with the same exercise price of $270.12, maintaining a certain distance from the current price. Their implied volatility levels are relatively ideal, and the pressure of time decay is relatively mild compared to similar products, making them suitable as tools for deploying medium-term rebound strategies.
If you wish to capture short-term rebounds with lower premiums and higher leverage, $BI#POMRTRC2610A.C (61592.HK)$ this option is worth considering, with a recovery price set at $205, providing a safety buffer of about $25 from the current price, offering approximately 7.3 times higher actual leverage, and having the lowest premium among similar products, enabling it to efficiently track the rise of the underlying stock. Another choice, $UB#POMRTRC2610A.C (61316.HK)$ with a closer recovery price near $200, offers around 6.1 times leverage. Its price is relatively higher, possibly providing better liquidity.
For investors who are pessimistic about the future market and expect the rebound to lose momentum, leading to another test of support, put warrants and bear certificates can be considered. Among put warrants, $JPPOMRT@EP2605A.P (23040.HK)$ the one with the lowest premium provides around 5.6 times higher leverage, with an exercise price of $188.78, making it suitable for deploying bearish medium-term strategies. $HSPOMRT@EP2606A.P (21787.HK)$It also has a relatively low premium, with leverage of about 4.1 times, and the terms are more stable.
If seeking higher leverage and direct hedging against downside risk, bear certificates are a more aggressive choice. Among them, $HS#POMRTRP2812B.P (65829.HK)$the actual leverage is as high as approximately 7.4 times, the highest in the list, with a stop-loss level set at HKD 255, and the lowest premium, closely tracking the underlying stock’s decline. Another one, $SG#POMRTRP2812V.P (66123.HK)$also offers a high actual leverage of about 7.5 times, with a stop-loss level at HKD 253 and low premium, making it an efficient tool for capturing price resistance and subsequent pullbacks.

Pop Mart is currently seeing multiple tussles around the HKD 230 mark. As a short-term trader, would you choose to A) wait and see, B) buy the dip, or C) short on a rebound at this point? Feel free to leave your views in the comments section.
This article is for reference only and does not constitute any investment advice. The market data, opinions, and analysis contained herein may change at any time without prior notice. We assume no liability for any losses or damages resulting from reliance on the information in this article. Technical analysis only indicates whether certain technical conditions are met; asset performance should be comprehensively evaluated with additional data and should not solely rely on this article for trading decisions. Please note that past performance is not indicative of future results. Be sure to follow the "Hong Kong Stock Warrants Jenny" account for more professional analysis articles and opportunities related to Hong Kong stock derivatives investments! $Hang Seng Index (800000.HK)$$Hang Seng TECH Index (800700.HK)$
#HongKongStocks #RealTimeAnalysis #WarrantsSelection #WarrantsStrategy #DerivativesHedging #HongKongWarrantsJenny #TrendyToyLeader #TechnicalAnalysis #PopMart#09992#
Risk Disclaimer: The above content only represents the author's view. It does not represent any position or investment advice of Futu. Futu makes no representation or warranty.Read more

Comments
to post a comment
2