
Hong Kong-listed AI 'twin leaders' see active trading! How to position in the AI sector for the Year
Tencent Bull/Bear Certificate Deployment Strategy: Practical Choices Close to the Support at HKD 492 and Resistance at HKD 552
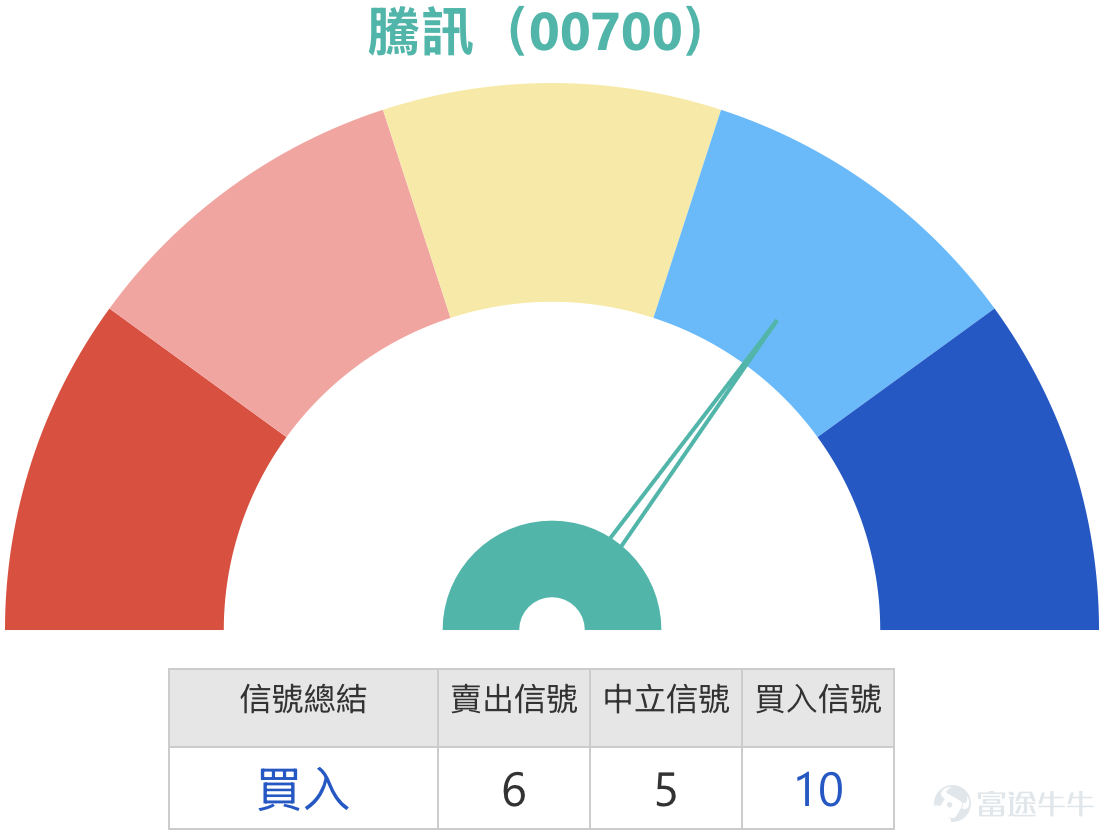
As of February 27, 2026, Tencent (00700) was trading at HKD 527, rebounding by 2.83%. However, based on the detailed technical data provided, the overall weak trend has not yet shown a clear reversal. The summary signal for technical indicators is "Buy", with strength reaching 10, mainly driven by multiple oscillation indicators triggering "oversold" signals, suggesting potential short-term technical rebound needs. Nevertheless, it’s worth noting that MA10 (HKD 529), MA30 (HKD 572.62), and MA60 (HKD 591.80) show a bearish alignment, and both MACD, Bollinger Bands, and Ichimoku Cloud indicate a "Sell" signal, reflecting continued pressure on the medium-term trend.
From a market news perspective, Tencent's recent weakness is closely related to the macro environment. Analysis from Cailian Press points out that the continuous strengthening of the US dollar has raised concerns about global liquidity tightening, leading to capital outflows from high-risk technology growth sectors, which directly pressures the Hang Seng Tech Index. Meanwhile, there are concerns in the market about fierce competition among tech giants in AI applications, worrying that a "burn money for growth" strategy may erode corporate profits in the short term. Regarding short-selling data, Tencent's short-selling volume once climbed to 6.5563 million shares in early February, the highest since August 2025. Although it has now fallen back to 1.7228 million shares, bearish forces are still present.
Combined with [Hong Kong Stocks Podcast] viewpoint: Will Tencent break below the HKD 500 mark?
In the February 26 episode of [Hong Kong Stocks Podcast], host Simon provided an in-depth analysis of Tencent. He noted that against the backdrop of a falling broader market, Tencent could not remain unscathed and continued to decline on the 26th. Simon mentioned that after entering February, Tencent’s performance had been lackluster. The daily chart from February until now clearly shows Tencent's stock price weakening continuously. After previously surging to a high of HKD 639, the overall trend has been downward. Despite some minor rebounds, today’s close was near the lowest point at HKD 512, and the overall trend remains sluggish.
Simon specifically addressed investors’ concerns: "Will Tencent fall below the HKD 500 mark?" He clearly stated that this possibility exists. Based on technical support levels, Tencent's support is estimated to be around HKD 496, which is already below the psychological level of HKD 500, so the stock price may indeed test HKD 496; if HKD 496 is broken, it may further drop to HKD 473.
Observing the warrant market, Simon noticed that many investors are buying Tencent put warrants. There is a wide variety of put warrant choices for Tencent with different terms available. However, he specifically reminded that attention should be paid to some products nearing expiry, whether expiring in February or March, and it's best to avoid them. Products expiring in May or June this year would be more appropriate. These products also offer good leverage, with some at over 7x and others around 8x, providing plenty of options. Simon emphasized that everyone should compare implied volatility and premium, as the gap between the two can be significant for some products. To choose a more favorable investment product, careful comparison of all terms is necessary. Tencent’s put warrants have abundant choices across different price ranges, but the terms vary, so when selecting, ensure you pick what’s most advantageous for you.
Support and resistance level analysis: Combining technical data and podcast insights, Tencent’s short-term support levels lie at HK$492 (support 1) and HK$506 (support 2), which align closely with the mentioned support level of HK$496; overhead resistance lies at HK$552 (resistance 1) and HK$591 (resistance 2).SimonThe mentioned support level of 496 yuan is basically aligned; the resistance above is at 552 yuan (Resistance 1) and 591 yuan (Resistance 2).
![As of February 27, 2026, Tencent (00700) was trading at HKD 527, rebounding by 2.83%. However, based on the detailed technical data provided, the overall weak trend has not yet shown a clear reversal. The summary signal for technical indicators is "Buy", with strength reaching 10, mainly driven by multiple oscillation indicators triggering "oversold" signals, suggesting potential short-term technical rebound needs. Nevertheless, it’s worth noting that MA10 (HKD 529), MA30 (HKD 572.62), and MA60 (HKD 591.80) show a bearish alignment, and both MACD, Bollinger Bands, and Ichimoku Cloud indicate a "Sell" signal, reflecting continued pressure on the medium-term trend. From a market news perspective, Tencent's recent weakness is closely related to the macro environment. Analysis from Cailian Press points out that the continuous strengthening of the US dollar has raised concerns about global liquidity tightening, leading to capital outflows from high-risk technology growth sectors, which directly pressures the Hang Seng Tech Index. Meanwhile, there are concerns in the market about fierce competition among tech giants in AI applications, worrying that a "burn money for growth" strategy may erode corporate profits in the short term. Regarding short-selling data, Tencent's short-selling volume once climbed to 6.5563 million shares in early February, the highest since August 2025. Although it has now fallen back to 1.7228 million shares, bearish forces are still present. Combined with [Hong Kong Stocks Podcast] viewpoint: Will Tencent break below the HKD 500 mark? [Share Link: February 26 [Hong Kong Stock Podcast] Hang Seng Index, Tencent, HSBC, Li Ning, NetEase, AIA] ...](https://nnqimage.futunn.com/sns_client_feed/1162342/20260227/web-1772165341791-47j8fwtdIz.png/big?area=1&is_public=true&imageMogr2/ignore-error/1/format/webp)
Review of Warrant Products: Capturing Profit Opportunities from the Downward Trend
Reviewing the warrant products mentioned on February 23rd, over the following two days (February 24th to 25th), Tencent's underlying stock fell cumulatively by 2.88%. The performance of related products confirmed Simon’s observations regarding put warrants and bear contracts:
- Societe Generale Bear Contract (59351): Achieved a two-day increase of 50%, reflecting how bearish products effectively amplify returns in a falling market.
- UBS Bear Certificate (59488)$UB#TENCTRP2812N.P (59488.HK)$: Also recorded a 50% rise, indicating the sensitivity of bear contracts to declines in the underlying stock due to their high leverage characteristics.
- UBS Put Warrant (21984)$UBTENCT@EP2606A.P (21984.HK)$: Recorded a two-day increase of 20%; put warrants directly benefited from the drop in the underlying stock, aligning with Simon’s mention of investors buying puts as a market phenomenon.
- BOC Put Warrant (23122) $BITENCT@EP2606A.P (23122.HK)$ : Also rose 20%, consistent with the performance of UBS Group's put warrants.
![As of February 27, 2026, Tencent (00700) was trading at HKD 527, rebounding by 2.83%. However, based on the detailed technical data provided, the overall weak trend has not yet shown a clear reversal. The summary signal for technical indicators is "Buy", with strength reaching 10, mainly driven by multiple oscillation indicators triggering "oversold" signals, suggesting potential short-term technical rebound needs. Nevertheless, it’s worth noting that MA10 (HKD 529), MA30 (HKD 572.62), and MA60 (HKD 591.80) show a bearish alignment, and both MACD, Bollinger Bands, and Ichimoku Cloud indicate a "Sell" signal, reflecting continued pressure on the medium-term trend. From a market news perspective, Tencent's recent weakness is closely related to the macro environment. Analysis from Cailian Press points out that the continuous strengthening of the US dollar has raised concerns about global liquidity tightening, leading to capital outflows from high-risk technology growth sectors, which directly pressures the Hang Seng Tech Index. Meanwhile, there are concerns in the market about fierce competition among tech giants in AI applications, worrying that a "burn money for growth" strategy may erode corporate profits in the short term. Regarding short-selling data, Tencent's short-selling volume once climbed to 6.5563 million shares in early February, the highest since August 2025. Although it has now fallen back to 1.7228 million shares, bearish forces are still present. Combined with [Hong Kong Stocks Podcast] viewpoint: Will Tencent break below the HKD 500 mark? [Share Link: February 26 [Hong Kong Stock Podcast] Hang Seng Index, Tencent, HSBC, Li Ning, NetEase, AIA] ...](https://nnqimage.futunn.com/sns_client_feed/1162342/20260227/web-1772165366272-bw2SXa3pl1.png/big?area=1&is_public=true&imageMogr2/ignore-error/1/format/webp)
The advantage of CBBCs and warrants over underlying stocks lies in their leverage effect, allowing investors to participate in stock movements with less capital, amplifying returns when the direction is correct; they also offer diverse terms, enabling selection of out-of-the-money, in-the-money, or at-the-money products based on different market conditions, flexibly adjusting the risk-reward ratio. Additionally, the maximum loss for warrants and CBBCs is limited to the invested principal, with no additional liabilities incurred.
Warrant Product Recommendations: Analysis of Terms and Support/Resistance Levels
Below are the recommended warrant and CBBC products for Tencent’s current trend, with term analysis linked to support and resistance levels, incorporating Simon’s suggestions on expiration dates and term selection:
Call Warrants (Bullish on Rebound):
- HSBC Call Warrant (14683) $HSTENCT@EC2609A.C (14683.HK)$ : Leverage of 7.8x, with a strike price of HK$600.5. This strike price is above Resistance Level 2 (HK$591), making it an out-of-the-money product suitable for investors expecting the share price to break through HK$591 and accelerate upwards. If Tencent can stabilize above HK$552 (Resistance Level 1), it may head towards HK$591, at which point the leverage effect of 14683 will become evident.
- Macquarie Call Warrant (14647) $MSTENCT@EC2609A.C (14647.HK)$ : Leverage of 8.3x, with the same strike price of HK$600.5, but its terms specify the lowest premium and implied volatility among similar products. Implied volatility is a key factor affecting warrant prices, reflecting the market's expectations of future volatility of the underlying stock. Choosing products with lower implied volatility reduces the risk of warrant price decline due to volatility pullback, especially suitable for capturing rallies in rebound markets at a lower cost, echoing Simon's reminder on comparing implied volatilities.
Put warrants (for bearish or hedging):
- BOC Put Warrants (23122) $BITENCT@EP2606A.P (23122.HK)$ : Leverage of 8.6x, strike price at HKD 499.8. This strike price is close to Support Level 2 (HKD 506) and Support Level 1 (HKD 492), qualifying as an at-the-money to slightly out-of-the-money product. If Tencent drops below HKD 506 or even HKD 492, the intrinsic value of this warrant will increase rapidly. Combined with low premium and low implied volatility terms, it helps reduce time decay pressure. Simon suggests choosing products expiring in May or June; this warrant's expiration date should meet that condition (subject to verification of specific terms).
- UBS Group Put Warrants (21984) $UBTENCT@EP2606A.P (21984.HK)$ : Leverage of 8.2x, strike price also at HKD 499.8, offering relatively higher leverage, suitable for aggressive bearish investors. Attention must still be paid to the expiration date and implied volatility levels.
![As of February 27, 2026, Tencent (00700) was trading at HKD 527, rebounding by 2.83%. However, based on the detailed technical data provided, the overall weak trend has not yet shown a clear reversal. The summary signal for technical indicators is "Buy", with strength reaching 10, mainly driven by multiple oscillation indicators triggering "oversold" signals, suggesting potential short-term technical rebound needs. Nevertheless, it’s worth noting that MA10 (HKD 529), MA30 (HKD 572.62), and MA60 (HKD 591.80) show a bearish alignment, and both MACD, Bollinger Bands, and Ichimoku Cloud indicate a "Sell" signal, reflecting continued pressure on the medium-term trend. From a market news perspective, Tencent's recent weakness is closely related to the macro environment. Analysis from Cailian Press points out that the continuous strengthening of the US dollar has raised concerns about global liquidity tightening, leading to capital outflows from high-risk technology growth sectors, which directly pressures the Hang Seng Tech Index. Meanwhile, there are concerns in the market about fierce competition among tech giants in AI applications, worrying that a "burn money for growth" strategy may erode corporate profits in the short term. Regarding short-selling data, Tencent's short-selling volume once climbed to 6.5563 million shares in early February, the highest since August 2025. Although it has now fallen back to 1.7228 million shares, bearish forces are still present. Combined with [Hong Kong Stocks Podcast] viewpoint: Will Tencent break below the HKD 500 mark? [Share Link: February 26 [Hong Kong Stock Podcast] Hang Seng Index, Tencent, HSBC, Li Ning, NetEase, AIA] ...](https://nnqimage.futunn.com/sns_client_feed/1162342/20260227/web-1772165381095-1ifAsXJwX7.png/big?area=1&is_public=true&imageMogr2/ignore-error/1/format/webp)
Bull certificates (for bullish rebound):
- BOC Bull Certificate (62650) $BI#TENCTRC2612K.C (62650.HK)$ : Leverage of 10.2x, stop-loss level at HKD 489. This stop-loss level is below Support Level 1 (HKD 492) and the HKD 496 support mentioned by Simon, providing a higher safety margin. If the stock price retraces near HKD 492, as long as the stop-loss mechanism isn't triggered (i.e., falling below HKD 489), participation in the rebound is possible. A leverage of 10.2x implies that for every 1% rise in the underlying stock, the certificate's theoretical price increases by 10.2%.
- UBS Group Bull Certificate (60107) $UB#TENCTRC2606G.C (60107.HK)$ : Leverage of 12.6x, stop-loss level at HKD 492, with the lowest premium and relatively higher actual leverage. The stop-loss level coincides with Support Level 1, suitable for investors who expect HKD 492 to hold firm. However, note that if the stock price falls below HKD 492, the bull certificate will be immediately called back, presenting coexisting risks and rewards.
Bear certificate (bearish):
- Macquarie Bear Certificate (62944)$MS#TENCTRP2812H.P (62944.HK)$: Leverage of 17.4 times, forced call price at HKD 558. This forced call price is higher than resistance level 1 (HKD 552), making it a relatively close-to-price bear certificate. If Tencent rebounds near HKD 552 and faces pressure without breaking above HKD 558, this bearish position can be deployed. The highest actual leverage implies high sensitivity to the underlying stock’s decline.
- J.P. Morgan Bear Certificate (59633): Leverage of 19.6 times, forced call price at HKD 555, with the lowest premium and relatively higher actual leverage. The forced call price lies between resistance level 1 (HKD 552) and resistance level 2 (HKD 591), suitable for investors expecting a rebound capped below HKD 555.
Interactive Questions:
Do you think Tencent will first reach the resistance at HKD 552 or test the support at HKD 492 in the short term? Feel free to leave your thoughts in the comments.
Friendly Reminder: This article does not constitute any investment advice.
This article is for reference only and does not constitute any investment advice. The market data, opinions, and analysis contained herein may change at any time without prior notice. We are not responsible for any loss or damage caused by reliance on the information in this article. Technical analysis only shows whether certain technical conditions are met; a comprehensive assessment of asset performance should combine other data and should not solely rely on this article to make trading decisions. Please note that past performance is not indicative of future results. Follow Jenny's insights on Hong Kong stock warrants for more professional analysis.
#Tencent #00700 #HongKongStockTechnicalAnalysis #SupportResistanceLevels #Warrants #BullBearCertificates #ImpliedVolatility #CallOptions #PutOptions #HongKongStockPodcast
Risk Disclaimer: The above content only represents the author's view. It does not represent any position or investment advice of Futu. Futu makes no representation or warranty.Read more
Comments
to post a comment