
NVIDIA's Q4 earnings report was impressive, but why is the market not responding positively?
Technical Analysis of the Seven Major US Tech Stocks (February 26): MAGS/NVIDIA/Microsoft/Apple/Amazon/Google/META/Tesla
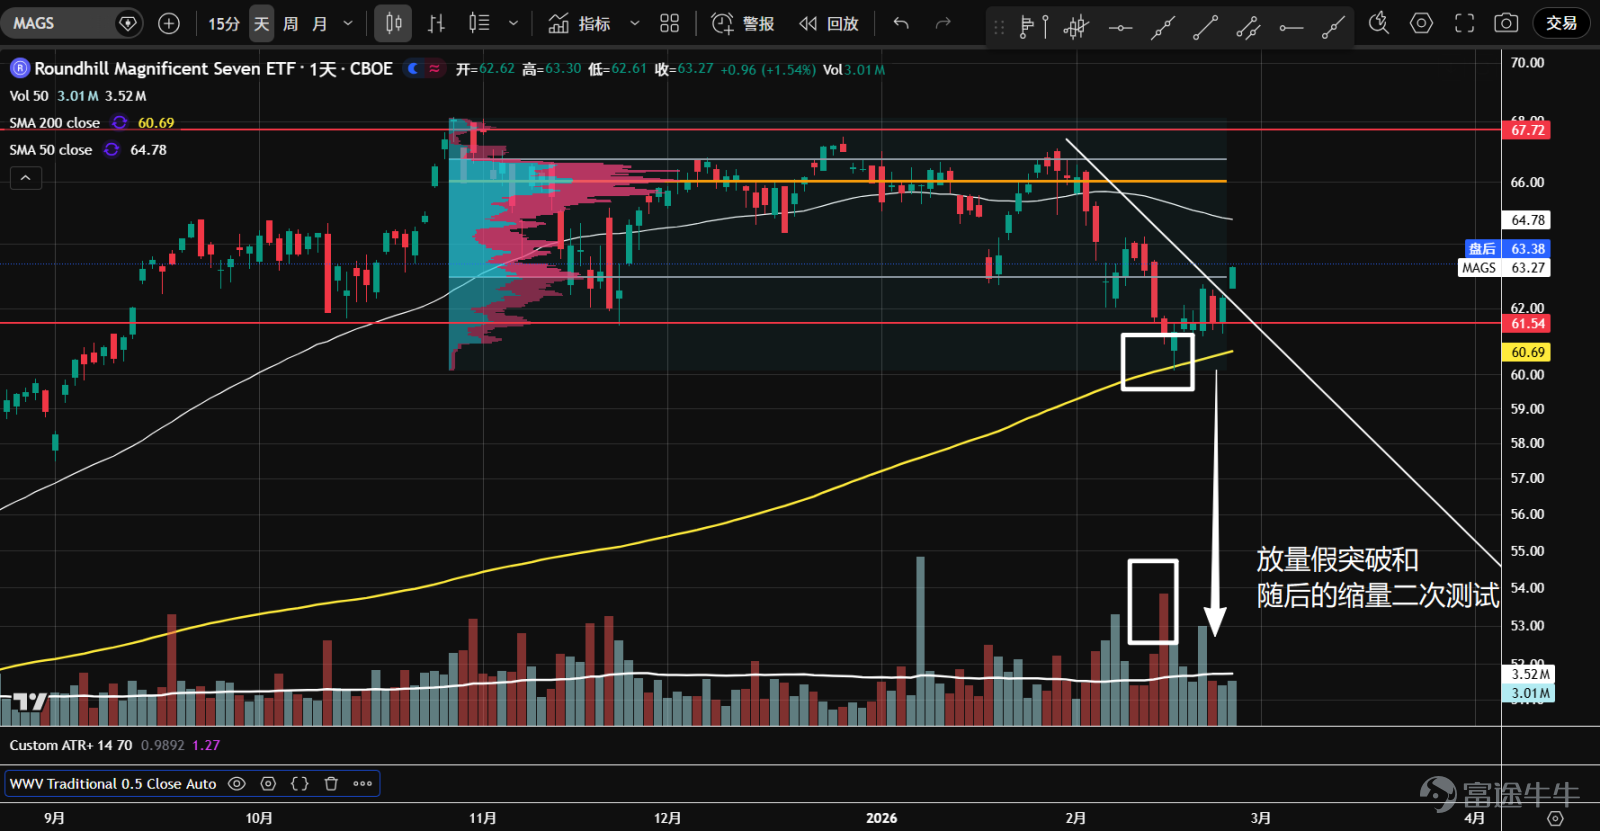
1. The ETF for the seven major tech stocks ( $Roundhill Magnificent Seven ETF (MAGS.US)$ It entered a sideways consolidation in October last year, with a downward false breakout at the support level of 61.5 in mid-February followed by a volume contraction and a second test that stabilized. It then broke upward at the intersection of the annual line and the downward trendline, with the candlestick closing at a high position; the future outlook suggests continued upward movement, targeting the volume control point (orange line).

2、 $NVIDIA (NVDA.US)$ The price has been consolidating within a large sideways range, repeatedly attempting to break through the upper resistance at 194.5 from the large bearish candle on November 20th, but all attempts have failed. Recently, the price rebounded from the bottom of the range and is once again challenging this resistance. The bulls are in a volume-price cycle and entering a critical juncture, which may result in a directional decision.

3、 $Microsoft (MSFT.US)$ The stock accelerated its decline from the end of January and saw panic selling at the gap from April last year. After a natural rebound and a second test, although new lows were hit again, trading volume began to shrink. A subsequent rebound confirmed the effectiveness of the 393 support level. This was a successful second test, and the stock price is expected to break through the downtrend; follow-up entry opportunities should be monitored.

4、 $Apple (AAPL.US)$ Adjustments began in December last year, forming a converging triangle structure (a continuation pattern), and it is currently attempting to challenge the upper resistance. Overall trading volume and price volatility are relatively high, with fierce competition between bulls and bears; for now, maintain a wait-and-see attitude.

5、 $Amazon (AMZN.US)$ After the earnings report was released in early February, trading volume surged and it broke below the consolidation range formed since last August. It is currently in a low-volume rebound, testing the bottom of the broken range (the icy line), but failed to break through and closed with a doji. The downtrend may continue in the future.

6、 $Alphabet-C (GOOG.US)$ After breaking below the uptrend channel in early February, a pullback began and found support around 295, followed by a rebound. Trading volume has formed a P-shaped distribution, confirming entry into a sideways consolidation phase. The price has now reached the Volume Control Point (orange line), and the direction remains unclear, so temporary observation is recommended.

7、 $Meta Platforms (META.US)$ Since November of last year, a large converging triangle has gradually formed and is now heading towards its endpoint. The most recent pullback did not touch the lower trendline and found support at 634 with a second low-volume test stabilizing. Selling pressure has diminished, giving bulls the upper hand, with candlesticks closing at higher levels. After KD indicators became oversold and formed a golden cross, they are now diverging upwards. The risk-reward ratio for going long appears favorable.

8、 $Tesla (TSLA.US)$ Sideways consolidation began in September of last year, and a decline started from the top of the range in late December. Currently, it is testing the double support at the bottom of the range, 384, and the annual moving average, entering a narrowing wedge position. Overall trading volume is gradually declining, although the wave volume during the second test was significant, no key levels were breached. The stock price stabilized on high support and closed at elevated levels, indicating a higher probability of an upward breakout.

$S&P 500 Index (.SPX.US)$ $SPDR S&P 500 ETF (SPY.US)$ $NASDAQ 100 Index (.NDX.US)$ $Invesco QQQ Trust (QQQ.US)$ $Dow Jones Industrial Average (.DJI.US)$ $State Street® SPDR® Dow Jones Industrial Average® ETF Trust (DIA.US)$ $Russell 2000 Index (.RUT.US)$ $iShares Russell 2000 ETF (IWM.US)$ $USD (USDindex.FX)$ $U.S. 10-Year Treasury Notes Yield (US10Y.BD)$ $XAU/USD (XAUUSD.CFD)$ $Bitcoin (BTC.CC)$ $Ethereum (ETH.CC)$
Risk Disclaimer: The above content only represents the author's view. It does not represent any position or investment advice of Futu. Futu makes no representation or warranty.Read more


Comments (3)
to post a comment
7
1