
Earnings and dividends exceed expectations! HSBC's share price hits another record high
HSBC (0005): Record-high earnings ignite market rally, resistance at 145 becomes key focus for future trend
$HSBC HOLDINGS (00005.HK)$HSBC Holdings (00005.HK) has shown strong recent stock performance, closing at HKD 135.2 on February 25 with a slight decline of 0.07%. The 10-day moving average stands at HKD 136.95, the 30-day moving average at HKD 133.67, and the 60-day moving average at HKD 125.50. Multiple moving averages are in a bullish alignment, reflecting positive mid-term trends. From a technical indicator perspective, the RSI is at 53, indicating relatively balanced buying and selling forces. Several oscillation indicators show neutral signals, while the bull-bear strength indicator shows "buy," suggesting an overall technical outlook that remains in a wait-and-see pattern. However, after the earnings announcement on February 26, the share price surged significantly, rising above HKD 148 in early trading and hitting a new all-time high during the session, successfully breaking through the previous resistance level of HKD 139.2. This article will analyze HSBC Holdings' short-term movements using the latest technical data, market news, and insights from the January 26 [Hong Kong Stocks Podcast], while also explaining how to use warrants and bull-bear certificates to capture potential opportunities and reviewing the recent performance of these products.
From a technical perspective, HSBC Holdings is currently in a breakout phase following a period of consolidation. Regarding support and resistance levels, based on the latest technical data, the short-term primary support for HSBC Holdings is at HKD 131.3, which corresponds to the low point during the stock's consolidation in mid-February and aligns closely with the 20-day moving average, providing some support. If this level is breached, the next critical support will be around HKD 127.1, which represents the 60-day moving average and the breakout platform from late January. On the resistance side, the stock was previously constrained by short-term resistance at HKD 139.2, but after the earnings report on February 26, it successfully broke through this level. The next resistance will be at HKD 143.3, a historical high area since 2026.
Correlation analysis between column viewpoints and recent trends
Reviewing Simon's views from the January 26 [Hong Kong Stocks Podcast], he noted that HSBC Holdings had been performing strongly since the end of November, starting from around HKD 105, with nearly a 30% increase over the past two months. Simon mentioned that some investors were optimistic about the stock maintaining its upward trend before the earnings release, believing there would likely be no significant volatility beforehand. Comparing the current market conditions, HSBC Holdings rose from HKD 131 on January 26 to HKD 135.2 just before the earnings announcement, an increase of about 3.2%. Following the earnings announcement, the stock surged above HKD 140, further expanding its gains, validating Simon's prediction of steady pre-earnings movement.
Simon’s technical analysis at the time suggested a short-term support level around HKD 126.6 and a resistance level at approximately HKD 131.4. If the resistance level was broken, the subsequent target would be around HKD 138.6. Comparing this with the latest technical data, the support level of HKD 126.6 aligns closely with the current support level of HKD 127.1, and the target price of HKD 138.6 closely matches the current resistance level of HKD 139.2, demonstrating the forward-looking nature of Simon's technical analysis. Simon also warned of short-term adjustment risks, pointing out that technical signals leaned towards "sell," consistent with the current technical summary signal being "neutral" but with moving averages showing a slightly bearish bias. Investors should still be mindful of short-term fluctuations.
Market News: Strong Earnings Ignite Stock Surge
On February 26, HSBC Holdings announced its full-year 2025 earnings, acting as a catalyst for the stock surge. During the reporting period, the group achieved revenue of USD 68.3 billion, a year-over-year increase of 4%, with net profit after tax reaching USD 23.1 billion. Goldman Sachs issued a report stating that the fourth-quarter pre-tax profit reached USD 8.6 billion, significantly exceeding both Goldman Sachs' and market expectations, primarily driven by robust growth in net interest income and lower-than-expected provisions. JPMorgan also noted that the group updated its three-year tangible equity return (ROTE) guidance to 17% or higher, surpassing market expectations. Boosted by this, after surging 5.47% on February 25, HSBC Holdings rose more than 2% in early trading on February 26, hitting a new all-time high with trading volume spiking to over HKD 5 billion. Since the start of 2026, HSBC Holdings has gained nearly 20%, with a total increase of 73% for the full year of 2025.
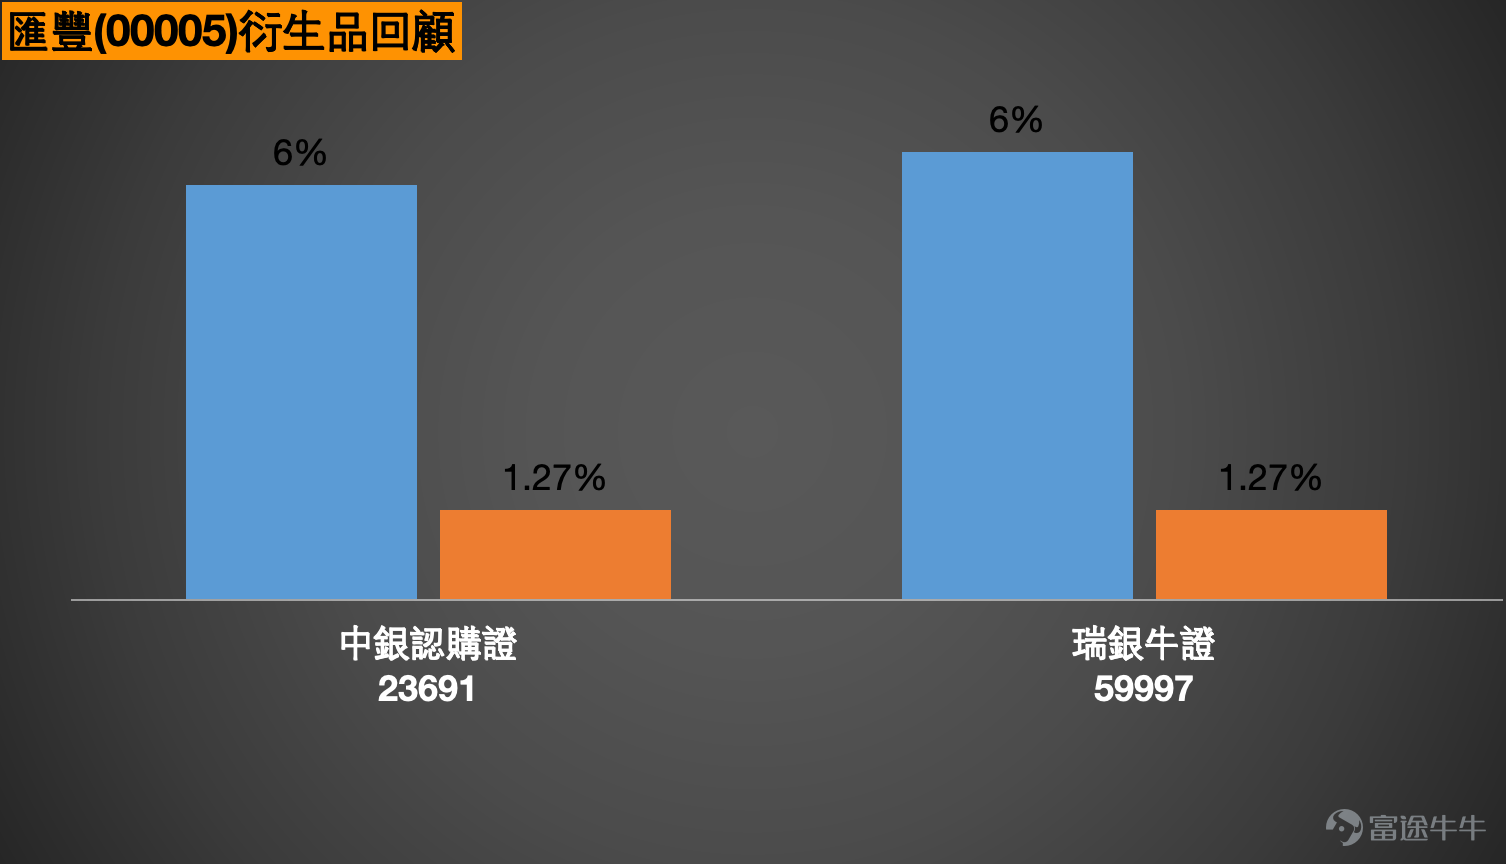
Reviewing the product mentioned in this column on February 16, its performance over the following two days demonstrated the high sensitivity of warrants and bull/bear certificates. During that time, HSBC Holdings, the underlying stock, rose by 1.27% in two days, driving UBS Group (59997). $UB#HSBC RC2809F.C (59997.HK)$ Bull certificates and BOC warrants (23691) $BI-HSBC@EC2605A.C (23691.HK)$ to record a 6% increase respectively, fully reflecting the leverage characteristics of derivative instruments.
![$HSBC HOLDINGS (00005.HK)$HSBC Holdings (00005.HK) has shown strong recent stock performance, closing at HKD 135.2 on February 25 with a slight decline of 0.07%. The 10-day moving average stands at HKD 136.95, the 30-day moving average at HKD 133.67, and the 60-day moving average at HKD 125.50. Multiple moving averages are in a bullish alignment, reflecting positive mid-term trends. From a technical indicator perspective, the RSI is at 53, indicating relatively balanced buying and selling forces. Several oscillation indicators show neutral signals, while the bull-bear strength indicator shows "buy," suggesting an overall technical outlook that remains in a wait-and-see pattern. However, after the earnings announcement on February 26, the share price surged significantly, rising above HKD 148 in early trading and hitting a new all-time high during the session, successfully breaking through the previous resistance level of HKD 139.2. This article will analyze HSBC Holdings' short-term movements using the latest technical data, market news, and insights from the January 26 [Hong Kong Stocks Podcast], while also explaining how to use warrants and bull-bear certificates to capture potential opportunities and reviewing the recent performance of these products. From a technical perspective, HSBC Holdings is currently in a breakout phase following a period of consolidation. Regarding support and resistance levels, based on the latest technical data, the short-term primary support for HSBC Holdings is at HKD 131.3, which corresponds to the low point during the stock's consolidation in mid-February and aligns closely with the 20-day moving average, providing some support. If this level is breached, the next critical support will be around HKD 1...](https://nnqimage.futunn.com/sns_client_feed/1162342/20260226/web-1772074746970-VEEcPu9lRP.png/big?area=1&is_public=true&imageMogr2/ignore-error/1/format/webp)
Warrant Product Deployment Strategy
Under the current market conditions, investors can select from the following products based on their outlook for the future market. If optimistic about HSBC Holdings stabilizing at the support level and breaking upward, they may consider call warrants or bull certificates for deployment. BOC call warrant (23691) offers 12.7x leverage with a strike price set at HKD 148.1, approximately 9.5% higher than the current price, close to the second resistance level of HKD 143.3. This out-of-the-money call warrant has relatively low implied volatility, making it suitable for capturing movements where the underlying stock breaks through resistance and challenges new highs. Another BOC call warrant (22630) provides 7.8x leverage with a strike price of HKD 145.1, approximately 7.3% higher than the current price. Its standout feature is having the highest leverage among similar products while maintaining low implied volatility, making it ideal for investors anticipating that the share price will test the upper resistance zone.
If confident that the underlying stock will maintain strength, investors may consider high-leverage bull certificate products. UBS Group Bull Certificate (62176) $UB#HSBC RC2812B.C (62176.HK)$ and UBS Group Bull Certificate (59997) $UB#HSBC RC2809F.C (59997.HK)$ both have stop-loss levels set at HKD 120, approximately 11% lower than the current price, providing an actual leverage of 10.4x each with the lowest premium. The stop-loss level is below the support zone at HKD 127, offering a safer buffer and aligning with risk management principles.
Conversely, if investors believe HSBC Holdings will consolidate after a short-term surge, retesting supports at HKD 131.3 or even HKD 127.1, they may consider put warrants or bear certificates for hedging or short-term bearish positioning. BOC put warrant (24062) offers 7.2x leverage with a strike price of HKD 111.98, approximately 17% lower than the current price. Its leverage and implied volatility are relatively ideal, making it suitable for capturing downward movements toward the support zone. UBS Group put warrant (23923) $UB-HSBC@EP2609B.P (23923.HK)$ also provides 7.2x leverage with a strike price of HKD 111.78 and relatively low implied volatility, serving as another option for bearish strategies.
For short-term aggressive bearish investors who expect the stock price to be capped by resistance at $143.3, bear contracts offer higher leverage. UBS Group's bear contract (68084) has a stop-loss level at $145, approximately 7.2% higher than the current price, with an actual leverage of 10.7 times and low premium. Its stop-loss level is set above the $143.3 resistance, effectively avoiding the risk of a short-term breakout. JPMorgan's bear contract (59790) has a stop-loss level at $148, about 9.5% higher than the current price, with an actual leverage of 8.2 times, making it the highest-leveraged option among bear contracts, with relatively low premium, suitable for bearish strategies.
![$HSBC HOLDINGS (00005.HK)$HSBC Holdings (00005.HK) has shown strong recent stock performance, closing at HKD 135.2 on February 25 with a slight decline of 0.07%. The 10-day moving average stands at HKD 136.95, the 30-day moving average at HKD 133.67, and the 60-day moving average at HKD 125.50. Multiple moving averages are in a bullish alignment, reflecting positive mid-term trends. From a technical indicator perspective, the RSI is at 53, indicating relatively balanced buying and selling forces. Several oscillation indicators show neutral signals, while the bull-bear strength indicator shows "buy," suggesting an overall technical outlook that remains in a wait-and-see pattern. However, after the earnings announcement on February 26, the share price surged significantly, rising above HKD 148 in early trading and hitting a new all-time high during the session, successfully breaking through the previous resistance level of HKD 139.2. This article will analyze HSBC Holdings' short-term movements using the latest technical data, market news, and insights from the January 26 [Hong Kong Stocks Podcast], while also explaining how to use warrants and bull-bear certificates to capture potential opportunities and reviewing the recent performance of these products. From a technical perspective, HSBC Holdings is currently in a breakout phase following a period of consolidation. Regarding support and resistance levels, based on the latest technical data, the short-term primary support for HSBC Holdings is at HKD 131.3, which corresponds to the low point during the stock's consolidation in mid-February and aligns closely with the 20-day moving average, providing some support. If this level is breached, the next critical support will be around HKD 1...](https://nnqimage.futunn.com/sns_client_feed/1162342/20260226/web-1772074791139-NEZaITdNXb.png/big?area=1&is_public=true&imageMogr2/ignore-error/1/format/webp)
Interactive Question:
Regarding the short-term trend of HSBC Holdings, which key test level do you believe the stock will target after breaking through resistance at $139.2?
A. Retesting support at $131.3
B. Challenging resistance at $143.3
C. Moving sideways and consolidating within the $135-$140 range
Friendly Reminder: This article does not constitute any investment advice.
This article is for reference only and does not constitute any investment advice. The market data, opinions, and analysis contained herein may change at any time without prior notice. We are not responsible for any loss or damage caused by reliance on the information in this article. Technical analysis only shows whether certain technical conditions are met; a comprehensive assessment of asset performance should combine other data and should not solely rely on this article to make trading decisions. Please note that past performance is not indicative of future results. Follow Jenny's insights on Hong Kong stock warrants for more professional analysis.
#HSBC #00005 #HongKongStocks #TechnicalAnalysis #SupportResistanceLevels #Warrants #Options #BullBearCertificates #ImpliedVolatility #BankStocks
Risk Disclaimer: The above content only represents the author's view. It does not represent any position or investment advice of Futu. Futu makes no representation or warranty.Read more

Comments
to post a comment
3
10