
After Ctrip's deep correction, its earnings may become a turning point for bulls and bears
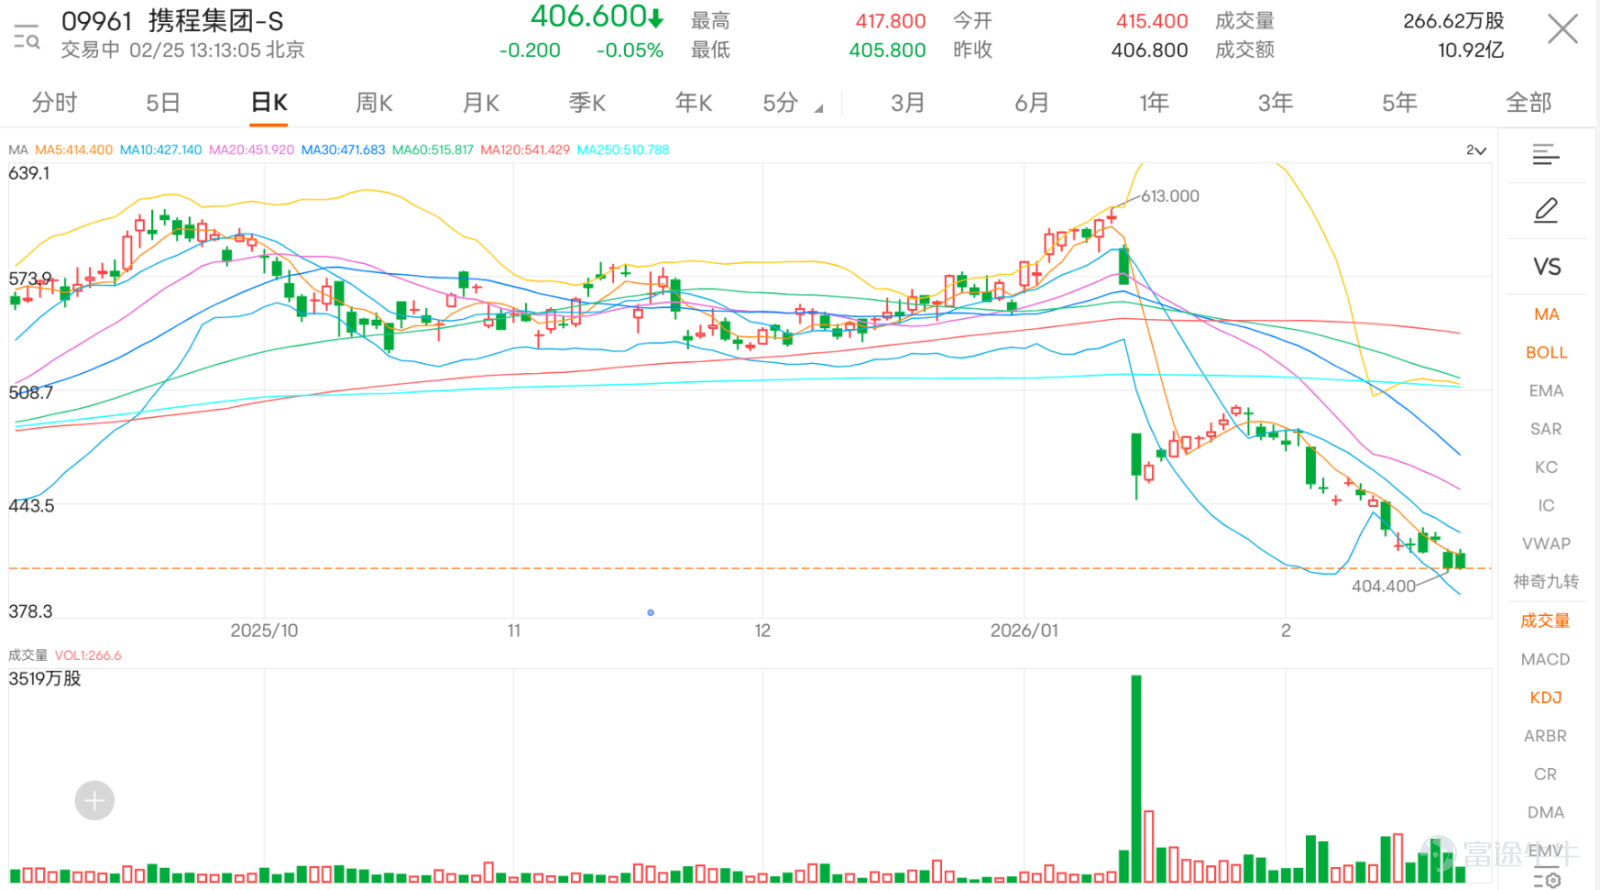
$TRIP.COM-S (09961.HK)$ Will announce earnings tomorrow, with the current stock price at 406.6 yuan, down more than 30% from the January high of 609 yuan, technically entering bear market territory. However, recent prices have shown signs of stabilization near the 400-yuan level, indicating buying support at this level.
From the perspective of the moving average system, the stock price has fallen below key moving averages, including the 10-day (427.42 yuan), 30-day (471.78 yuan), and 60-day (515.86 yuan) averages, showing a mid-term downtrend. The stock price is trading below these averages, reflecting that selling pressure in the market has not fully eased. However, technical indicators are starting to show reversal signals, particularly oscillation indicators suggesting oversold conditions, providing potential entry opportunities for short-term investors.
In terms of support and resistance analysis, the current share price is close to the first support level of 397 yuan, and if it breaks below that, it may further test the second support level of 358 yuan; on the upside, the first resistance is at 440 yuan, and the second resistance at 474 yuan, making these levels important points for observing short-term rebounds. From the technical signal perspective, the stochastic oscillator is currently neutral, offering no clear direction, and the CCI also remains neutral, indicating that market momentum has not fully reversed.
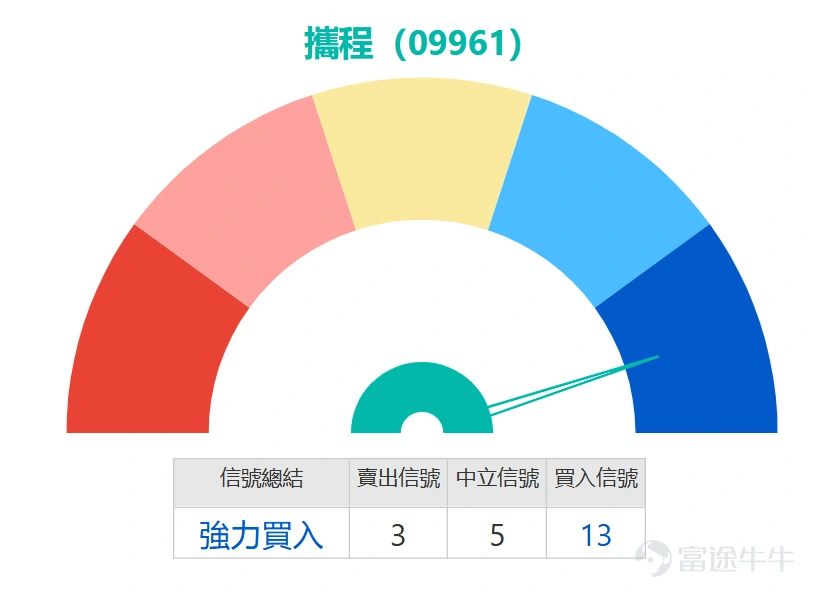
Relatively speaking, the Relative Strength Index (RSI) stands at 27, already in the oversold region, typically considered a buy signal; the Williams %R indicator also shows the stock in an oversold range, similarly issuing a buy signal. Other indicators like the Average Directional Index (ADX), Psychological Line indicator, Momentum Oscillator, and Rate of Change indicator all remain neutral, but the Volume Ratio (VR) and Bull/Bear Power indicator suggest buying, with the latter hinting at possible bottom formation after excessive decline. Ichimoku Cloud also supports a buy view, though Moving Average Convergence Divergence (MACD) and Bollinger Bands indicate sell signals, creating a contradiction in technical analysis.
Based on these technical indicators, the overall signal is a "Strong Buy" with a strength rating of 13. Multiple oscillation indicators are consistently signaling a buy, and with a 63% probability of an upward move, it suggests that Ctrip’s stock price may have room for a short-term rebound after a deep correction. Although the stock price remains below the moving average system and trend indicators like MACD remain bearish, the oversold condition and potential fundamental improvement could act as catalysts.
Ctrip's performance in the first three quarters of 2025 has been impressive, with both revenue and net profit achieving rapid growth. However, the uncertainty surrounding the antitrust investigation continues to weigh on market valuation. If better-than-expected earnings are announced and management provides a positive response regarding the antitrust probe, the stock price could experience a technical rebound. Conversely, if results disappoint or there are negative developments in the investigation, the stock price might test lower support levels, and investors should be prepared for risk management.
Product Picks:
For investors looking to participate in downside movements with higher leverage, they may consider $UB#TRIP RC2604J.C (68166.HK)$ , with a recovery price of 375 yuan and actual leverage as high as 7.5 times. If the stock price stays above 375 yuan, this bull certificate can continue to operate and provide high leverage benefits. However, investors need to closely monitor the recovery risks.
For investors who are bearish on the future outlook, put warrants are a more suitable tool. $CT-TRIP@EP2605A.P (17431.HK)$ The exercise price is 400.18 yuan with leverage of 5.4 times. If the stock price moves further towards the support level, this put warrant could enter in-the-money status, offering strong return potential for investors. $JP-TRIP@EP2605A.P (15878.HK)$ The exercise price is 400 yuan, with leverage reaching 5 times and relatively low implied volatility, making it suitable for investors seeking high-leverage efficiency.

What do you expect Ctrip’s performance announcement will bring? Feel free to leave your thoughts in the comments section.
Reminder: This article does not constitute any investment advice. It is for reference only and does not constitute any form of investment recommendation. Market data, opinions, and analyses contained herein may change at any time without prior notice. We are not responsible for any loss or damage caused by reliance on the information in this article. Technical analysis merely shows whether certain technical conditions are met; asset performance should be assessed comprehensively with additional data. Trading decisions should not be made solely based on this article. Note that past performance is not indicative of future results.
Remember to follow the 'HK Stock Warrants Jenny' account for more individual stock technical analysis and derivative product investment strategies.
#HongKongStocks #RealTimeAnalysis #WarrantPicks #WarrantStrategy #DerivativesHedging #HKStockWarrantsJenny #EarningsAnnouncement #TechnicalAnalysis #Ctrip#09961#
Risk Disclaimer: The above content only represents the author's view. It does not represent any position or investment advice of Futu. Futu makes no representation or warranty.Read more

Comments
to post a comment
1