
Circle plunges! Draft provisions of the CLARITY Act revealed

Technical Analysis of Cryptocurrencies and Related Stocks (February 25): Bitcoin/Ethereum/HOOD/COIN/MSTR/CRCL/IREN/CIFR/BMNR/MARA/RIOT
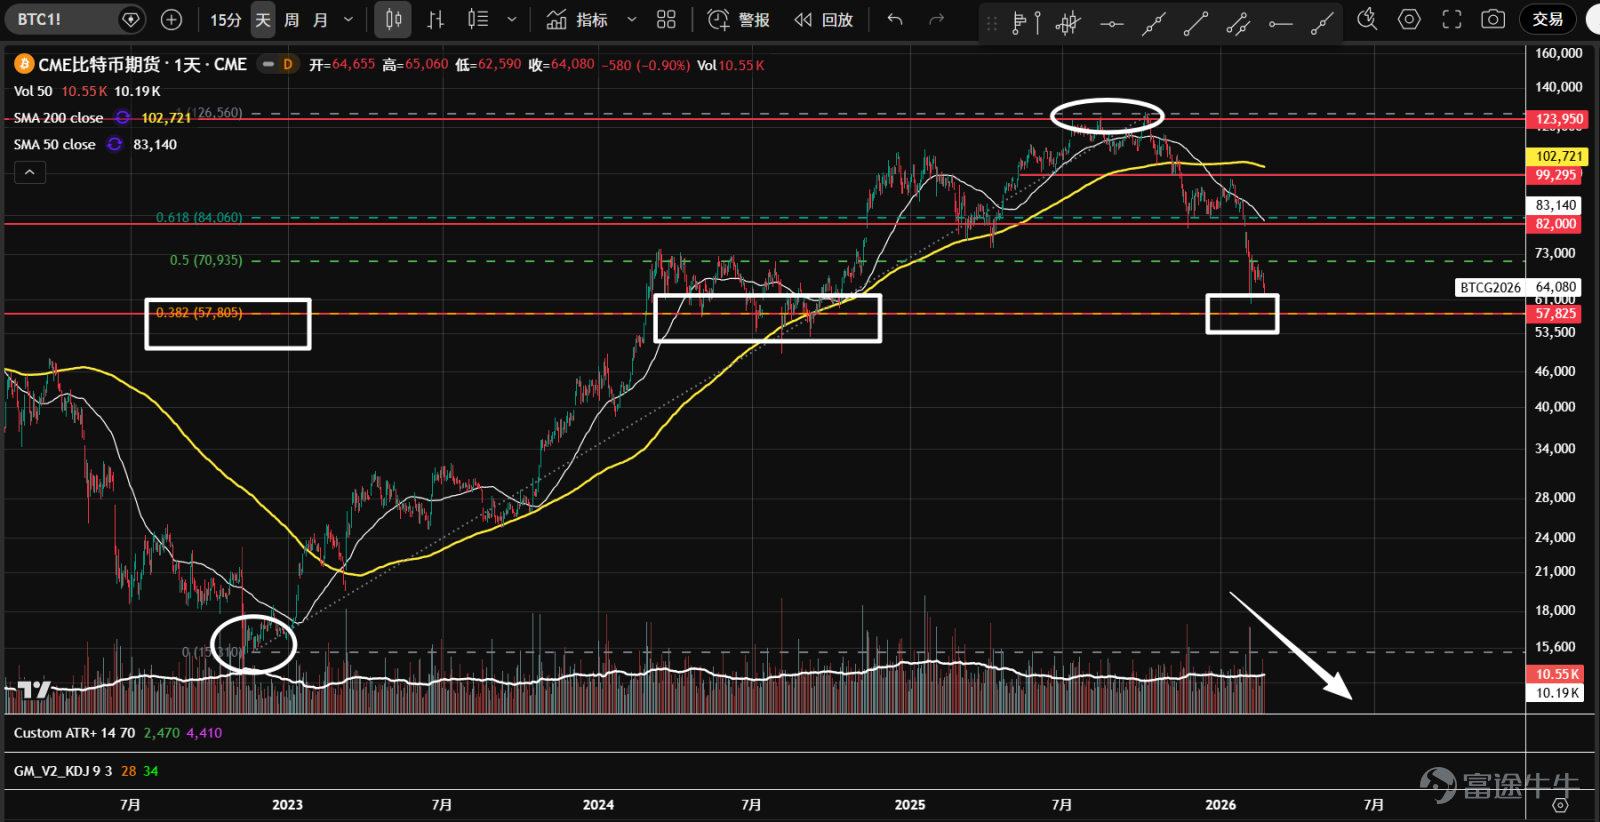
1、 $Bitcoin (BTC.CC)$ Futures experienced consecutive sharp declines at the end of January and early February, triggering panic selling as prices approached the support level near 57,800. A strong rebound followed thereafter. The 57,800 level represents the 38.2% retracement from the lowest point of the 2022 bear market to the highest point of the 2025 bull market, and it also serves as the last line of defense below the psychological 60,000 threshold. Currently, during the second test, although there are downside candles with increased volume, overall trading volume has shrunk, suggesting the market may gradually stabilize going forward.

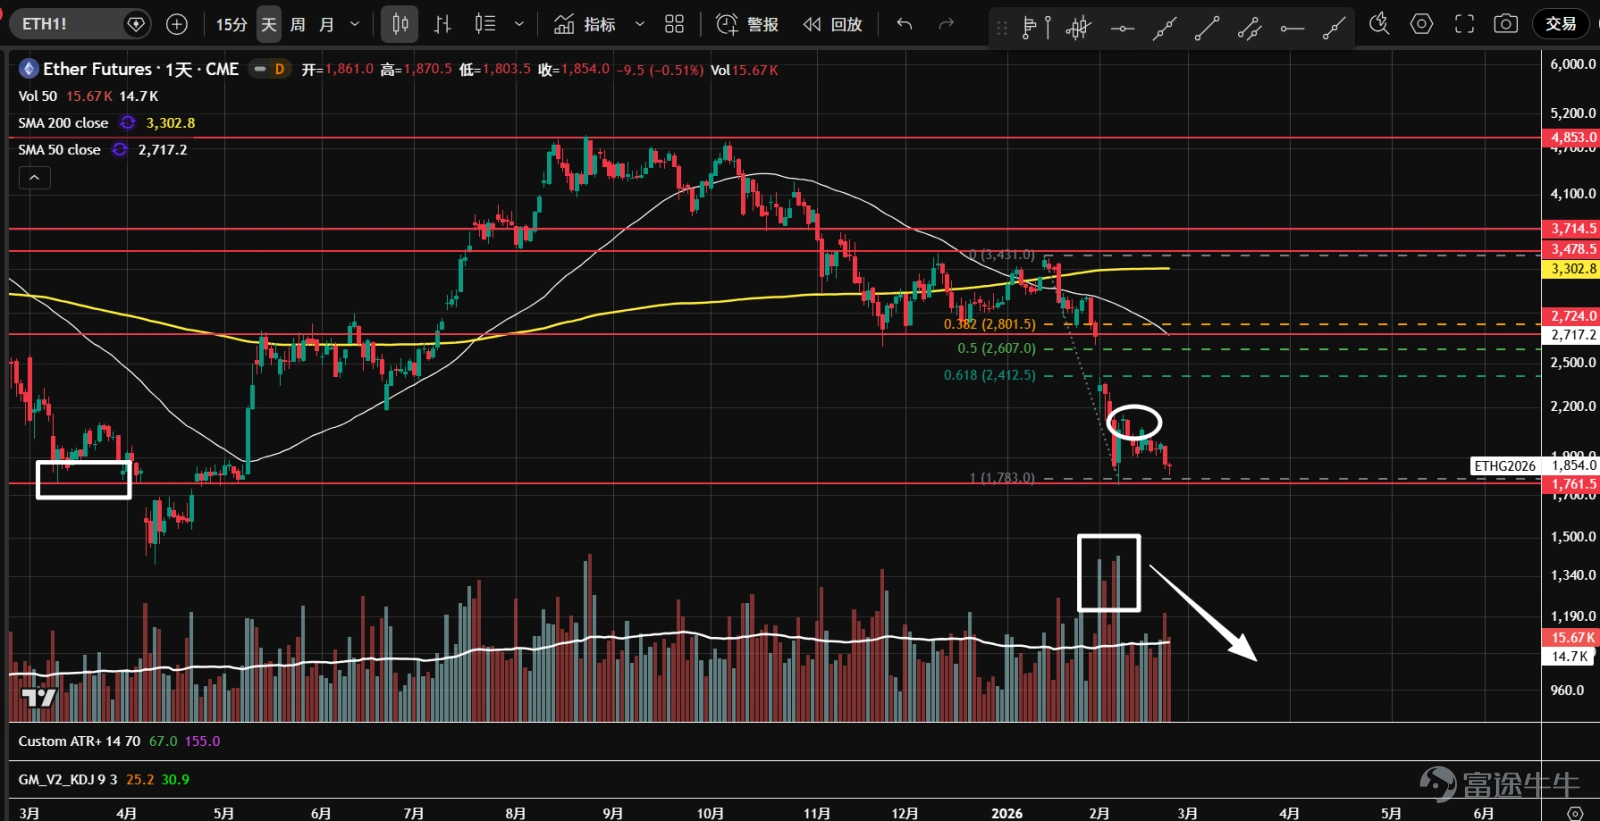
2、 $Ethereum (ETH.CC)$ After futures broke through the consolidation range from November of last year to January of this year, they accelerated into a volume-driven decline, accompanied by panic selling. Subsequently, prices naturally rebounded from the 1,761 support level, but the rebound was weak, failing to reach 61.8% of the most recent downward wave. Currently undergoing a second test, the technical outlook is weak, and attention should be paid to whether the market can stabilize in the future.
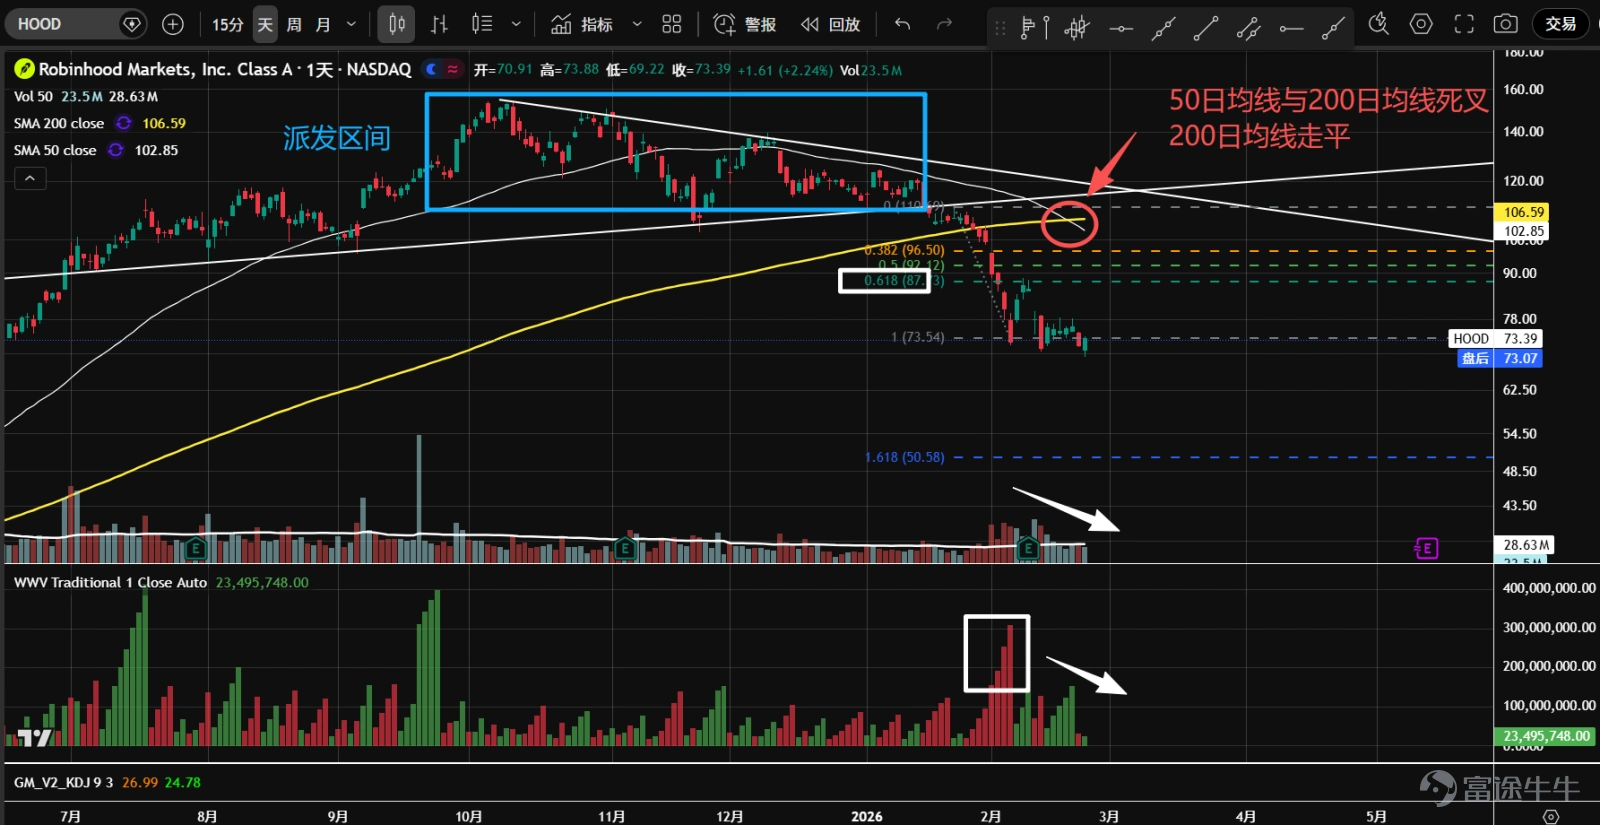
3、 $Robinhood (HOOD.US)$ At the end of January and early February, heavy volume broke the top triangle pattern. Panic selling emerged near 73, followed by a natural rebound. Currently, the price is undergoing a second test with lower volume and has temporarily stabilized. The 50-day moving average has crossed below the 200-day moving average, which is flattening, and given the prolonged distribution phase at the top, a long-term downtrend may be initiated.
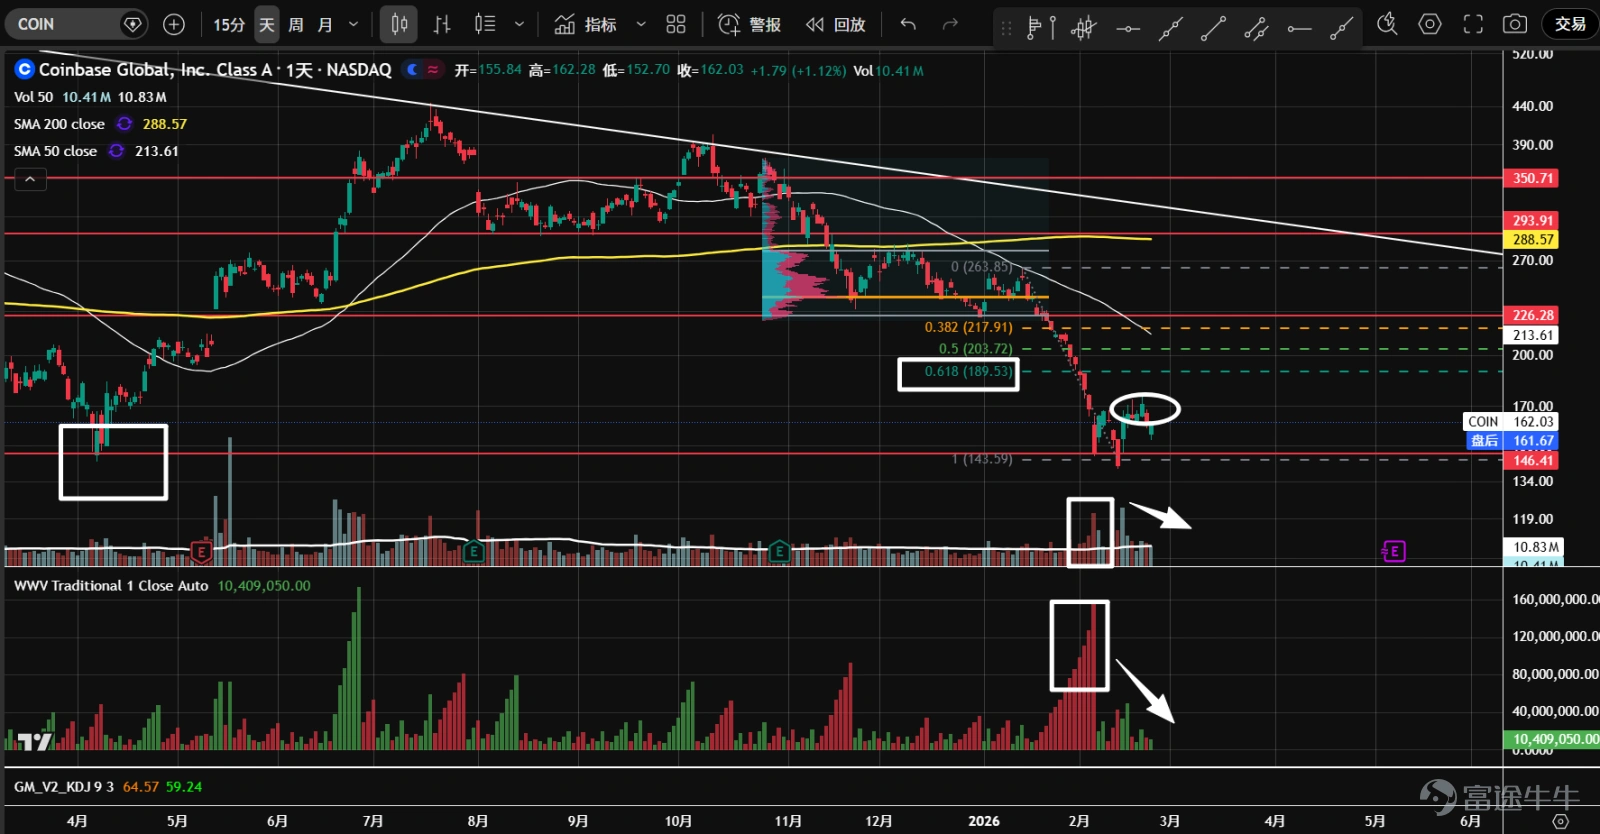
4、 $Coinbase (COIN.US)$ Entered a sideways consolidation in November of last year, then broke through the bottom support of 226 and the lower bound of the value range in late January on heavy volume, re-initiating a downward trend. Panic selling occurred at the 146 support level, followed by a natural rebound, but the rebound was weak, failing to reach 61.8% of the most recent decline, leaving the technical outlook still very weak.
5、 $Strategy (MSTR.US)$ The stock saw heavy selling and dropped sharply at the end of January to early February, breaking below the secondary distribution range formed at the end of last year. After panic selling, a significant rebound occurred at the support level of 103.5, followed by shrinking volume, signaling weak upward momentum. It may currently be undergoing a second test, and bottom fishing is not considered until the downward trend is broken.

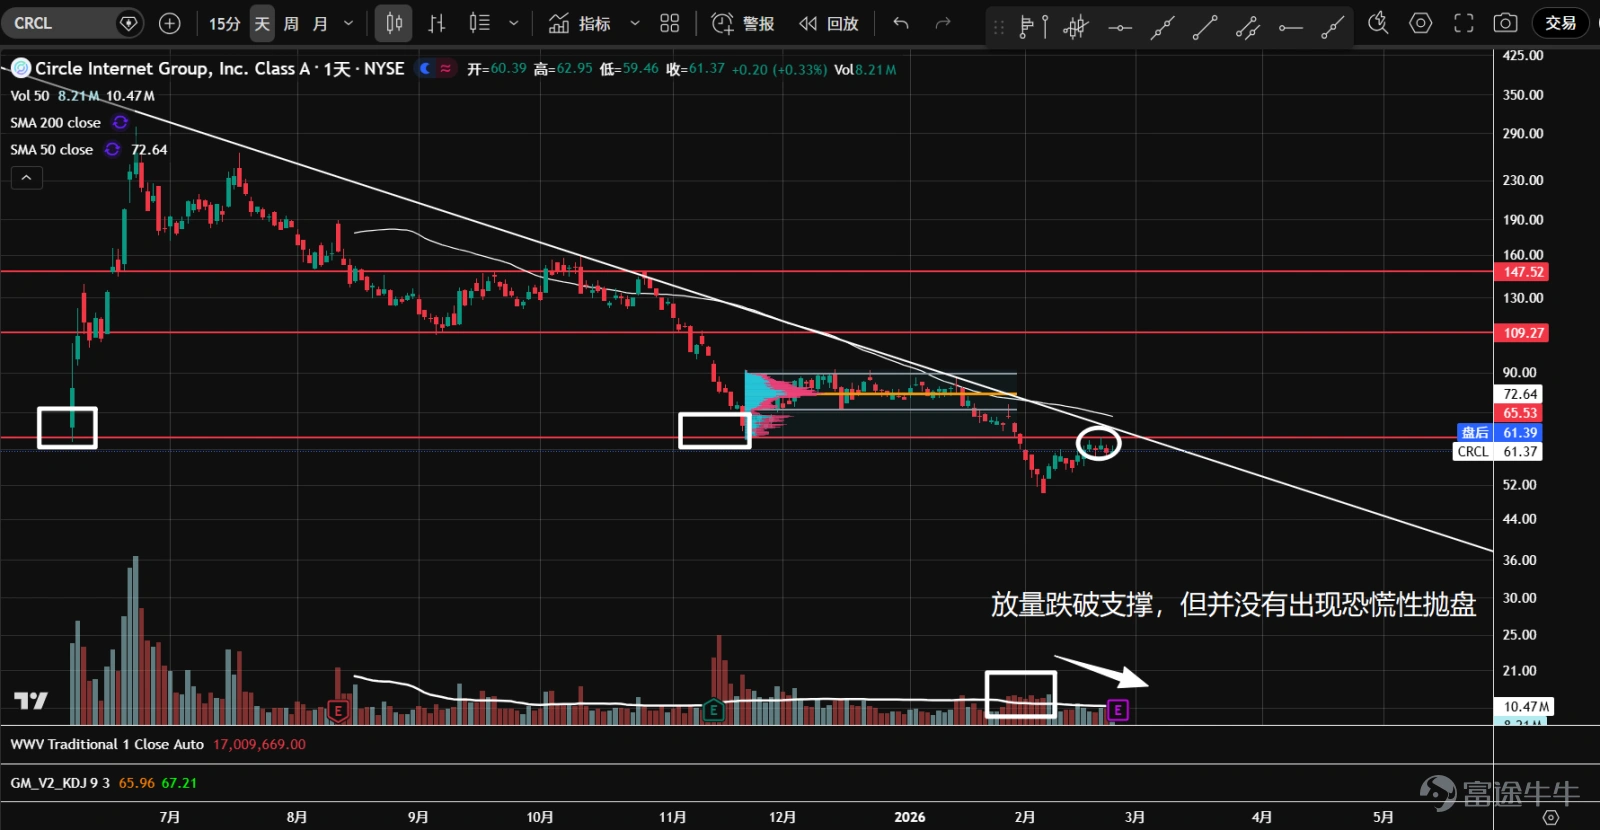
6、 $Circle (CRCL.US)$ The stock plummeted with heavy volume at the end of January to early February, quickly breaking below the secondary distribution range formed at the end of last year and piercing through the IPO bottom support at 65.5, continuing the medium-term downtrend (white line). The recent low-volume rebound was met with resistance again at 65.5, triggering bearish signals. Bottom fishing is not recommended until the downward trend is broken.
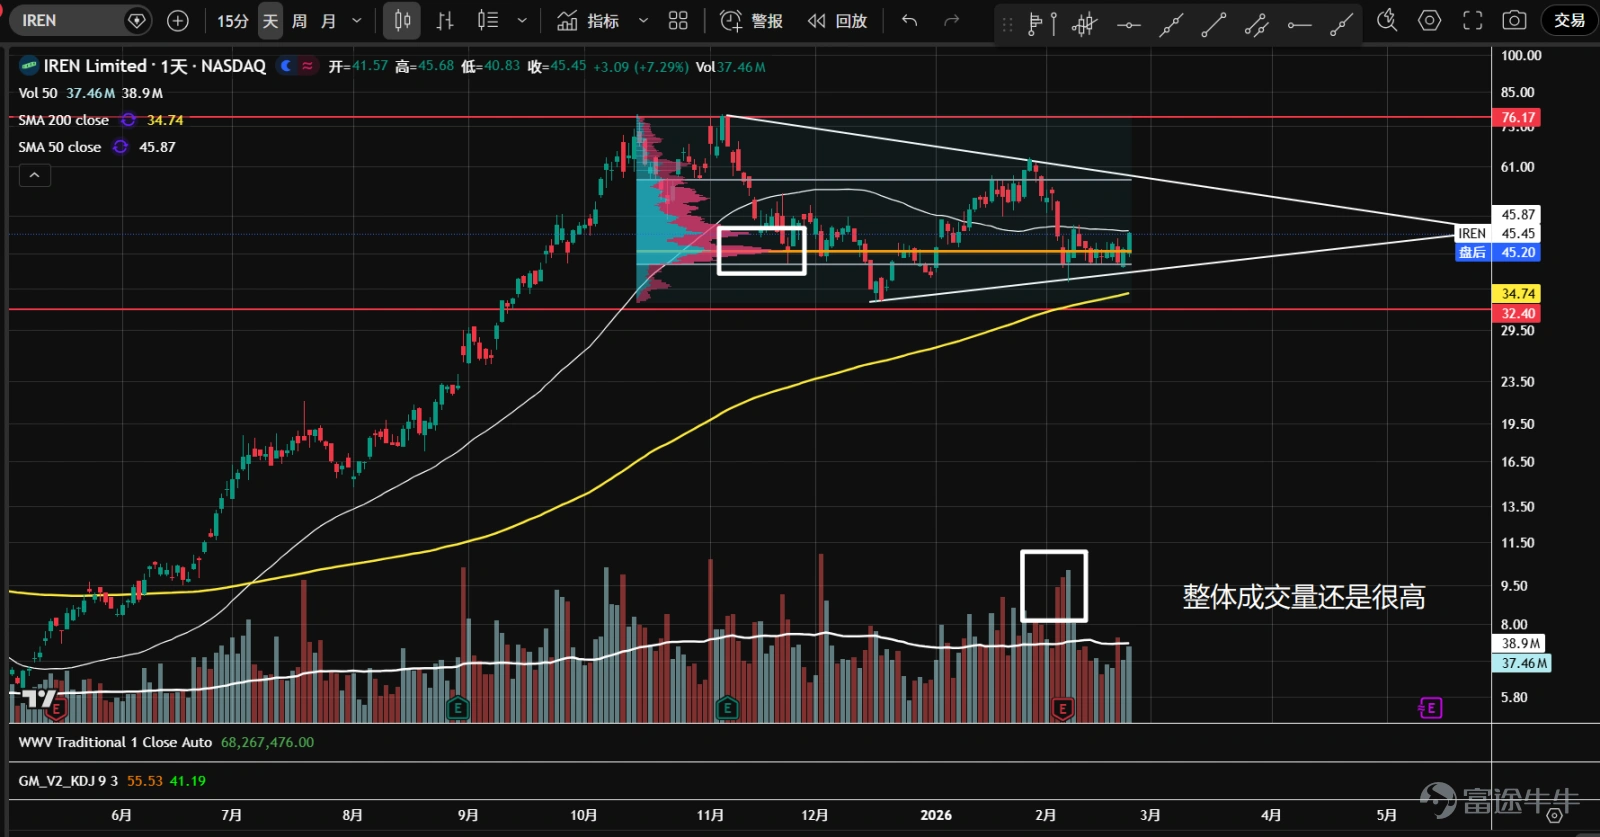
7、 $IREN Ltd (IREN.US)$ In October last year, the stock entered a large consolidation range. In mid-to-late December, it attempted a rebound but failed to reach the top of the range at 76 before starting to fall sharply on heavy volume. Currently, the price has temporarily stabilized above the uptrend line (white line) and the volume control point (orange line), potentially forming a symmetrical triangle. The direction remains unclear, so staying on the sidelines for now is advised.
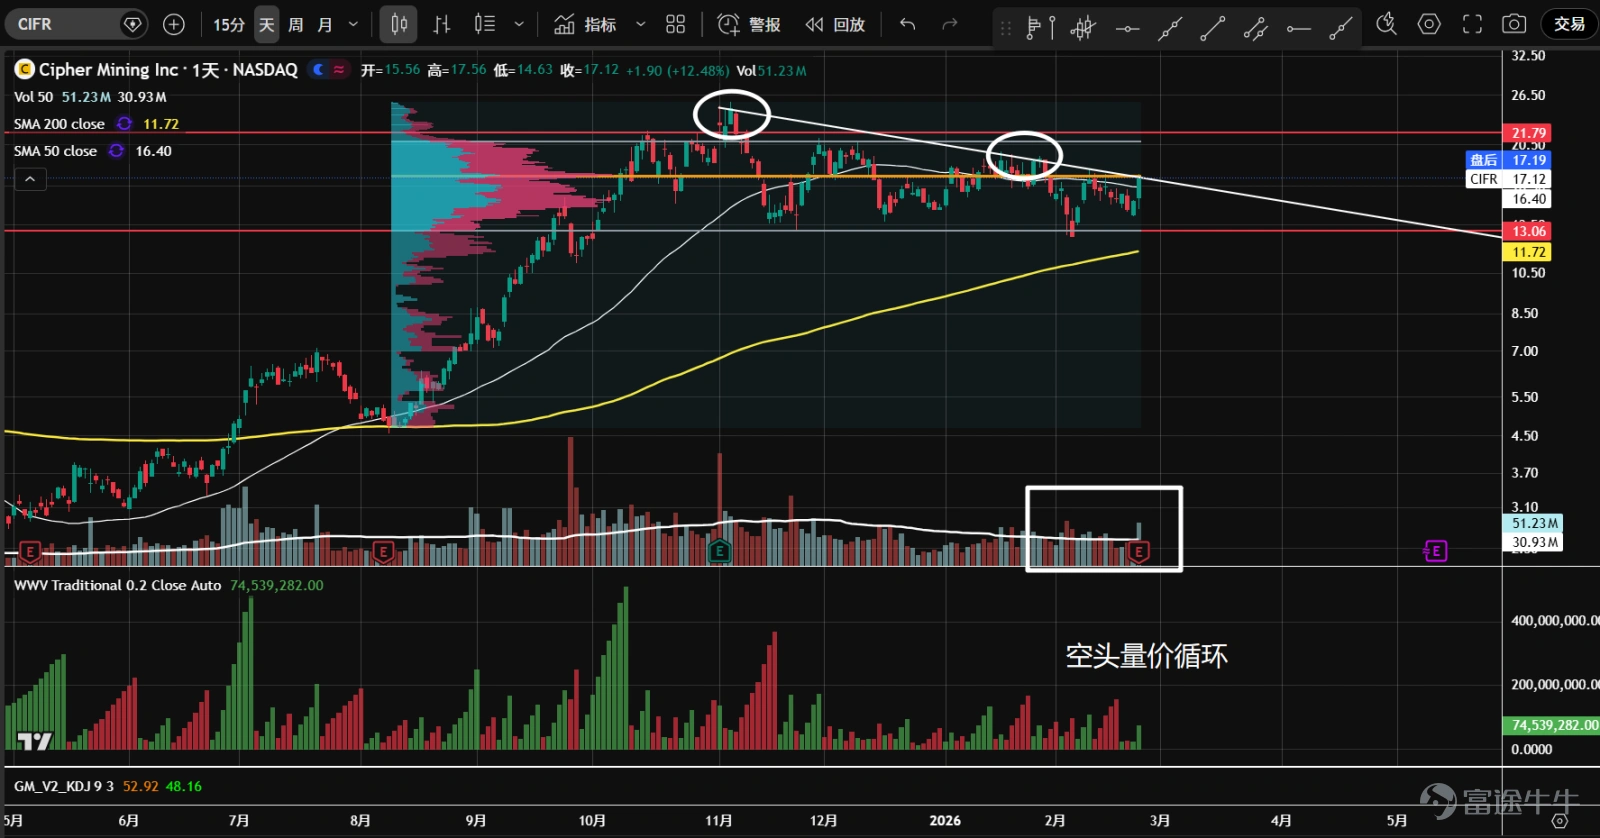
8、 $Cipher Digital (CIFR.US)$ In October last year, the stock entered a large consolidation range and formed a P-shaped volume distribution, reflecting continued divergence at higher levels. Recently, it rebounded from the support at the bottom of 13, with the price reaching the volume control point (orange line) and the downtrend line (white line). The direction remains unclear for now. In the second half of the consolidation range, overall volume has not been low, while the highs have gradually decreased, showing characteristics of distribution in a bearish price-volume cycle.
9、 $Bitmine Immersion Technologies (BMNR.US)$ The stock saw heavy selling and dropped sharply at the end of January to early February, breaking below the secondary distribution range that began forming in November last year, accompanied by panic selling and a natural rebound. However, the rebound was limited, failing to reach even the 61.8% retracement of the most recent decline. It is currently undergoing a low-volume second test, with overall technical indicators remaining weak.

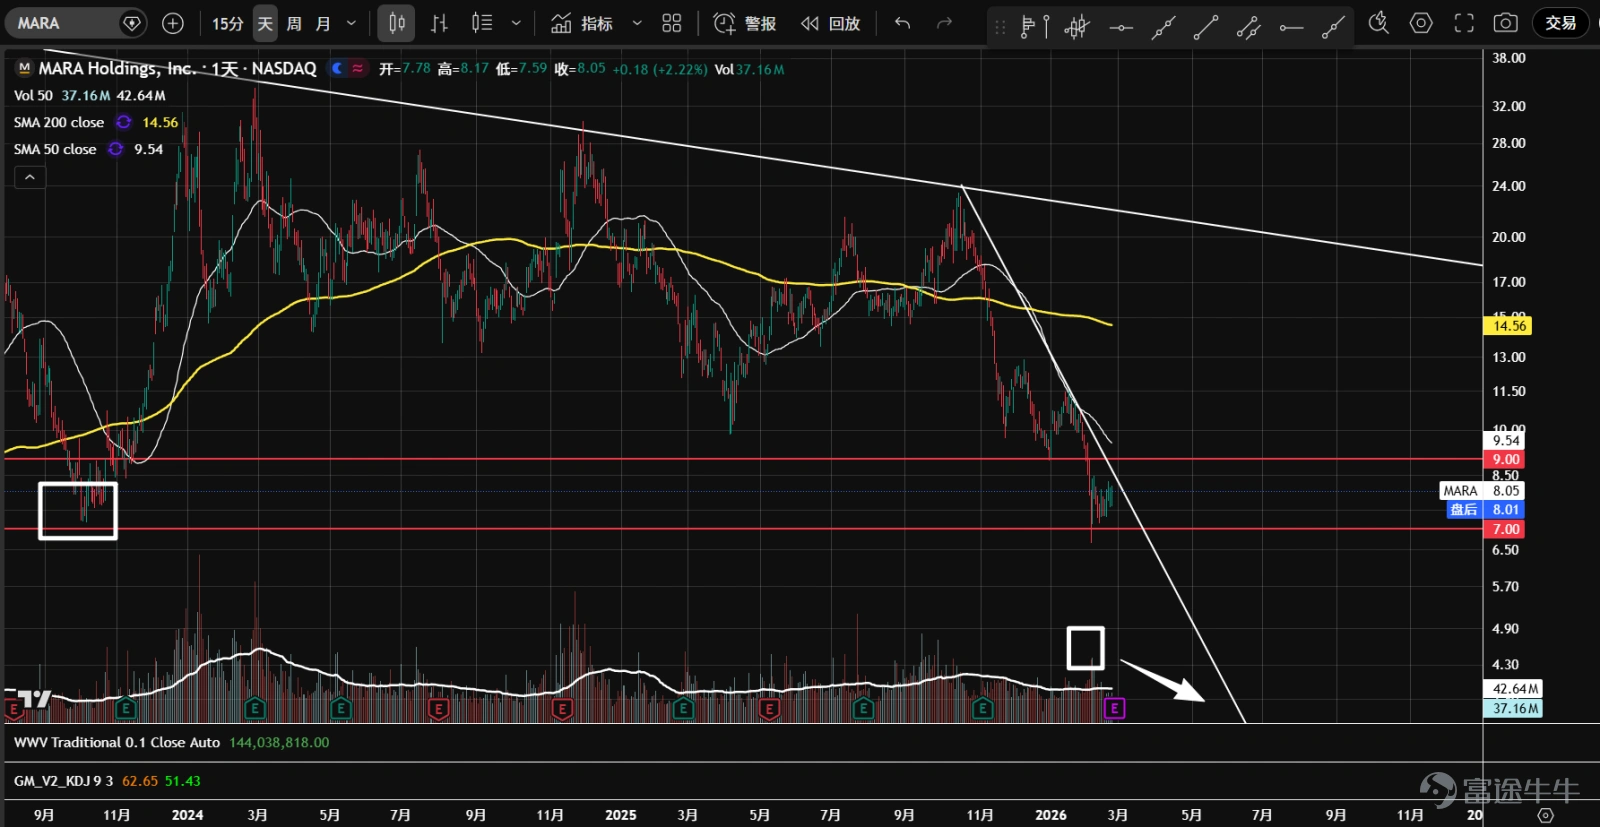
10、 $MARA Holdings (MARA.US)$ At the beginning of February, the stock resumed a sharp plunge, quickly breaking below the secondary distribution range that started forming in November last year, and panic selling emerged near the $7 support level. It may currently be experiencing a natural rebound, but bottom fishing is not considered until the new downtrend is broken.
11、 $Riot Platforms (RIOT.US)$ At the end of November last year, the stock entered a sideways consolidation pattern. In early February, it briefly broke below the lower support level on heavy volume but quickly rebounded, showing bullish price-volume cycles. The price is currently approaching the volume control point (orange line). Overall trading volume has declined, contrasting with Bitcoin's strengthening trend, reflecting characteristics of accumulation.

$S&P 500 Index (.SPX.US)$ $SPDR S&P 500 ETF (SPY.US)$ $NASDAQ 100 Index (.NDX.US)$ $Invesco QQQ Trust (QQQ.US)$ $Dow Jones Industrial Average (.DJI.US)$ $State Street® SPDR® Dow Jones Industrial Average® ETF Trust (DIA.US)$ $Russell 2000 Index (.RUT.US)$ $iShares Russell 2000 ETF (IWM.US)$ $Bitcoin (BTC.CC)$ $CME-Bitcoin RR Futures (JUL6) (BTCmain.US)$ $iShares Ethereum Trust ETF (ETHA.US)$
Risk Disclaimer: The above content only represents the author's view. It does not represent any position or investment advice of Futu. Futu makes no representation or warranty.Read more


Comments (6)
to post a comment
10
1