
BYD Short-term Trend Analysis: Warrant and Bull/Bear Certificate Deployment around Key Support and Resistance Levels
$BYD COMPANY (01211.HK)$ BYD Co., Ltd. (01211.HK) has recently shown a consolidation pattern in its share price, closing at HKD 99.35 as of February 24, down 0.75%. This article will provide an in-depth analysis of BYD's short-term trend for investors by integrating the latest technical data, market news, and insights from the [HK Stocks Podcast]. We will also explain how to use warrant and bull/bear certificate products to capture potential opportunities, while reviewing the recent performance of these products.
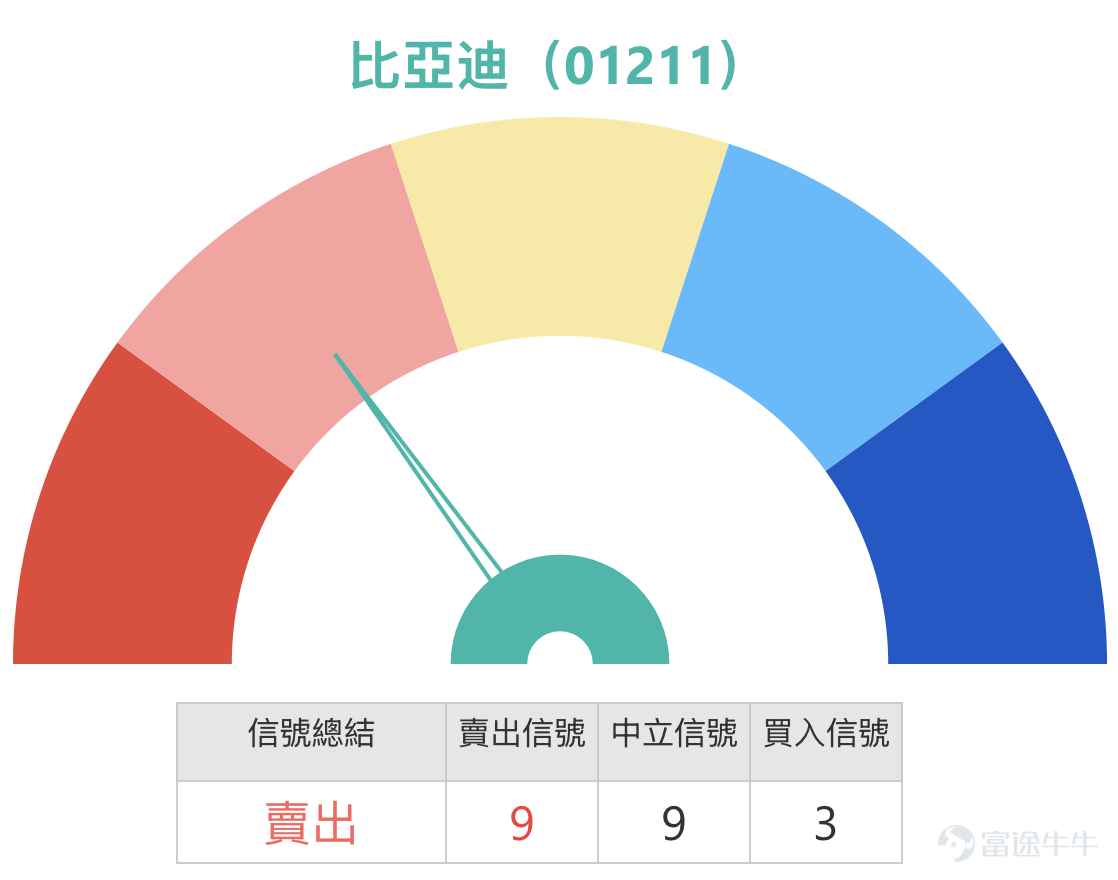
From a technical perspective, BYD is currently in a critical consolidation phase. Recently, the stock price has fluctuated near the middle line of the Bollinger Bands. Multiple moving averages including the 10-day line (HKD 96.98), 30-day line (HKD 97.02), and 60-day line (HKD 96.86) are quite close, indicating similar short- and medium-term costs without a clear direction. In terms of technical indicators, the RSI is at 56, reflecting a relatively balanced buying and selling power. Several oscillation indicators like the Stochastic Oscillator and CCI have issued neutral signals, showing no strong one-sided trend in the overall technical picture.
Regarding support and resistance levels, based on the latest technical data, BYD's primary short-term support zone is between HKD 94.6 and HKD 94.9. This area represents the low point during the pullback in early February and holds certain support strength. If this level is breached, the next key support would be around HKD 92 to HKD 91.3, which marks the bottom of a dense trading range since December last year. As for resistance levels, the stock price is currently constrained by HKD 101.5, which is close to both the 10-day and 20-day lines, making it a crucial threshold for short-term trend strength or weakness. If this level is successfully broken through, the next resistance would be between HKD 105 and HKD 106.7.
![$BYD COMPANY (01211.HK)$ BYD Co., Ltd. (01211.HK) has recently shown a consolidation pattern in its share price, closing at HKD 99.35 as of February 24, down 0.75%. This article will provide an in-depth analysis of BYD's short-term trend for investors by integrating the latest technical data, market news, and insights from the [HK Stocks Podcast]. We will also explain how to use warrant and bull/bear certificate products to capture potential opportunities, while reviewing the recent performance of these products. From a technical perspective, BYD is currently in a critical consolidation phase. Recently, the stock price has fluctuated near the middle line of the Bollinger Bands. Multiple moving averages including the 10-day line (HKD 96.98), 30-day line (HKD 97.02), and 60-day line (HKD 96.86) are quite close, indicating similar short- and medium-term costs without a clear direction. In terms of technical indicators, the RSI is at 56, reflecting a relatively balanced buying and selling power. Several oscillation indicators like the Stochastic Oscillator and CCI have issued neutral signals, showing no strong one-sided trend in the overall technical picture. Regarding support and resistance levels, based on the latest technical data, BYD's primary short-term support zone is between HKD 94.6 and HKD 94.9. This area represents the low point during the pullback in early February and holds certain support strength. If this level is breached, the next key support would be around HKD 92 to HKD 91.3, which marks the bottom of a dense trading range since December last year. As for resistance levels, the stock price is currently constrained by...](https://nnqimage.futunn.com/sns_client_feed/1162342/20260225/web-1771986081514-z0t9TD7KMw.png/big?area=1&is_public=true&imageMogr2/ignore-error/1/format/webp)
Reviewing Simon’s insights from the January 30 episode of [HK Stocks Podcast], he noted that BYD’s stock price had fallen significantly, closing at HKD 97.75, already breaking below the midline position of the Bollinger Bands daily chart. Some investors were concerned about the potential downside if BYD continued to fall, while others held bear certificates with a redemption price of HKD 106. Simon’s technical analysis suggested that BYD’s immediate support was at HKD 94.6, with further support at HKD 91.3 if that level failed. On the resistance side, the short-term resistance was at HKD 101.5, with higher resistance at HKD 105 upon a breakout. For investors interested in deploying bear certificates on BYD, Simon recommended prioritizing products with a redemption price above HKD 105, such as targets priced at HKD 106 or higher, to effectively mitigate the risk of a rebound triggering redemption clauses. Comparing with the latest technical data, the support at HKD 94.6 and resistance at HKD 101.5 remain valid, reflecting the ongoing relevance of the technical analysis.
On the market news front, BYD has been active recently, adding fundamental variables to its stock price movement. The company launched a new mobility brand called 'Linghui Auto,' targeting ride-hailing and corporate vehicle markets, which helps differentiate between B-end and C-end markets, reducing the 'ride-hailing' label for the Dynasty and Ocean series models and potentially having a positive impact on premium branding for individual consumers. Additionally, the company is actively expanding into overseas niche markets, unveiling the interior of its first all-electric K-Car 'RACCO,' aimed at the Japanese market, showcasing the deepening of its international strategy. However, the short-term stock price faces challenges from industry data; reports indicate that domestic new energy vehicle sales in January were affected by subsidy rollbacks, with BYD’s domestic sales declining year-over-year but export volumes growing, reflecting a strategic shift towards overseas markets and high-end positioning. These mixed messages could increase short-term volatility in the stock price but lay a foundation for long-term development.
For investors looking to capture short-term fluctuations, derivatives such as warrants and callable bull/bear contracts (CBBCs) are efficient tools. Their advantage lies in allowing participation in the underlying stock's movement with less capital while enabling precise risk management. CBBCs have a mandatory call level, which lets investors know in advance the price at which the product may be called, aiding in risk control. Warrants offer a variety of terms, allowing investors to choose products based on their predictions about the market’s potential rise or fall and time frame. When deploying these products, it is essential to align their terms closely with the underlying stock's support and resistance levels.
Reviewing the products mentioned in this column on February 16, their performance over the following two days demonstrated the high sensitivity of warrants and CBBCs. During that period, the underlying stock BYD rose by 2.35% over two days, driving significant gains in several products: HSBC call warrant (23658) and UBS Group call warrant (23812) recorded increases of 13% and 12%, respectively; while BOC bull contract (55019) $BI#BYD RC2612E.C (55019.HK)$ and (55018) $BI#BYD RC2612D.C (55018.HK)$ rose by 14% and 15%, respectively, due to the leverage effect, outpacing the underlying stock and fully showcasing the leverage characteristics of derivatives.
![$BYD COMPANY (01211.HK)$ BYD Co., Ltd. (01211.HK) has recently shown a consolidation pattern in its share price, closing at HKD 99.35 as of February 24, down 0.75%. This article will provide an in-depth analysis of BYD's short-term trend for investors by integrating the latest technical data, market news, and insights from the [HK Stocks Podcast]. We will also explain how to use warrant and bull/bear certificate products to capture potential opportunities, while reviewing the recent performance of these products. From a technical perspective, BYD is currently in a critical consolidation phase. Recently, the stock price has fluctuated near the middle line of the Bollinger Bands. Multiple moving averages including the 10-day line (HKD 96.98), 30-day line (HKD 97.02), and 60-day line (HKD 96.86) are quite close, indicating similar short- and medium-term costs without a clear direction. In terms of technical indicators, the RSI is at 56, reflecting a relatively balanced buying and selling power. Several oscillation indicators like the Stochastic Oscillator and CCI have issued neutral signals, showing no strong one-sided trend in the overall technical picture. Regarding support and resistance levels, based on the latest technical data, BYD's primary short-term support zone is between HKD 94.6 and HKD 94.9. This area represents the low point during the pullback in early February and holds certain support strength. If this level is breached, the next key support would be around HKD 92 to HKD 91.3, which marks the bottom of a dense trading range since December last year. As for resistance levels, the stock price is currently constrained by...](https://nnqimage.futunn.com/sns_client_feed/1162342/20260225/web-1771985904909-nsBsRcqYAq.png/big?area=1&is_public=true&imageMogr2/ignore-error/1/format/webp)
Under the current market conditions, investors can select from the following products based on their outlook. If optimistic about BYD holding its support level and breaking upward, one might consider deploying call warrants or bull contracts. The HSBC call warrant (23658) $HS-BYD @EC2605B.C (23658.HK)$ with a strike price of HK$99.16, close to the current underlying stock price, is an in-the-money warrant. Its premium and implied volatility are among the lowest in similar products, representing relatively transparent investment costs, making it suitable for capturing the underlying stock's recovery towards the HK$101.5 resistance level. The BOC call warrant (23816) $BI-BYD @EC2609C.C (23816.HK)$ has a strike price of HK$98.22 and provides 4.6x leverage with low implied volatility, ideal for positioning if expecting a rebound from the HK$94.9 support level. For those confident in a strong rebound directly challenging the HK$105 resistance, high-leverage bull contracts could be considered. The J.P. Morgan bull contract (63866) $JP#BYD RC2608K.C (63866.HK)$ with a call price of HK$93, offers actual leverage as high as 11.7x with a low premium. Its call price is set above the support zone at HK$92, providing a relatively safe buffer. The UBS Group bull contract (61999) has a call price of HK$92.8 and offers 11.6x actual leverage, also being among the options with the lowest premiums, both serving as sensitive tools for betting on a rebound.
Conversely, if investors believe BYD will remain constrained by the HK$101.5 resistance and test the HK$94.9 or even lower support at HK$92, they might consider put warrants or bear contracts. The BOC put warrant (22386), with a strike price of HK$81.83, has the lowest premium and implied volatility among similar products, making it suitable for a bearish medium-term view, targeting a decline to the support zone. The UBS Group put warrant (22314) $UB-BYD @EP2608A.P (22314.HK)$ also with a strike price of HK$81.83, provides 5.2x leverage with a relatively low premium, another option for bearish deployment. For aggressive short-term bears expecting continued pressure on the stock price, bear contracts offer higher leverage. The J.P. Morgan bear contract (61928) $JP#BYD RP2808C.P (61928.HK)$With a call price of 115 yuan and an actual leverage of 6.2 times, it is the choice with the highest actual leverage among bear certificates. The call price is set above 106.7 yuan, effectively avoiding the risk of short-term rebounds. This aligns with Simon's strategy on the January 30th [Hong Kong Stock Podcast] to choose products with a call price above 105 yuan.
![$BYD COMPANY (01211.HK)$ BYD Co., Ltd. (01211.HK) has recently shown a consolidation pattern in its share price, closing at HKD 99.35 as of February 24, down 0.75%. This article will provide an in-depth analysis of BYD's short-term trend for investors by integrating the latest technical data, market news, and insights from the [HK Stocks Podcast]. We will also explain how to use warrant and bull/bear certificate products to capture potential opportunities, while reviewing the recent performance of these products. From a technical perspective, BYD is currently in a critical consolidation phase. Recently, the stock price has fluctuated near the middle line of the Bollinger Bands. Multiple moving averages including the 10-day line (HKD 96.98), 30-day line (HKD 97.02), and 60-day line (HKD 96.86) are quite close, indicating similar short- and medium-term costs without a clear direction. In terms of technical indicators, the RSI is at 56, reflecting a relatively balanced buying and selling power. Several oscillation indicators like the Stochastic Oscillator and CCI have issued neutral signals, showing no strong one-sided trend in the overall technical picture. Regarding support and resistance levels, based on the latest technical data, BYD's primary short-term support zone is between HKD 94.6 and HKD 94.9. This area represents the low point during the pullback in early February and holds certain support strength. If this level is breached, the next key support would be around HKD 92 to HKD 91.3, which marks the bottom of a dense trading range since December last year. As for resistance levels, the stock price is currently constrained by...](https://nnqimage.futunn.com/sns_client_feed/1162342/20260225/web-1771985921347-mgnrjCY7P2.png/big?area=1&is_public=true&imageMogr2/ignore-error/1/format/webp)
Interactive Questions:
1. For BYD's short-term trend, do you think it will first break through the resistance at 101.5 yuan or test the support at 94.9 yuan? Feel free to leave a comment sharing your thoughts.
2. When deploying bull and bear certificates, would you prefer choosing a call price closer to the underlying stock for higher leverage, or selecting a further call price to increase safety buffer? Feel free to share your experience.
Reminder to everyone: Follow Jenny’s Hong Kong stock warrants updates for more professional market analysis and product insights.
#BYD #1211 #HongKongStock #TechnicalAnalysis #SupportResistance #Warrants #Options #BullBearCertificates #ImpliedVolatility #HongKongStockPodcast
Risk Disclaimer: The above content only represents the author's view. It does not represent any position or investment advice of Futu. Futu makes no representation or warranty.Read more

Comments
to post a comment
5