
How to view the post-holiday market trend in Hong Kong stocks?

Multiple sell signals for the Hang Seng Index, will the short-term volatile pattern persist?
On February 24, the Hong Kong stock market showed weakness, $Hang Seng Index (800000.HK)$
Closing at 26,590.32 points, down 1.82% in a single day, with a turnover of 250.992 billion yuan and a 5-day volatility of 3%.
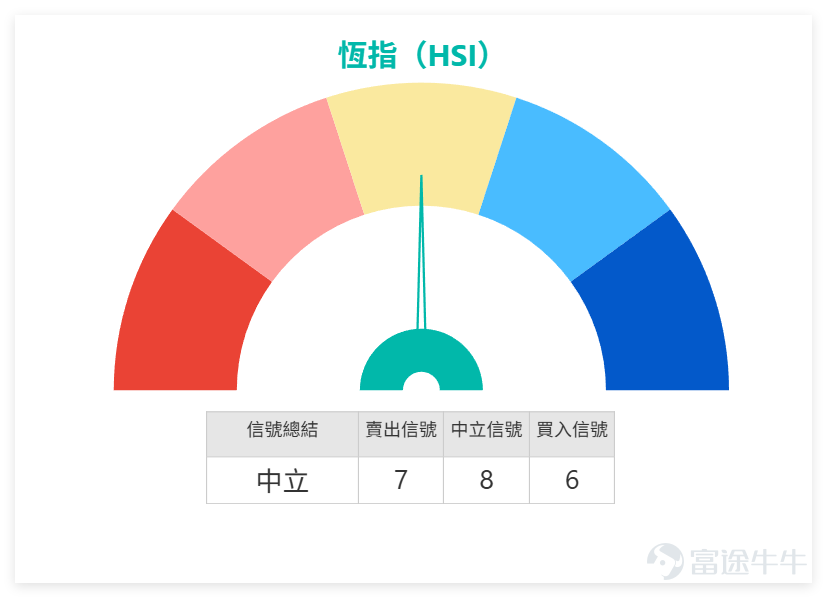
From a technical indicator perspective, the RSI of the Hang Seng Index is 48, which is in the neutral zone; multiple oscillation indicators such as MACD, Williams %R, and Stochastic Oscillator are showing sell signals. The overall technical signal is neutral, with an intensity of 8.

The support levels for the Hang Seng Index are 26,277 points and 25,909 points, while resistance levels lie at 27,142 points and 27,820 points. In the short term, attention should be paid to the support near 26,277 points. If it can stabilize, there may be a short-term rebound; otherwise, it might further test lower supports.
Key blue chips fell across the board on February 24, with technical patterns showing divergence trends. A detailed analysis combined with various stock indices is as follows:
1. Tencent (00700): Closing price at HKD 520.00, down 3.35% in a single day with volume confirming the decline; short-term trend appears weak. Technically, the closing price is below MA10 (HKD 538.70), MA30 (HKD 582.62), and MA60 (HKD 596.71), currently trading below all key moving averages. The RSI is at 27, entering the oversold zone, signaling an over-adjustment in the short term. Notably, the overall technical indicator summary shows a 'Buy' signal with a strength of 10, while multiple moving averages suggest a 'Strong Buy.' Investors may watch for potential rebounds after the oversold condition.
2. HSBC Holdings (00005): Closing price at HKD 135.30, down 0.44% in a single day, showing relatively limited losses and slightly stronger resilience. The closing price is below MA10 (HKD 136.91) but marginally above MA30 (HKD 133.32), oscillating between short-term and mid-term moving averages. The RSI is at 51, within a neutral range. The overall technical signal is 'Neutral,' with a strength of 10, while multiple moving averages suggest a 'Sell.' In the short term, it is likely to remain in consolidation without a clear trend.
3. China Mobile (00941): Closing price at HKD 79.05, down 0.50% in a single day, showing a relatively stable trend. The closing price is slightly above MA10 (HKD 78.74) but below MA30 (HKD 79.44) and MA60 (HKD 82.10), clearly suppressed by MA30 in the short term. The RSI is at 48, close to the lower limit of the neutral zone. The overall technical signal is 'Buy' with a strength of 8, and multiple moving averages also suggest 'Buy.' If it can break through the suppression of MA30, there may be further upside potential.
4. Overview of other blue chips: ICBC (01398), Bank of China (03988), and Construction Bank of China (00939) show consistent technical signals, all indicating 'Sell' with strengths of 8-9, reflecting significant short-term adjustment pressure. Hong Kong Exchange (00388) and CK Hutchison (00001) are showing 'Buy' or 'Neutral' signals. Notably, the Hong Kong Exchange's RSI is at 46, near the oversold boundary, which could warrant attention. AIA (01299) and Ping An (02318) are showing 'Neutral' signals, with short-term fluctuations expected and no clear direction.
Review and Selection of Warrants and Bull/Bear Products:
(1) Review of Past Warrants and Bull/Bear Products:
Reviewing two Hang Seng Index structured products recommended on February 13, 2026: BOC Bear Certificate (58474) and BOC Bear Certificate (55030). Both products recorded a 10% increase within two days, while the Hang Seng Index only dropped by 0.58% during the same period. This performance highlights the leverage effect of structured products and validates the earlier product screening logic based on market trends, providing investors with valuable insights for review.
(2) Selection of Warrant Products (Based on Hang Seng Index Trends)
By combining the adjustment trend of the Hang Seng Index, technical signals, and product data, we have selected two warrant products that focus on low premiums and appropriate leverage, for investors' reference:
1. BOC Put Warrant (23127): Leverage of 12.5x with an exercise price of 24,875 points. The standout feature of this product is its low premium and implied volatility compared to currently available options, offering a clear cost advantage. It suits investors who are cautious about the short-term outlook of the Hang Seng Index and wish to hedge against adjustment risks, aligning well with the current adjustment phase of the index.
UBS Group Bear Certificate (54764): Leverage of 24.9 times, with a stop-loss level at 27,550 points. This product has the lowest premium, relatively high actual leverage, and an excellent cost-performance ratio. It is suitable for investors who expect short-term adjustments in the Hang Seng Index and are seeking reasonable leveraged returns, but they must be mindful of the stop-loss risk associated with bear certificates and manage their positions appropriately.
Risk Warning: Warrants and bull/bear products are derivative products with significant leverage effects and relatively higher risks. Investors should consider their own risk tolerance carefully, choose wisely, and avoid blindly following trends.
Facing adjustments in the Hang Seng Index, how would you handle your warrants?
A. Hold steady and wait for a rebound. B. Reduce positions appropriately to control risks. C. Increase holdings in low-premium products to aim for leveraged returns. Come share your thoughts in the comment section.
Reminder: This article does not constitute any investment advice.
This article is for reference only and does not constitute any investment advice. The market data, opinions, and analysis contained herein may change at any time without prior notice. We are not responsible for any loss or damage caused by reliance on the information in this article. Technical analysis only shows whether certain technical conditions are met; a comprehensive assessment of asset performance should be conducted using additional data. Decisions to trade should not be based solely on this article. Please note that past performance is not indicative of future results.
#HongKongStocks #RealTimeAnalysis #WarrantsSelection #WarrantsStrategy #DerivativesHedging #BlueChipStocks #HongKongBlueChips #TechnicalAnalysis #HangSengIndexTrends
Risk Disclaimer: The above content only represents the author's view. It does not represent any position or investment advice of Futu. Futu makes no representation or warranty.Read more

Comments
to post a comment
2